
Exploratory Data Analysis (EDA) is a fundamental and indispensable preliminary phase in preparing a machine learning project. It encompasses a comprehensive set of techniques and practices aimed at thoroughly comprehending the intricacies of a dataset before diving into the actual modeling and prediction tasks. EDA is pivotal in steering a project toward success by shedding light on numerous crucial aspects of the data. Here's an in-depth breakdown of how EDA accomplishes this after the process web scraping Airbnb data:
Data Understanding: EDA delves deeply into understanding the dataset by examining its fundamental characteristics. It involves scrutinizing the dataset's size, the data's structure, and the types of variables it contains. Understanding the data's fundamental properties is essential to make informed decisions throughout the project.
Data Quality Assessment: A primary focus of EDA is to identify and rectify data quality issues. It includes detecting and addressing missing values, outliers, and inconsistencies within the data. Cleaning the data at this stage ensures that the subsequent modeling steps are on reliable and accurate information.
Feature Selection and Engineering: EDA plays a pivotal role in selecting the machine learning model's most relevant and informative features (variables). By scrutinizing the relationships between variables and their impact on the target variable, EDA assists in identifying the key factors that are in the modeling process. Additionally, it may inspire the creation of new features through feature engineering, which can enhance the model's predictive power.
Data Distribution Analysis: Understanding data distribution is a critical aspect of EDA. It entails examining statistical properties, such as mean, median, variance, and skewness, and visualizing data distributions through techniques like histograms and density plots. This information guides the selection of appropriate statistical methods and machine learning algorithms, as the choice often depends on the data's distribution.
Correlation Assessment: EDA explores correlations and relationships between different features in the dataset. It helps uncover dependencies and associations that may impact the model's performance. Identifying strong correlations can influence feature selection and assist in deciding whether certain variables should be included or excluded from the analysis.
The EDA (Exploratory Data Analysis) process is a systematic approach to gaining insights and understanding a dataset thoroughly before diving into more advanced data analysis or modeling tasks. It can be summarized as a four-step iterative cycle: Question, Verify, Write, and Repeat. Here's a detailed explanation of each step:
Purpose: The first step in EDA is to define the purpose and objectives of your analysis. What are you trying to achieve with this dataset? What key questions do you want to answer or hypotheses to test?
Formulate Hypotheses: You can formulate hypotheses about the data based on your objectives. These hypotheses are initial assumptions or expectations about the data's characteristics or relationships.
Data Collection: Gather the dataset relevant to your analysis. Ensure the data is complete, accurate, and representative of the problem you're investigating.
Data Cleaning: In this phase, you address data quality issues. It includes handling missing values, outliers, duplicates, and any other inconsistencies in the data.
Data Exploration: Begin exploring the data by calculating summary statistics (e.g., mean, median, standard deviation) and visualizing it using various plots and charts. This step helps you get an initial sense of the data's distribution and characteristics.
Documentation: Document your findings, observations, and any data transformations or cleaning steps you performed. This documentation is crucial for transparency and future reference.
Initial Insights: Summarize your initial insights and observations about the dataset. It may include notable trends, patterns, or anomalies you've identified during the exploration phase.
Revised Hypotheses: You may need to revise or develop new hypotheses based on your initial data exploration. Your understanding of the data may change as you dig deeper.
Iterate and Refine: The EDA process is iterative. You should revisit earlier steps as you uncover more about the data. For example, if initial assumptions are incorrect, you can refine your analysis and hypotheses.
Advanced Analysis: Depending on the complexity of your problem and dataset, you may perform more advanced analysis techniques in subsequent iterations, such as feature engineering, statistical tests, or machine learning modeling.
Communication: Share your findings and insights with stakeholders or team members. Effective communication of your results is crucial for making informed decisions and guiding the next steps in your data analysis project.
To begin the Airbnb Exploratory Data Analysis of Hawaii, we have obtained the dataset from Inside Airbnb, specifically the "listings.csv" file, which contains summary information and various metrics related to listings in Hawaii. This dataset will serve as the primary data source for our initial exploratory analysis, and it is particularly suitable for creating visualizations and gaining insights into the Airbnb listings in Hawaii.

This phase establishes an initial understanding of the dataset's structure and content, providing a foundational context for further analysis.
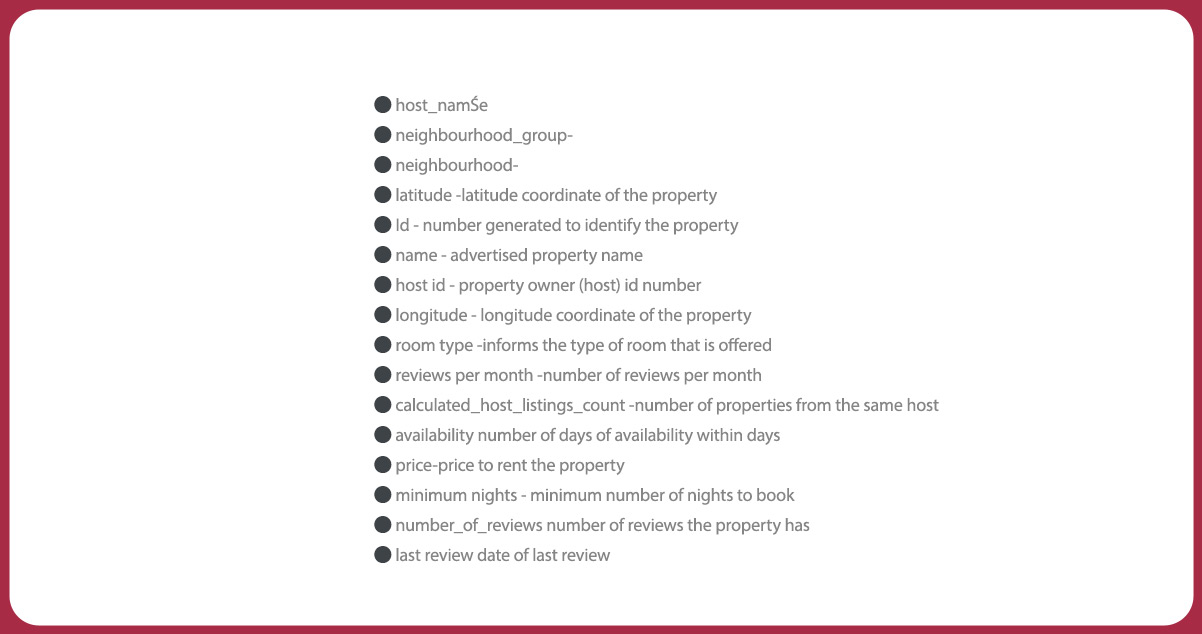
Before initiating any analysis, it's essential to get a glimpse of the dataset by examining the initial five entries or rows. This initial inspection allows us to assess the dataset's format and content.
Change the data of above image in below format
Id: 5064, 5261, 5386, 5387, 5389
Name: Keep name column as it is
Host_id: 7256, 7600, 7676, 7676, 7787
Host_name: Keep host name column same as it is
Neighbourhood_group: Hawaii, Hawaii, Hawaii, Hawaii, Kauai
Neighbourhood: keep neighbourhood same
Latitude: 20.04094, 20.02520, 18.43110, 18.46412, 20.88300
Longitude: -154.43250, -155.70142, -155.86078, -155.96344, -156.47365
Room_type: Keep as it is
Price: 82, 112, 90, 289, 90
Minimum_nights: keep same
Number_of_reviews: 36, 8, 150, 15, 128
Last_review: keep same
Reviews_per_month: 0.42, 0.08, 1.34, 0.22, 1.00
Listisng_count: 2,4,2,2,1
Availability_365: 350, 250, 281, 215, 160
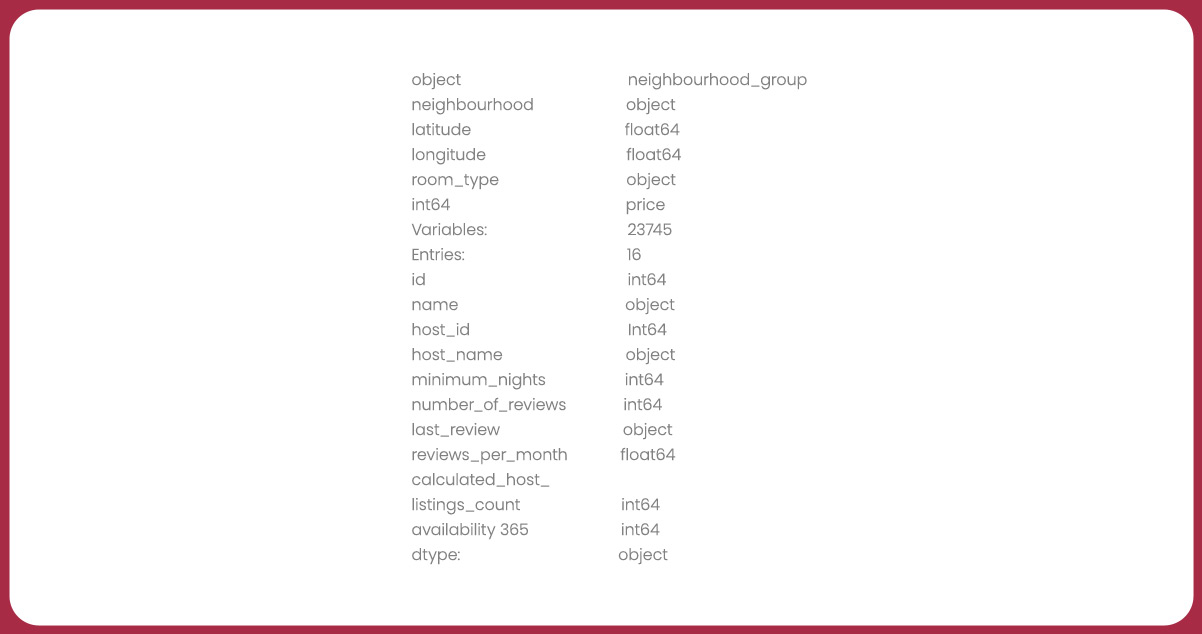
Now, let's determine the dataset's characteristics, including the number of entries and the data types associated with each column. It's important to note that the dataset we've obtained is the "short" version of Airbnb data. A more extensive version is available with 35,847 entries and 106 variables, which is in the "listings.csv.gz" file on the same page.
The dataset's quality is per the presence of missing values. Assessing the extent of these null values about the total number of entries is crucial
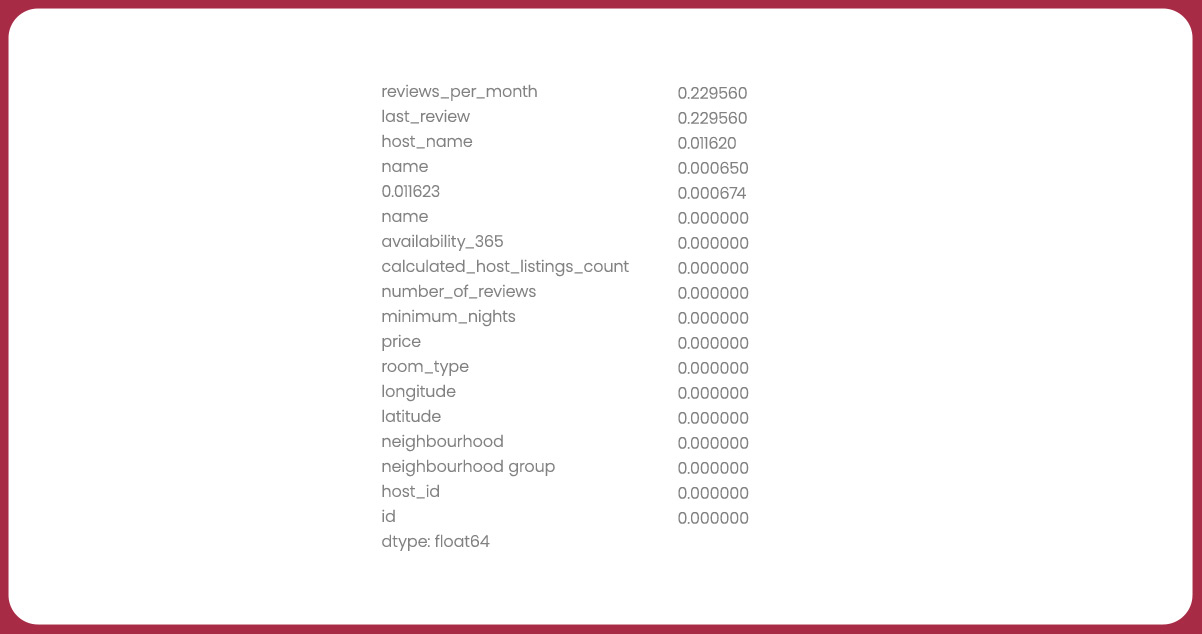
The "reviews_per_month" and "last_review" columns contain nearly 23% of their values missing. The "host_name" variable exhibits approximately 1.2% of null values, while the "name" variable has around 0.07% of missing values.
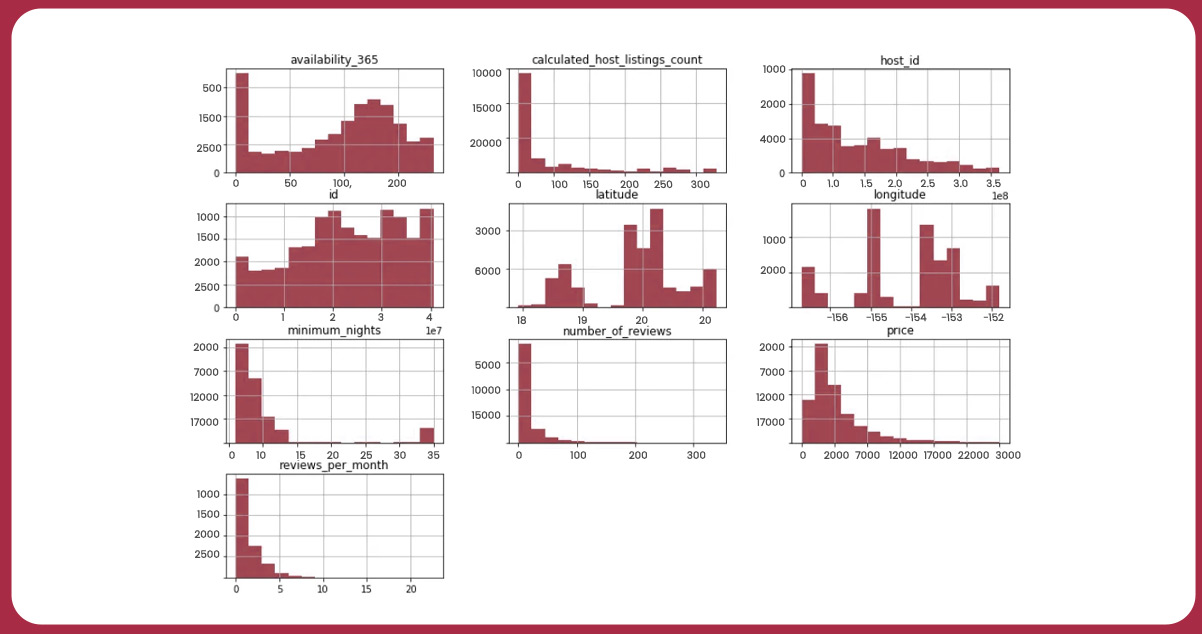
To ascertain the distribution of the variables, we will create histograms.
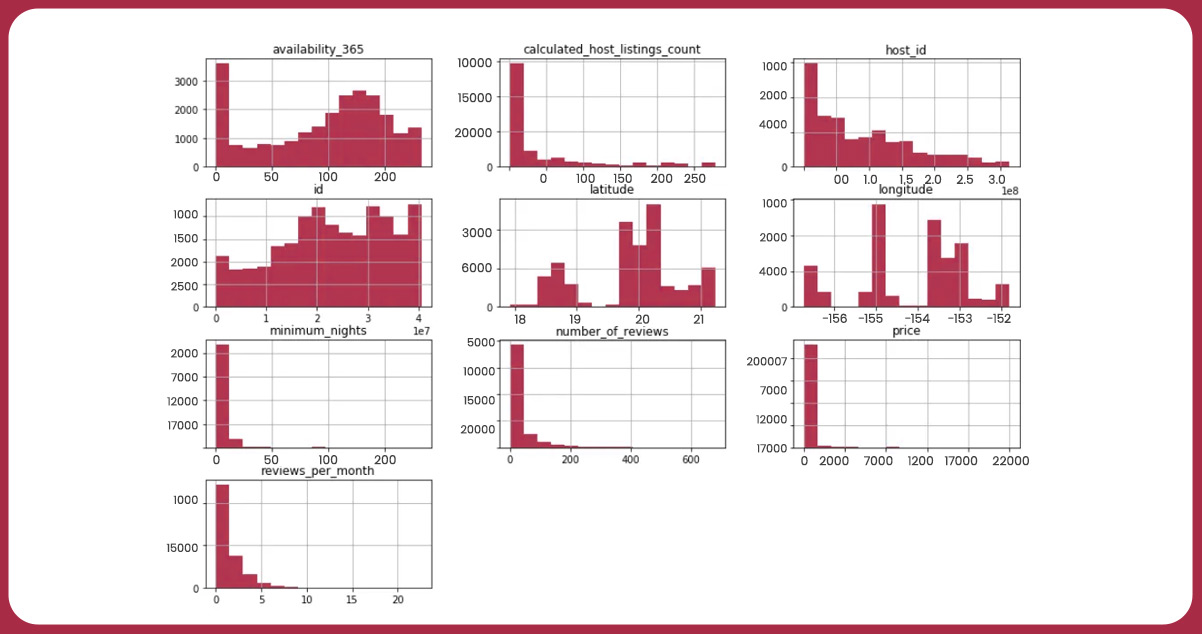
When examining the histogram distributions, we can look for indications of potential outliers. Let's consider variables like "price," "minimum_nights," and "calculated_host_listings_count."
These variables may exhibit values that do not conform to a typical distribution and can skew the overall graphical representation. To confirm the presence of outliers, we have two effective methods:
Statistical Summary using the describe() Method:
This method provides a statistical dataset summary, including measures like mean, standard deviation, quartiles, and extreme values. Outliers often stand out in extreme values.
Boxplots for Variable Visualization:
Boxplots are visual representations that display the distribution of a variable, showing its median, quartiles, and potential outliers as individual data points beyond the "whiskers" of the boxplot. They help visualize and identify outliers.
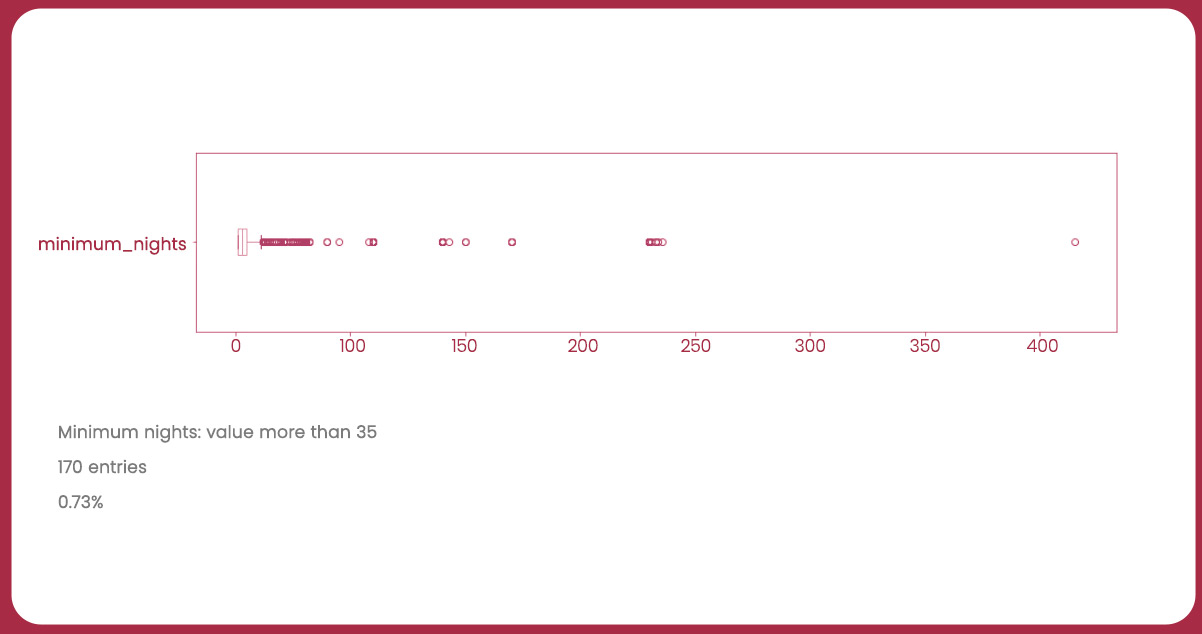
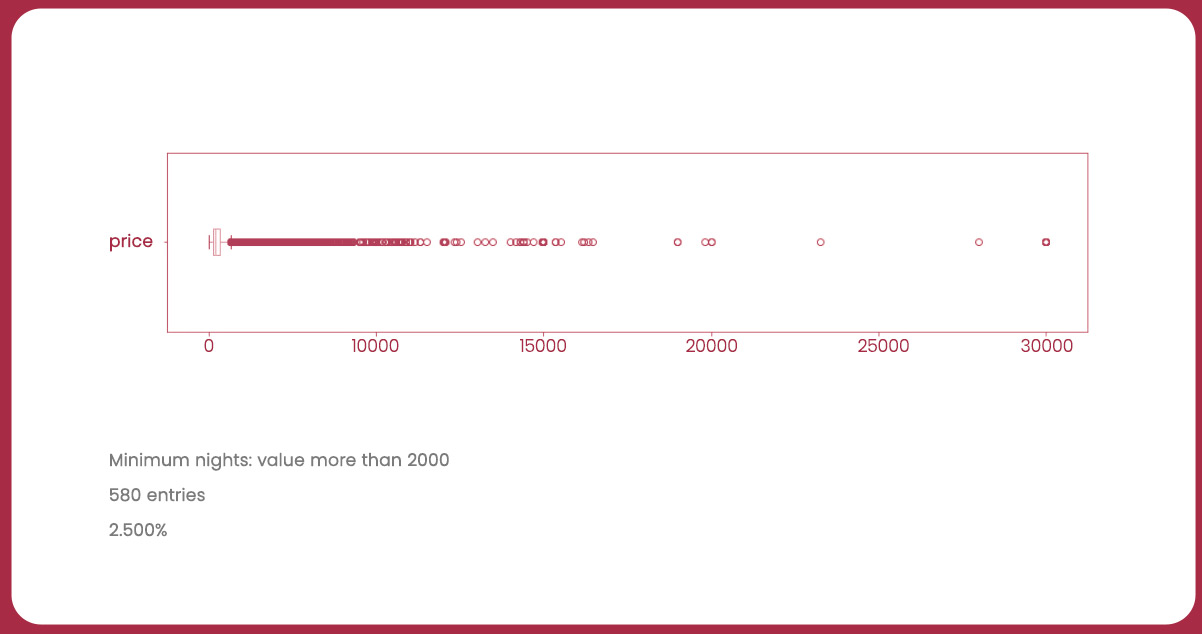
Having identified outliers in the "price" and "minimum_nights" variables, let's clean the DataFrame to remove these outliers and then plot a new histogram.
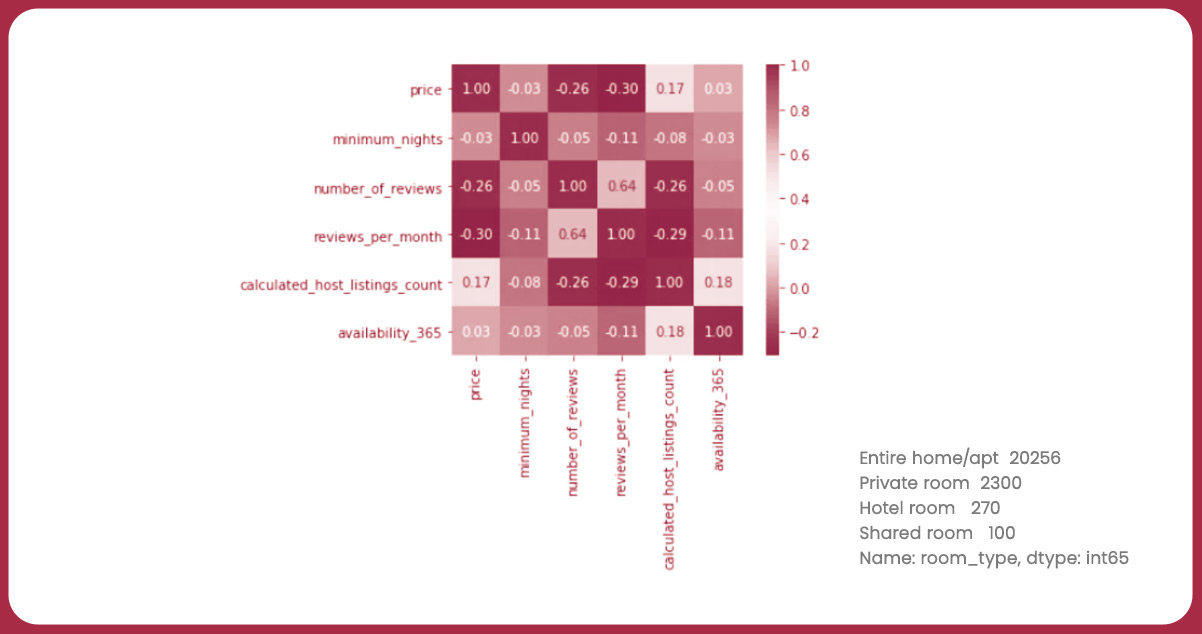
We can calculate the correlation to assess the relationships or similarities between two variables. This correlation quantifies the strength and direction of the relationship. To analyze the correlations between the variables of interest, travel data scraping services will perform the following steps:
Calculate a correlation matrix that shows the correlation coefficients between pairs of variables.
Generate a Heatmap:
Utilize the seaborn library to create a heatmap visualizing the correlation matrix. The heatmap provides a clear and intuitive representation of the correlations between variables.
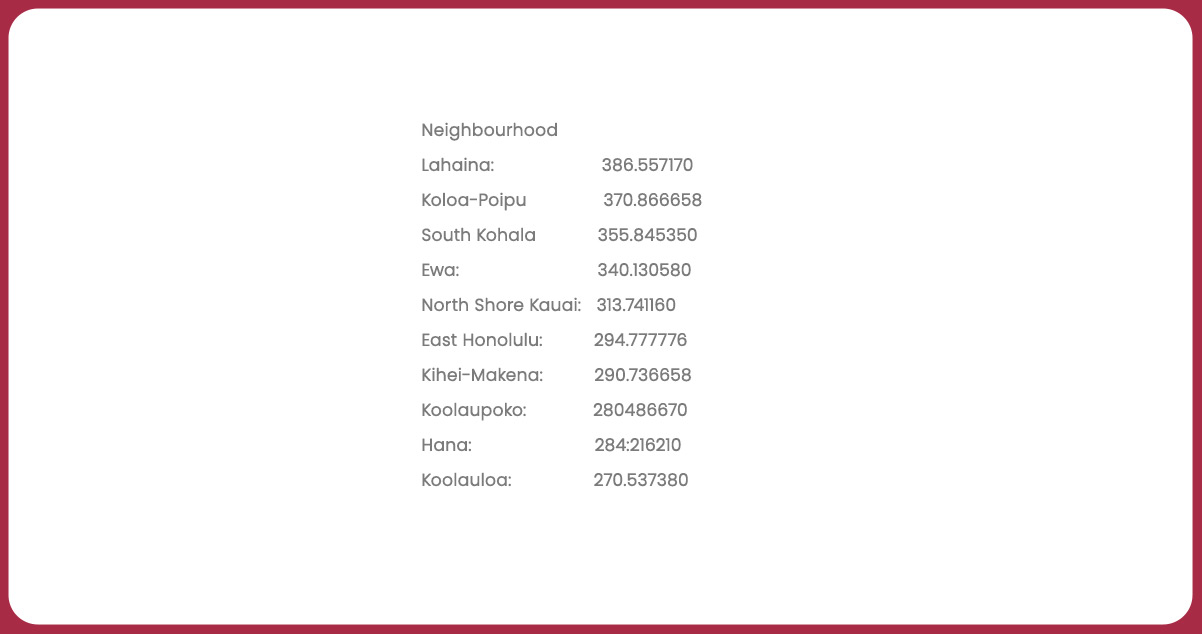
To identify the most expensive location in Hawaii, we can employ the groupby() function to compare neighborhoods based on their rental prices. This approach allows us to analyze how rental prices vary across different neighborhoods.
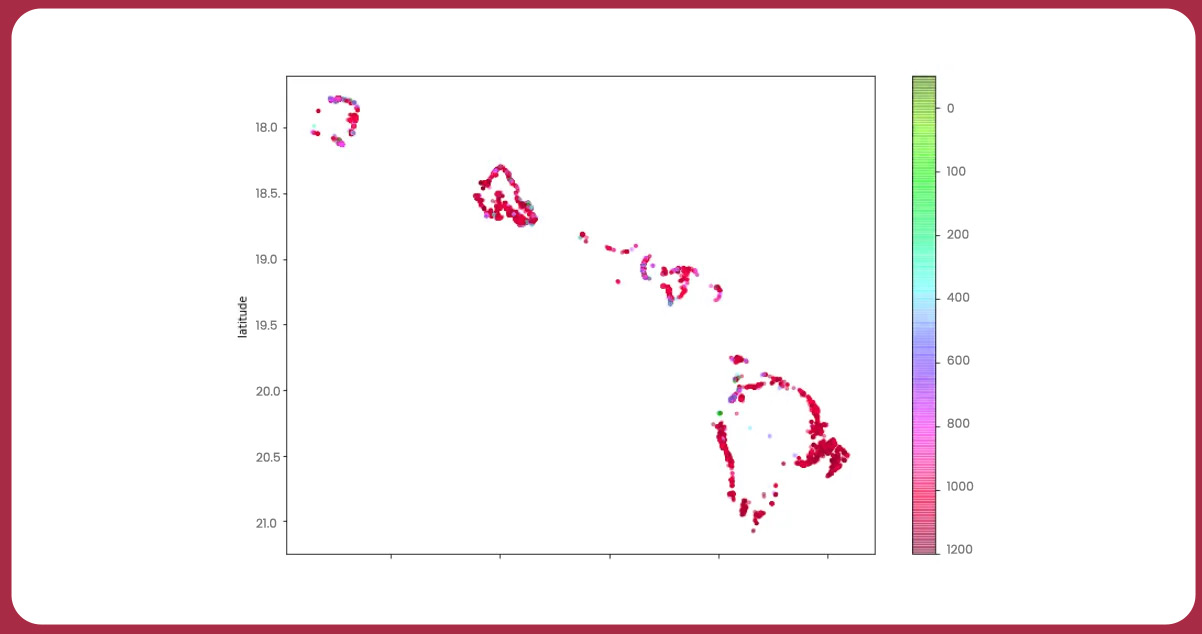
Since the dataset provides latitude and longitude coordinates for properties, we can create a geographical plot by utilizing these values. In this context, we typically consider the longitude as the x-axis (horizontal) and the latitude as the y-axis (vertical) to accurately position and visualize each property's location on a map.
Conclusion: Our initial analysis of the Airbnb database for Hawaii has provided some valuable insights:
Outliers were detected in certain variables, indicating potential data anomalies.
"Entire home/apt" stands out as Hawaii's most prevalent property type, accounting for approximately 86% of all available properties.
Lahaina emerges as the location with the highest average property rental prices, while Koolauloa offers the most affordable options.
It's worth noting that the dataset used for this analysis is a condensed version suitable for preliminary exploration. It is advisable to utilize the complete dataset, including 105 available attributes, to gain a more comprehensive understanding and conduct further exploratory analysis.
Feel free to reach out to iWeb Data Scraping today for comprehensive information! Whether your needs involve web scraping service and mobile app data scraping services, we have you covered. Don't hesitate to contact us to explore your unique requirements and discover how our data scraping solutions can provide you with efficiency and reliability.