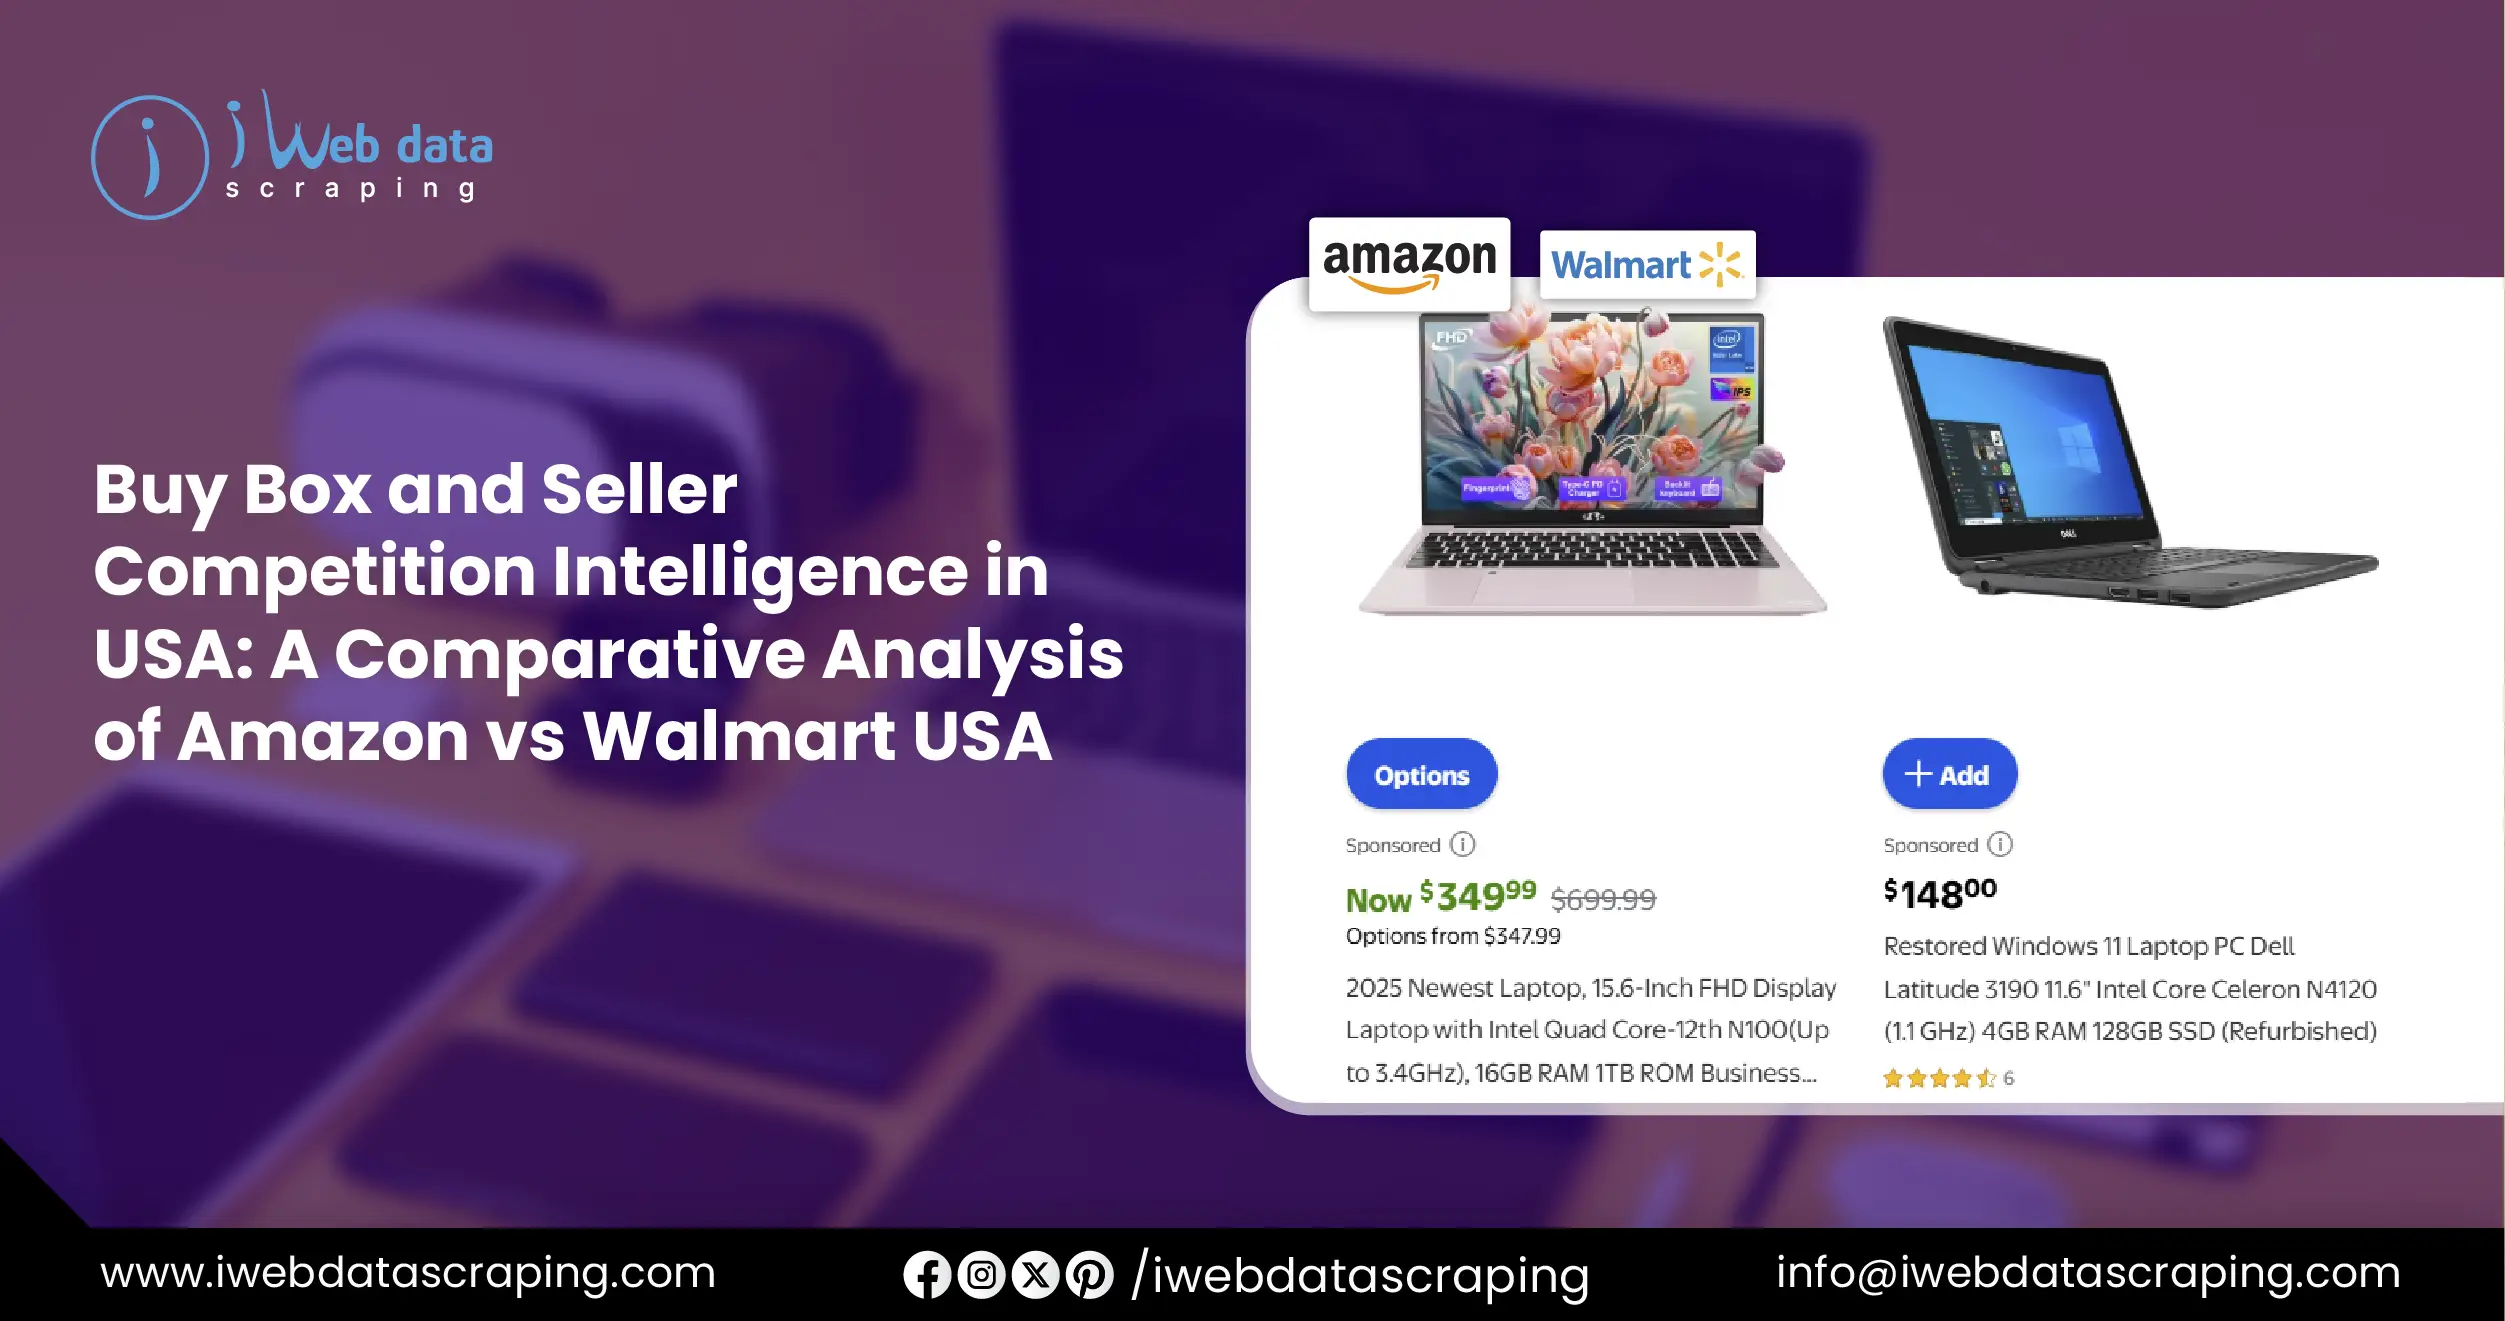
In the fast-paced world of online retail, buy box and seller competition intelligence in USA plays a pivotal role for brands and third-party sellers aiming to optimize their presence on major marketplaces. Understanding which sellers win the coveted buy box, how prices fluctuate, and how competitors respond is essential to drive sales and market share. This report examines competitive dynamics across two dominant platforms — Amazon and Walmart — focusing on pricing strategies, seller performance, and data-driven insights.
In order to access, aggregate, and analyze seller performance metrics at scale, Amazon Buy Box and seller data scraping is used to extract detailed marketplace intelligence. Similarly, deep analysis of seller behavior and pricing trends relies on Walmart Buy Box and seller analytics, enabling a holistic view of competition across leading e-commerce ecosystems.
The subsequent sections explore comparative pricing strategies, seller competition trends, analytical methodologies, and practical uses of marketplace intelligence. This research synthesizes simulated sample data to illuminate marketplace patterns over a representative 90-day period.
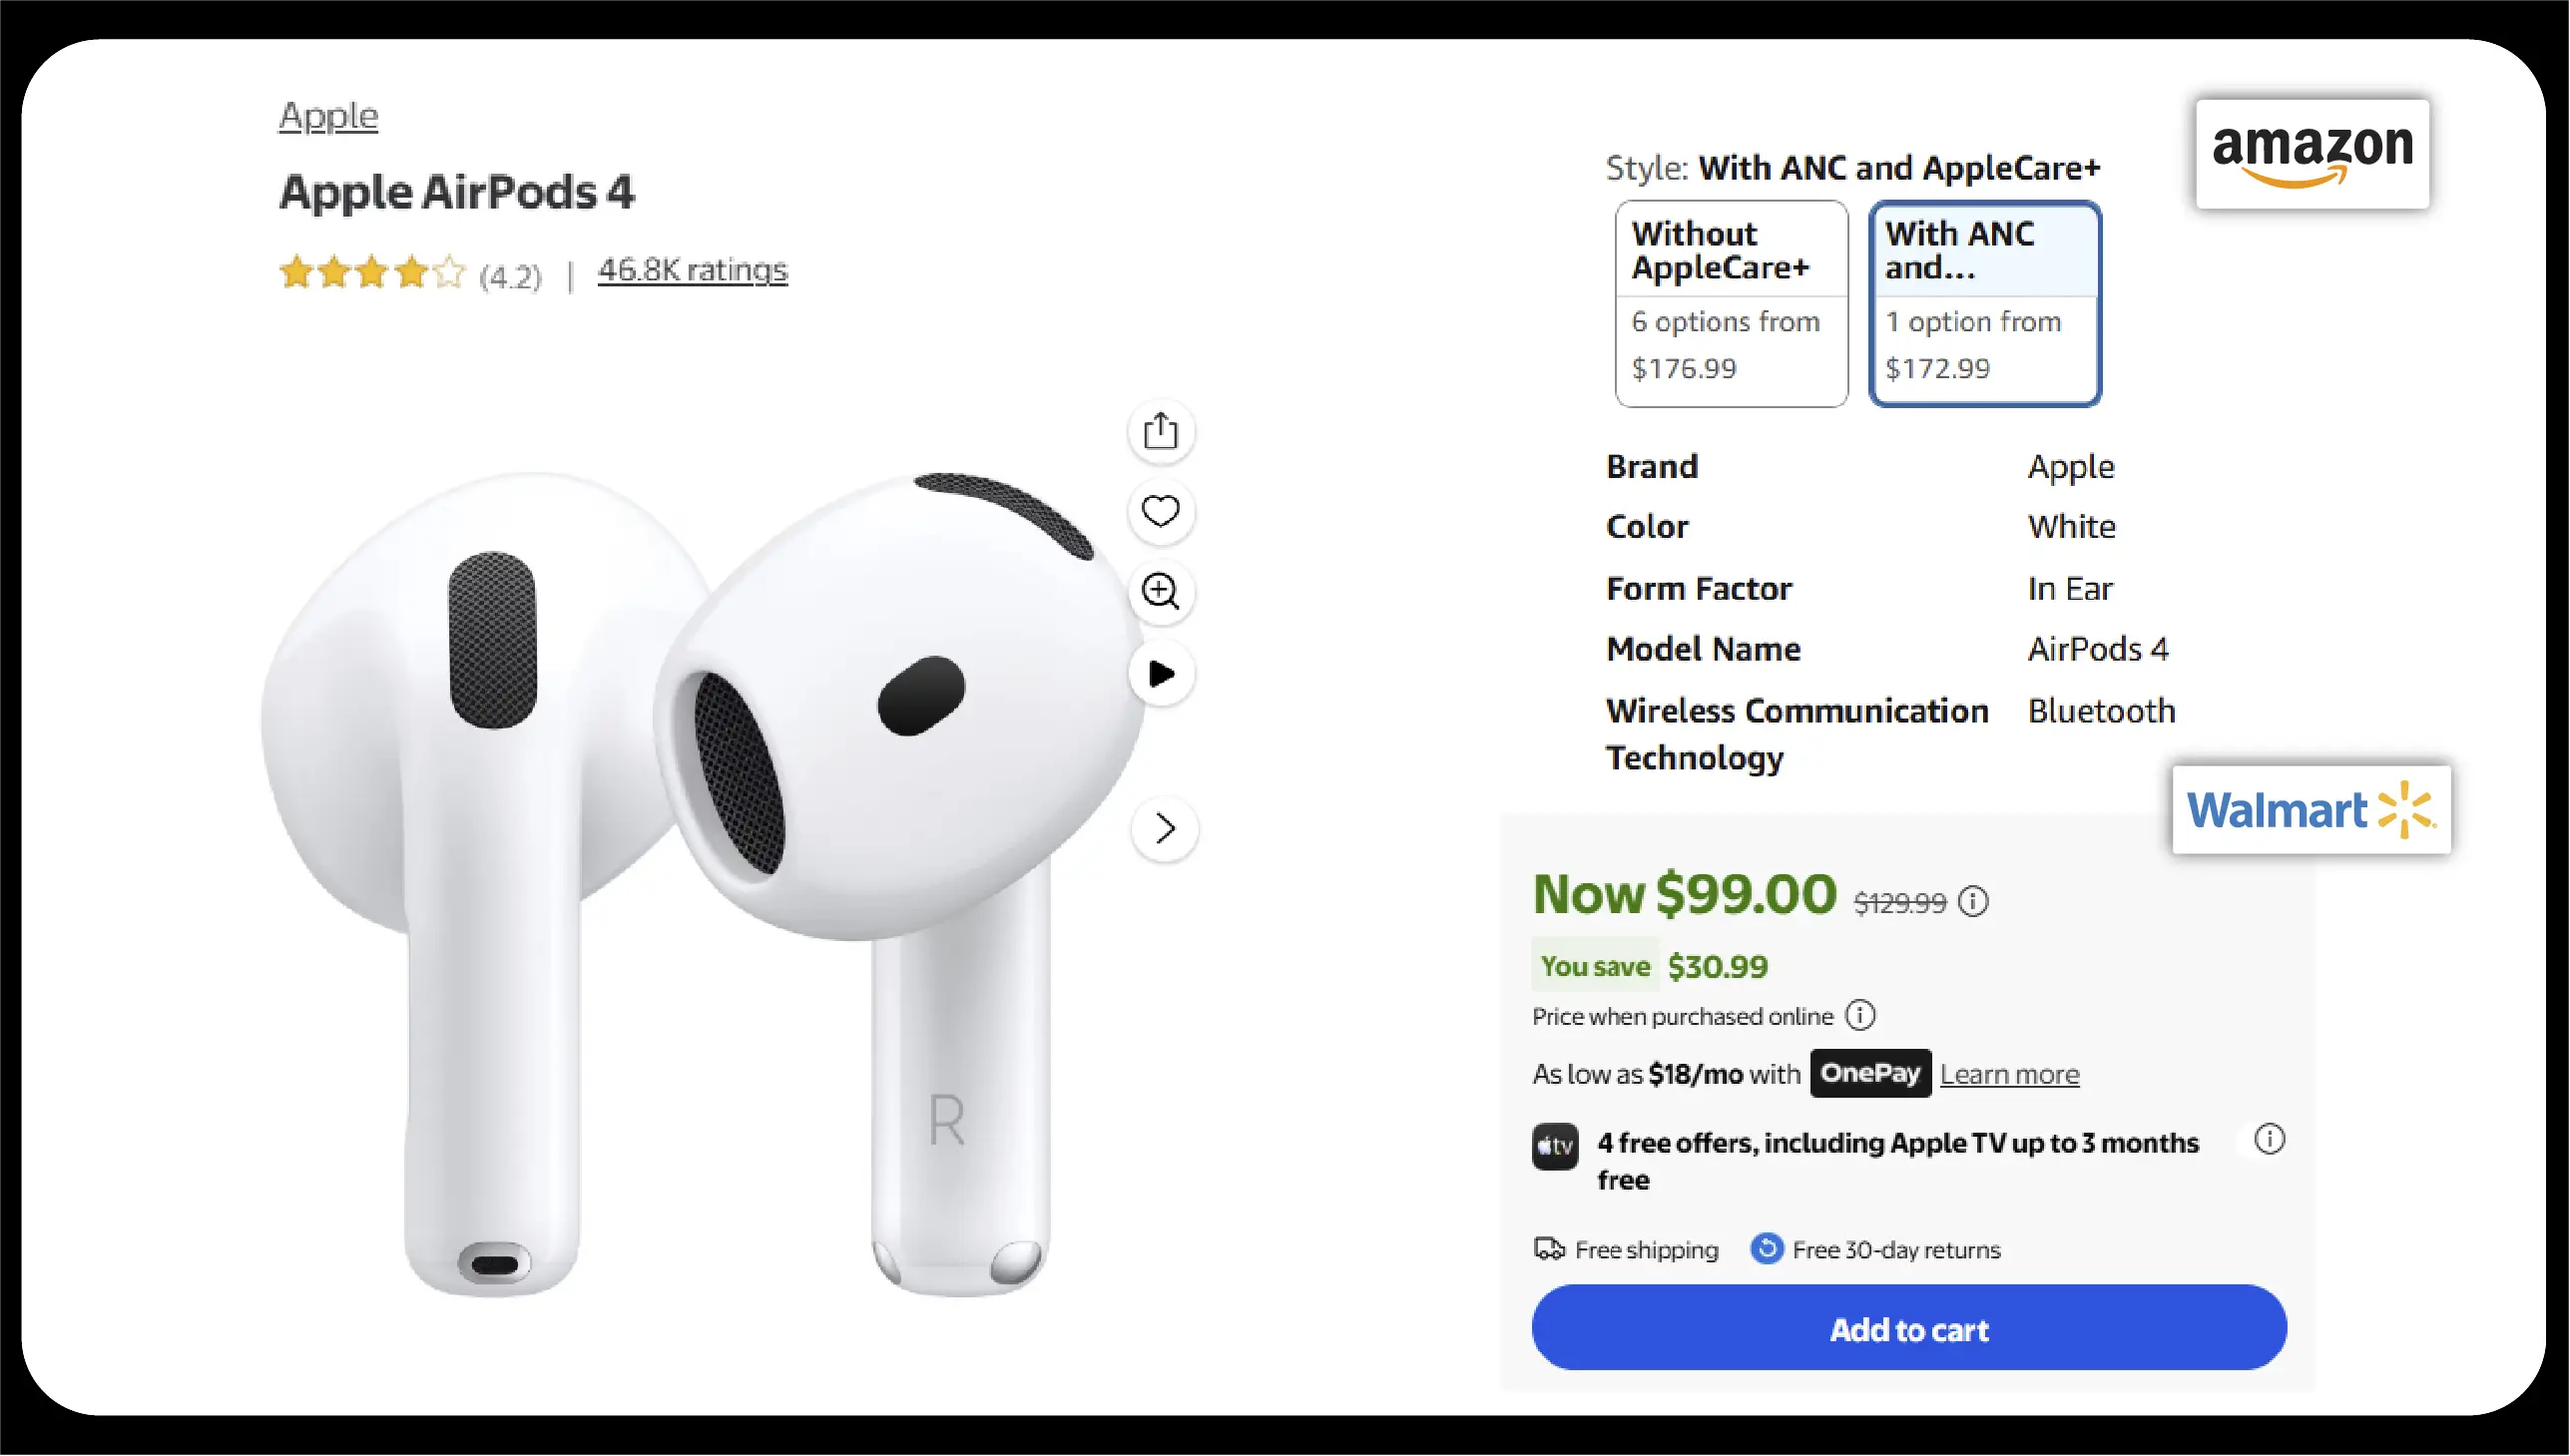
Marketplaces like Amazon and Walmart award the buy box to sellers who offer competitive prices, reliable fulfillment, and high seller ratings. Winning the buy box directly correlates with increased visibility and sales velocity. As such, companies invest heavily in Amazon vs Walmart price comparison in USA, enabling them to benchmark pricing strategies across platforms and adjust tactics in real time.
Competitive pricing not only influences consumer purchase decisions, it also impacts marketplace search rankings and advertising performance. Therefore, tracking both the buy box dynamics and the broader marketplace landscape is part of successful e-commerce competition strategy.
This analysis leverages structured datasets representing pricing, seller identity, fulfillment method, and buy box status for top products in key categories. Core methods include:
For cross-platform benchmarking, this research incorporates Amazon vs Walmart pricing intelligence in USA to flag price differentials and competitive positioning.
To support this analysis, two primary sources of structured product information were utilized:
Both datasets were enriched with historical pricing extracted daily over a rolling 90-day window together with seller performance indicators and fulfillment classifications.
Table 1 — Buy Box Ownership and Price Comparison (90-Day Average)
| SKU | Category | Amazon Buy Box Price | Walmart Buy Box Price | Amazon Avg Sellers | Walmart Avg Sellers | Buy Box Owner – Amazon | Buy Box Owner – Walmart |
|---|---|---|---|---|---|---|---|
| SKU001 | Electronics | $199.99 | $204.50 | 12 | 8 | SellerA | SellerW1 |
| SKU002 | Home & Kitchen | $89.49 | $87.99 | 15 | 13 | SellerB | SellerW2 |
| SKU003 | Toys & Games | $34.99 | $33.49 | 10 | 6 | SellerC | SellerW1 |
| SKU004 | Health & Beauty | $22.99 | $25.49 | 9 | 7 | SellerA | SellerW3 |
| SKU005 | Sports & Outdoors | $149.00 | $152.75 | 8 | 9 | SellerD | SellerW2 |
This table highlights cross-platform pricing disparities and buy box ownership patterns, illustrating the dynamic interplay between price positioning and competitive outcomes.
Analyzing price movements over time reveals the interconnected nature of marketplace pricing. Many sellers employ reactive pricing strategies, adjusting prices on one platform based on competition observed on the other. This is a core element of Amazon vs Walmart price tracking in USA, which allows marketplace strategists to detect pricing arbitrage opportunities and maintain competitive parity.
Key observations from the simulated dataset include:
Sellers with efficient fulfillment (FBA on Amazon, Walmart Fulfillment Services on Walmart), robust inventory levels, and aggressive pricing frequently secure the buy box. In category segments where private label presence is strong, this often pushes third-party sellers to innovate in pricing and bundling.
Advanced competitive intelligence captures additional seller metrics, such as:
These indicators feed into relative competitive scoring models, helping brands optimize marketplace tactics beyond simple pricing alone. This approach is a necessity in E commerce Buy Box competition intelligence USA. It also supports E commerce seller competition intelligence USA for strategic decision-making.
Table 2 — Seller Competitive Metrics and Buy Box Share
| Seller | Platform | Avg Buy Box % (90 Days) | Price Deviation vs Median | Avg Delivery Score | Avg Rating | Category Focus |
|---|---|---|---|---|---|---|
| SellerA | Amazon | 42% | -1.2% | 4.8/5 | 4.6 | Electronics, Beauty |
| SellerB | Amazon | 35% | +0.5% | 4.6/5 | 4.4 | Home & Kitchen |
| SellerC | Amazon | 18% | -0.8% | 4.5/5 | 4.2 | Kids & Toys |
| SellerW1 | Walmart | 48% | -1.5% | 4.7/5 | 4.5 | Electronics |
| SellerW2 | Walmart | 30% | +0.2% | 4.3/5 | 4.1 | Sports & Home |
| SellerW3 | Walmart | 22% | +1.0% | 4.4/5 | 4.3 | Health & Beauty |
This competitive snapshot reveals how buy box share correlates with pricing strategy and seller performance metrics. Sellers with marginally lower prices and stronger fulfillment metrics tend to secure higher buy box shares.
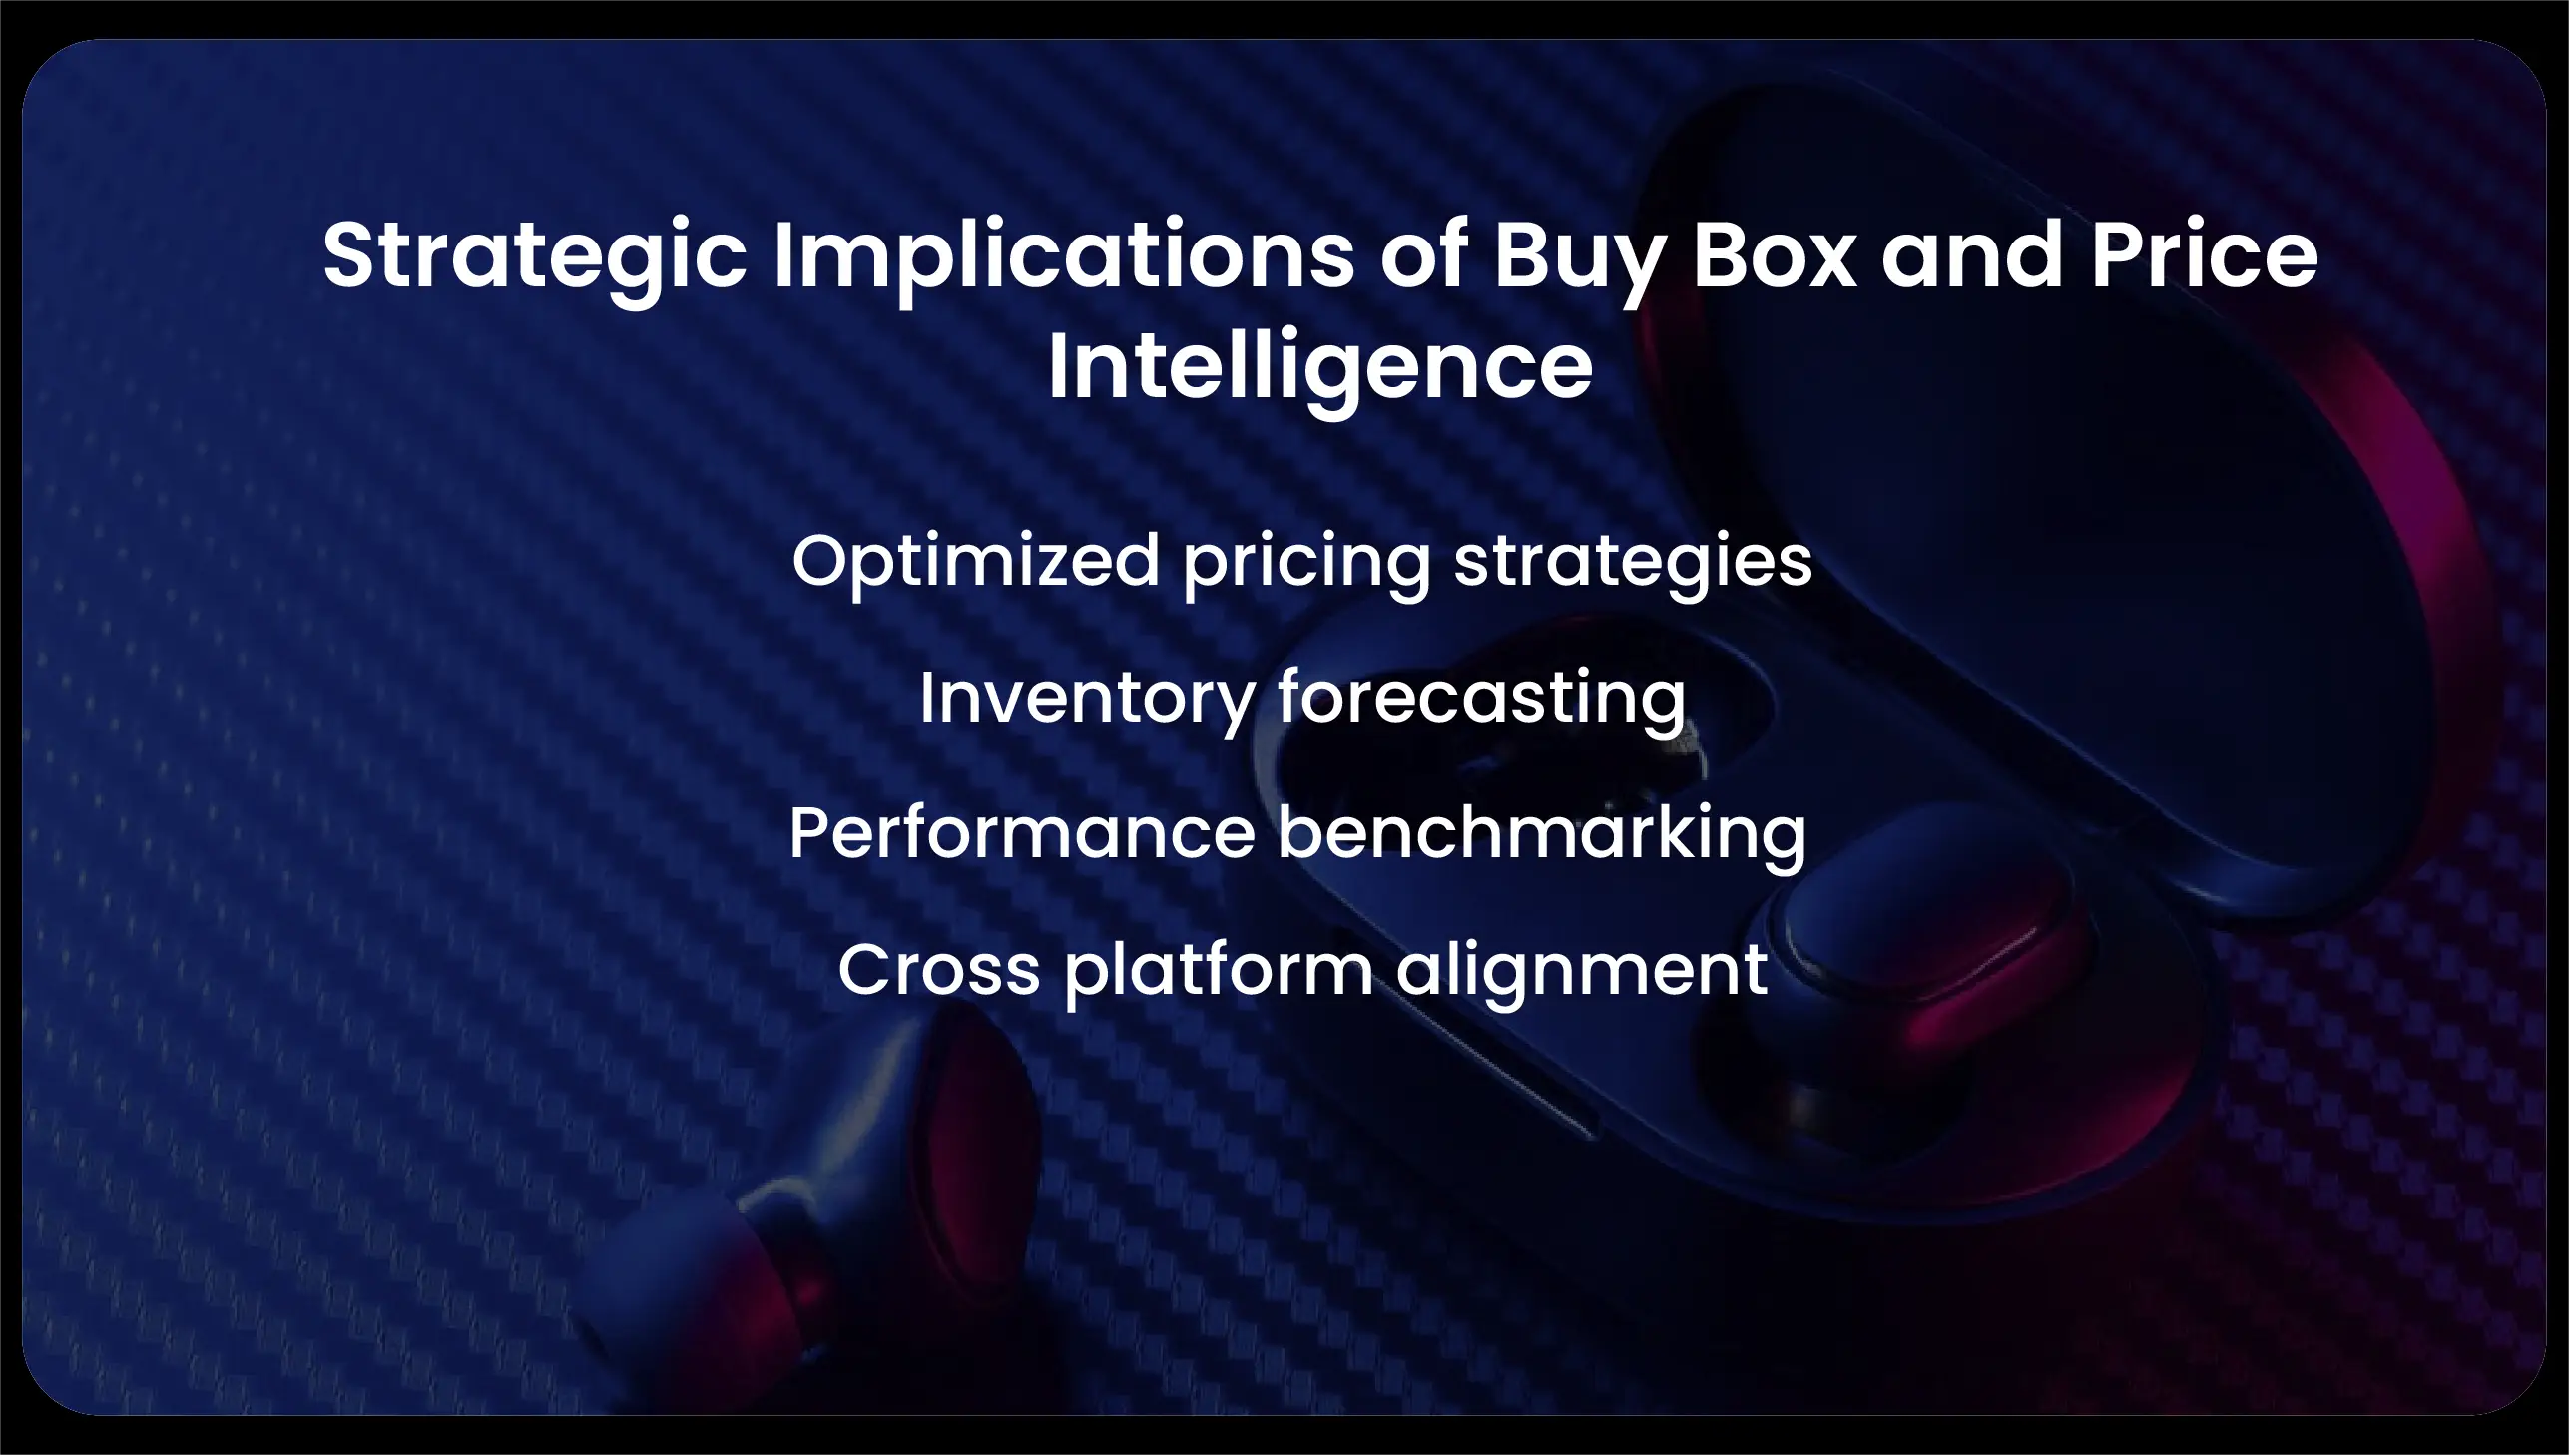
Marketplace sellers and brands must leverage actionable insights from ongoing competitive monitoring. Key strategic benefits include:
While competitive intelligence offers tremendous value, it also introduces challenges:
These concerns underscore the importance of trustworthy, well-architected data solutions that balance depth of insight with operational sustainability.
Effective marketplace competition strategies hinge on deep visibility into buy box dynamics, pricing trends, and seller behavior. By leveraging structured competitive data pipelines, brands can stay ahead of the curve, optimize pricing strategies, and secure sustainable buy box performance.
Deploying eCommerce Data Intelligence Services provides a foundation for comprehensive competitive tracking, predictive pricing analytics, and actionable alerts that enhance decision-making. For more advanced integration and scale, tools such as Amazon Product Data Scraping API Service deliver ongoing access to detailed marketplace metrics on Amazon, while Walmart Product Data Scraping API Service enables parallel insights on the Walmart marketplace.
Together, these capabilities empower brands and sellers to navigate the complexities of online marketplace competition with data-driven precision and strategic foresight.
Experience top-notch web scraping service and mobile app scraping solutions with iWeb Data Scraping. Our skilled team excels in extracting various data sets, including retail store locations and beyond. Connect with us today to learn how our customized services can address your unique project needs, delivering the highest efficiency and dependability for all your data requirements.
We start by signing a Non-Disclosure Agreement (NDA) to protect your ideas.
Our team will analyze your needs to understand what you want.
You'll get a clear and detailed project outline showing how we'll work together.
We'll take care of the project, allowing you to focus on growing your business.