Recently, India has emerged as a pivotal market for makeup brands, driven by the increasing economic empowerment of urban women, a heightened emphasis on beauty and fashion, and the expanding middle class. The Indian cosmetics industry has witnessed unprecedented growth, propelled by the influx of international brands. While local brands face challenges in keeping pace, a select group of Indian companies has thrived by prioritizing innovation and tailoring products to meet the unique preferences of Indian women.
By scraping retail data of Indian makeup brands, India's makeup sector is experiencing rapid expansion. It is poised to achieve a compound annual growth rate (CAGR) of 9.4%, escalating from $1.0 billion in 2020 to an anticipated $1.5 billion in 2025. This growth is primarily by a cohort of quality-conscious and digitally adept consumers, notably driven by millennials who view makeup as a mode of self-expression and are willing to invest in it. Given the substantial opportunity, establishing a brand presence is now more critical than ever.
In the wake of the recent Nykaa IPO making headlines, a client approached us for a market analysis, and we assisted them with the requisite data. This blog represents an independent analysis by iWeb Data Scraping, delving into the landscape of India's top ten makeup brands.
Leveraging our cloud-based web data extraction platform, we meticulously analyzed the Indian makeup market. Our in-depth exploration aims to simplify the complexities for you. This blog presents our detailed analysis of the top 10 makeup brands in India, utilizing market data to offer insights into critical aspects:
Data Collection and Preparation: Unveiling the methodology behind gathering and refining the data using retail data scraping services, ensuring a comprehensive and accurate foundation for our analysis.
Pricing Dynamics and Promotional Insights: Scrape Nykaa product data to delve into the intricate landscape of pricing strategies that makeup brands adopt and uncovering industry promotional trends. Our analysis sheds light on the market's competitive pricing and promotional activities.
Stay tuned as we unravel a wealth of insights derived from our thorough examination of the Indian makeup market using retail data scraper, providing a nuanced understanding of the data collection process, pricing dynamics, and promotional strategies employed by the top 10 makeup brands.
Data Collection Process:
We employed our proprietary data scraping platform to gain initial insights into various makeup brands, extracting publicly available data from a prominent online beauty retailer. The initial dataset consisted of 23,015 records, including duplicates. We explored multiple combinations to enhance data coverage.
Data Attributes Extracted:
For each makeup brand, we extract the following fields:
Brand: Represents the brand name (e.g., L'Oreal).
Sale Price: It is the purchase price after discounts.
Entry and Exit Price: It includes a range of lowest and highest-priced products.
Average Discount Percentage: includes the average discount across a brand's products.
Average Number of Ratings: It includes total star ratings for a specific product.
Average Rating Across Brands: Overall brand rating average.
Discount Range Across All Products: Number of products within specific discount ranges.
Discount Statistics: Products with and without discounts in each brand.
Data Validation and Deduplication Process:
Handling duplicate challenges post-scraping, our web scraping platform, equipped with deduplication features, utilized links as references. After deduplication, the final output comprised 15,600 products, revealing that 33% of the initially scraped data was duplicates. Rigorous quality assurance is essential when collecting web data via scraping.
Tools Utilized for Analysis:
For analytics, we utilized Jupyter Notebook and Python Pandas for data exploration, supplemented by Seaborn as the plotting library. Tableau Public was the platform for publishing interactive visualizations, enabling a comprehensive analysis.
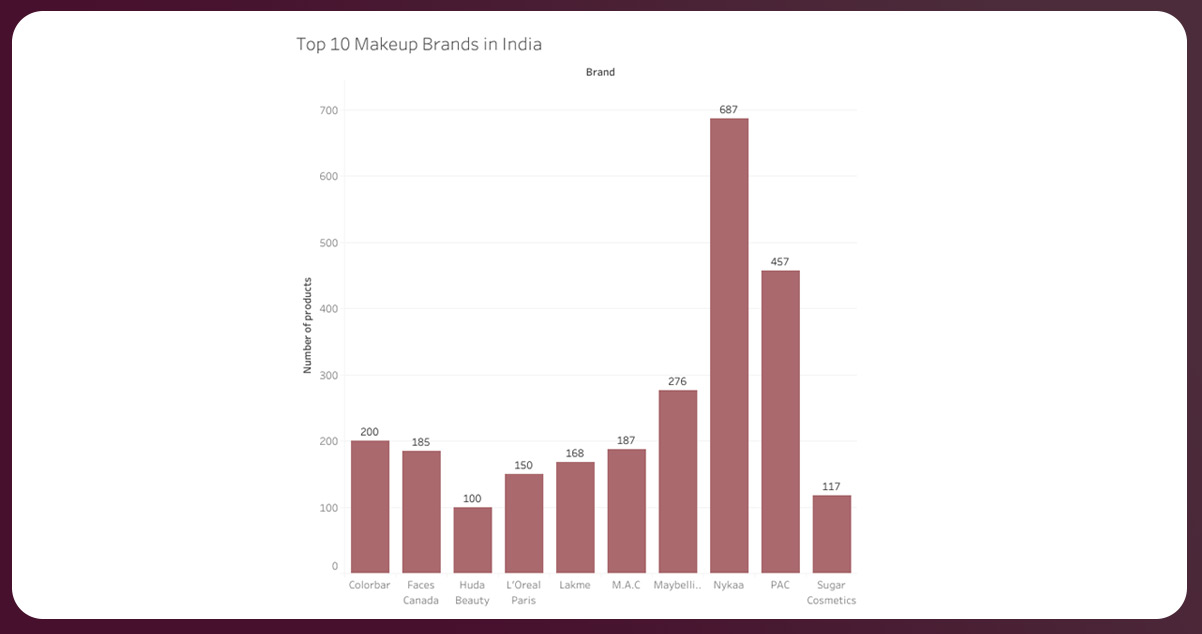
Number of Products: 0, 100, 150, 200, 250, 300, 350, 400
Colorbar: 150
Faces Canada: 145
Huda Beauty: 100
L’Oreal Paris: 130
Lakme: 147
MAC: 148
Maybelline: 186
Nykaa: 378
PAC: 287
Sugar Cosmetics: 118
Discounts are pivotal in the makeup industry, enticing new customers and fostering brand loyalty. By offering reduced prices, brands not only encourage hesitant buyers but also make their customers feel valued, fostering a sense of loyalty.
Top Discount Performers:
Nykaa leads the pack, with a substantial 81% of its products being discounted (467 products).
Colorbar follows closely, striking 92.5% of its products on discount (181 products).
Maybelline also showcases a significant discount strategy, with 50.1% of its products available at reduced prices (132 products).
Minimal Discount Approach:
PAC takes a different stance, with only 1 product on discount, emphasizing a selective approach.
Mac Cosmetics and Huda Beauty also opt for a more reserved strategy, with 2 and 5 products on discount, respectively.
Diverse Discounting Strategies:
Observing the variety of approaches within the same product category is intriguing. Some brands leverage extensive discounts to attract a wider audience, while others adopt a more exclusive strategy, emphasizing product value.
Explore the interactive visualization below to comprehensively view products with and without discounts across the top 10 makeup brands.
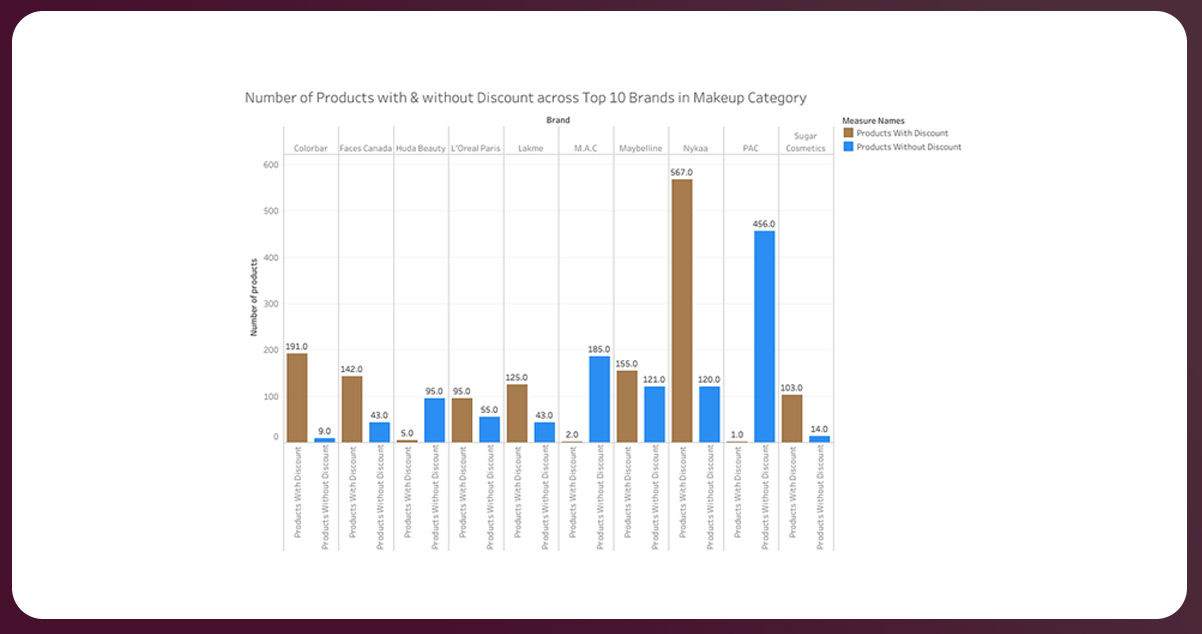
Number of products: 0, 50, 100, 150, 200, 250, 300
Colorbar:
Products with discount
Products without discounts: 8.5
Faces Canada
Products with discount: 134
Products without discount: 12
Huda Beauty
Products with discount: 4.0
Products without discount: 52
Loreal Paris
Products with discount: 92
Products without discount: 45.0
Lakme:
Products with discount: 122
Products without discount: 41
MAC
Products with discount: 1.0
Products without discount: 176
Maybelline
Products with discount: 132
Products without discount: 112
Nykaa:
Products with discount: 467
Products without discount: 112
PAC
Products with discount: 1.0
Products without discount: 422
Sugar Cosmetics
Products with discount: 100
Products without discount: 12
The entry and exit prices of products within a brand serve as crucial indicators, reflecting the price spectrum in which a brand positions its offerings. Understanding these price ranges provides valuable insights into a brand's market positioning and product diversity.
Key Findings
Maybelline's Accessibility: Scrape Maybelline product data to understand the emergence with the lowest entry price, setting a budget-friendly entry point for consumers at Rs 45. It signifies affordability and accessibility, catering to a wide range of customers.
Huda Beauty's Premium Entry: In contrast, scrape Huda Beauty product data to get with the highest entry price of Rs 1100. It signals a strategic positioning in the higher-end segment, targeting customers seeking premium quality.
Top Exit Prices: When considering exit prices (highest-priced products), scrape MAC product data to how how it takes the lead with a notable Rs 8500, reflecting a premium and luxury positioning. PAC follows closely with an exit price of Rs 7795, emphasizing a high-value product range.
Visualizing Price Ranges:
Explore the interactive visualization below to gain a comprehensive view of the minimum and maximum prices within the product portfolios of the top 10 makeup brands.
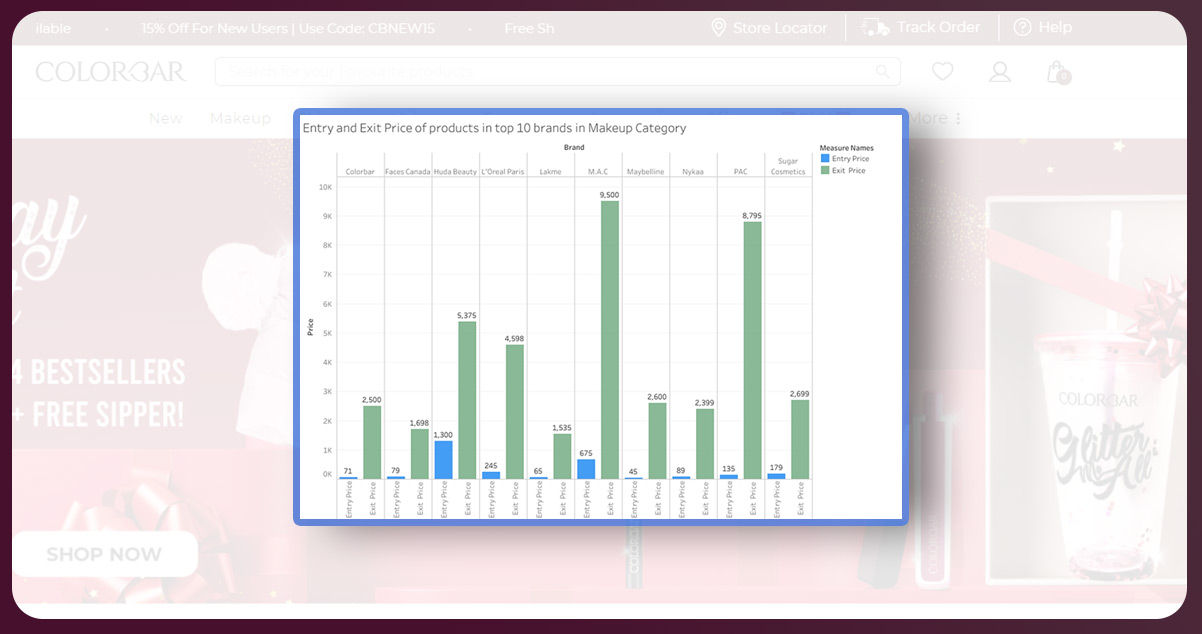
Colorbar
Entry Point: 65
Exit point: 2200
Faces Canada
Entry Point: 70
Exit Point: 1500
Huda Beauty
Entry Point: 1100
Exit Point: 4450
Loreal Paris
Entry Point: 230
Exit price: 3350
Lakme
Entry price: 60
Exit Price: 1200
MAC
Entry Price: 500
Exit Price: 8500
Maybelline
Entry Price: 40
Exit Price: 2000
Nykaa
Entry Price: 80
Exit Price: 2300
PAC
Entry Price: 125
Exit Price: 7795
Sugar Cosmetics
Entry Price: 169
Exit Price: 2199
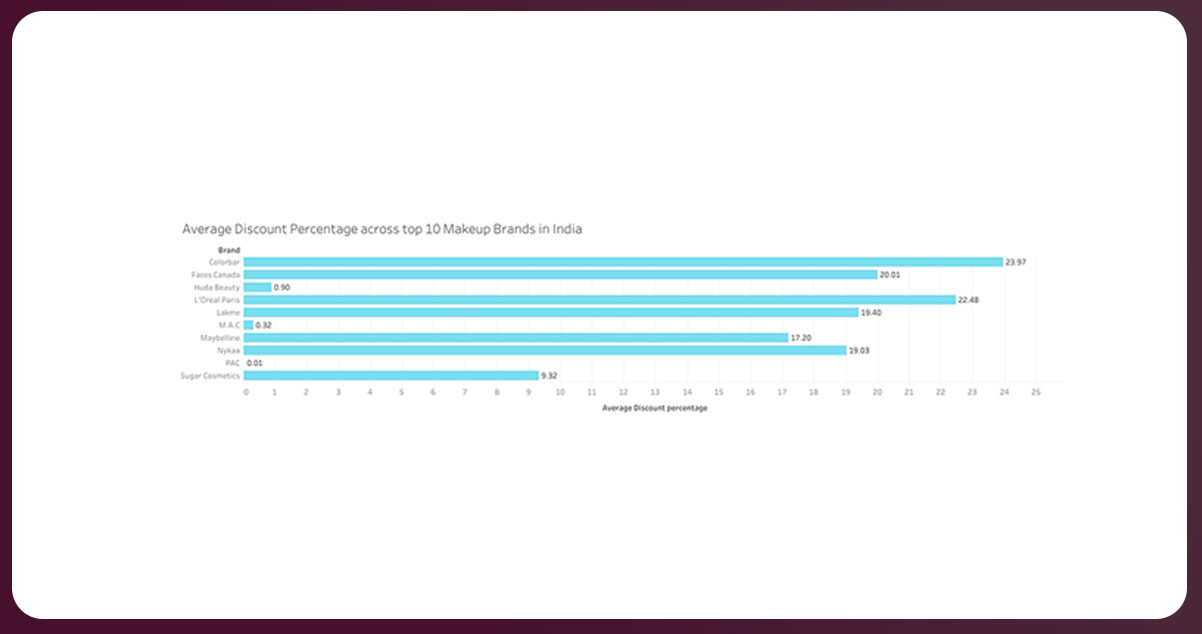
The average discount percentage is a pivotal metric in understanding a brand's pricing strategy, balancing incentivizing customers and maintaining brand value. It is a crucial indicator, offering insights into how brands approach discounts and how these strategies impact consumer behavior.
Significance of Average Discount Percentage:
Incentivizing Sales: Discounts act as powerful incentives, driving customer engagement and sales. However, an excessive reliance on discounts may create an expectation that could impact regular purchasing behavior.
Comparative Analysis: The average discount percentage becomes a benchmark for comparative analysis across different beauty brands. It allows for understanding how brands position themselves regarding pricing and the magnitude of discounts they offer.
Colorbar's Generosity: Scrape Colorbar product data to know how it leads the pack with the highest average discount percentage at 21.9%, showcasing a brand that actively uses discount strategies to attract and retain customers.
L'Oreal Paris in the Mix: Scrape L'Oreal Paris product data to understand how it closely follows with an average discount percentage of 20.38%, reflecting a competitive approach in the market.
PAC's Minimalist Approach: In contrast, scrape PAC product data to adopt a more conservative stance, offering the lowest average discount percentage at 0.01%, emphasizing a strategic approach to discounting.
Visualizing Discount Strategies:
Explore the interactive visualization below to understand the average discount percentages offered across products within the top 10 makeup brands.
Colorbar: 21.9%
Faces Canada: 19%
Huda Beauty0.50
Loreal paris: 20.38
Lakme: 20.01
MAC: 0.22
Maybelline: 11.20
Nykaa: 18.07
PAC: 0.01
Sugar Cosmetics: 8.44
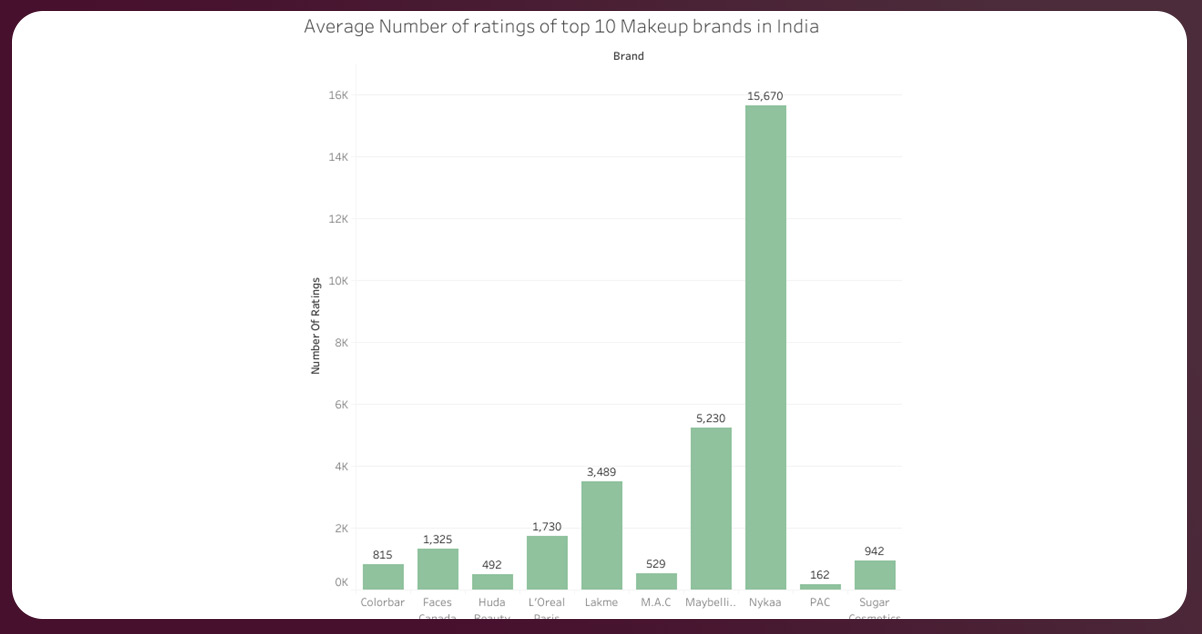
In the beauty industry, a brand's total number of ratings is a critical metric, serving as a barometer for both current performance and future potential. Ratings contribute significantly to the customer journey, influencing purchasing decisions and building trust in the quality and efficacy of beauty products.
Customer Confidence Boost: Positive ratings instill confidence in customers, assuring them of the product's quality and effectiveness. A higher number of ratings indicates widespread satisfaction among users.
Decision-Making Facilitator: Ratings play a crucial role in helping customers navigate many beauty products. A robust number of ratings aids customers in making informed choices when faced with numerous options.
Nykaa's Rating Dominance: Nykaa emerges as the leader, boasting the highest customer ratings at an impressive 12,670. This abundance of feedback signals a strong customer endorsement and confidence in Nykaa's products.
Maybelline and Lakme in the Mix: Maybelline follows suit with a substantial 3130 ratings, while Lakme secures the third position with 3,999 ratings, showcasing significant customer engagement.
PAC's Ratings Perspective: PAC, on the other hand, holds the lowest number of ratings at 152, indicating a different strategy or a potential area for brand growth.
Visualizing Customer Engagement:
Explore the interactive visualization below to gain insights into the average number of ratings across products within the top 10 makeup brands.
Colorbar: 790
Faces Canada: 1225
Huda Beauty: 480
Loreal Paris: 1500
Lakme: 3999
MAC: 428
Maybelline: 3130
Nykaa: 12670
PAC: 152
Sugar Cosmetics: 900
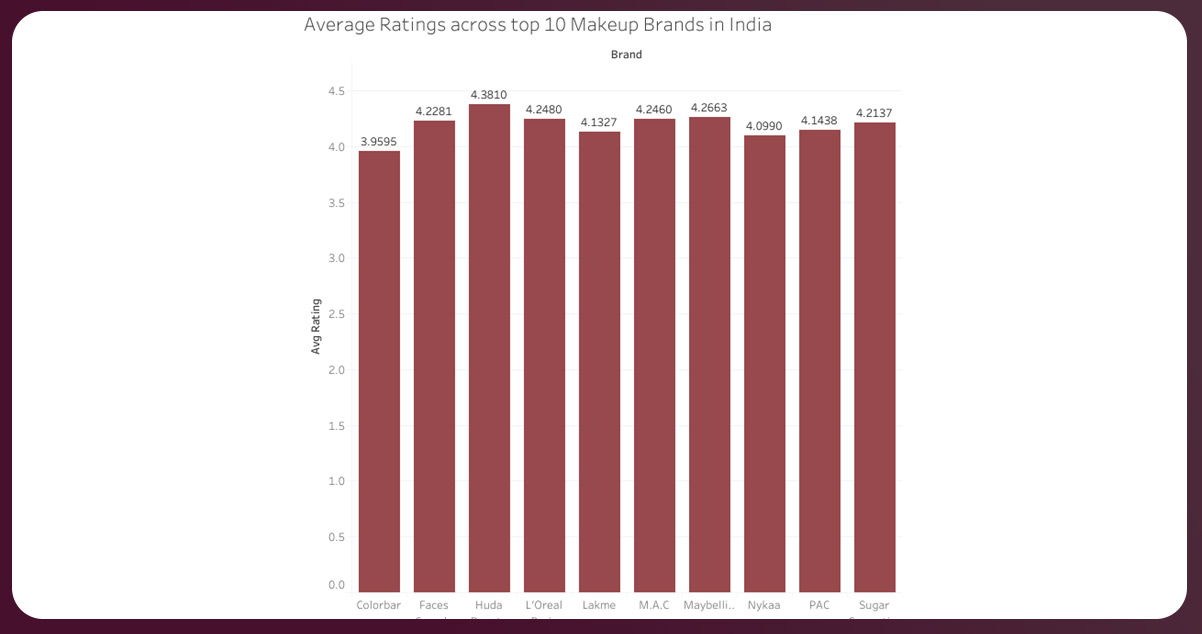
In the beauty industry, the average rating across a brand serves as a pivotal metric, offering customers valuable insights into the overall satisfaction and performance of a brand's product lineup. This metric aids customers in making informed decisions when exploring a brand, especially when trying new products without specific ones in mind.
In the beauty industry, the average rating across a brand serves as a pivotal metric, offering customers valuable insights into the overall satisfaction and performance of a brand's product lineup. This metric aids customers in making informed decisions when exploring a brand, especially when trying new products without specific ones in mind.
Consumer Guidance: The aggregate rating provides a collective measure of customer satisfaction, guiding potential buyers in choosing products from a specific brand.
Internal Performance Insights: For beauty brands, understanding the average ratings across their product range helps identify trends and areas for improvement, fostering continual enhancement of products to align with customer preferences.
Huda Beauty's Pinnacle: It emerges with the highest average rating of 4.4, signifying intense customer satisfaction and endorsement across its product range.
Diverse Averages: Colorbar holds the lowest average rating at 4, underlining variations in customer perceptions. Meanwhile, four brands—L'Oreal Paris, MAC, Faces, and Sugar Cosmetics—share a common average rating of 4.2, indicating consistent customer satisfaction across these diverse brands.
Visualizing Brand Satisfaction:
Explore the interactive visualization below to gain insights into the average ratings across products within the top 10 makeup brands.
Colorbar: 1.8865
Faces Canada: 3.3334
Huda Beauty: 4.2810
Loreal Paris: 4.1333
Lakme:3.8700
MAC: 4.0004
Maybelline: 4.0312
Nykaa: 3.9990
PAC: 4.0870
Sugar Cosmetics: 4.3500
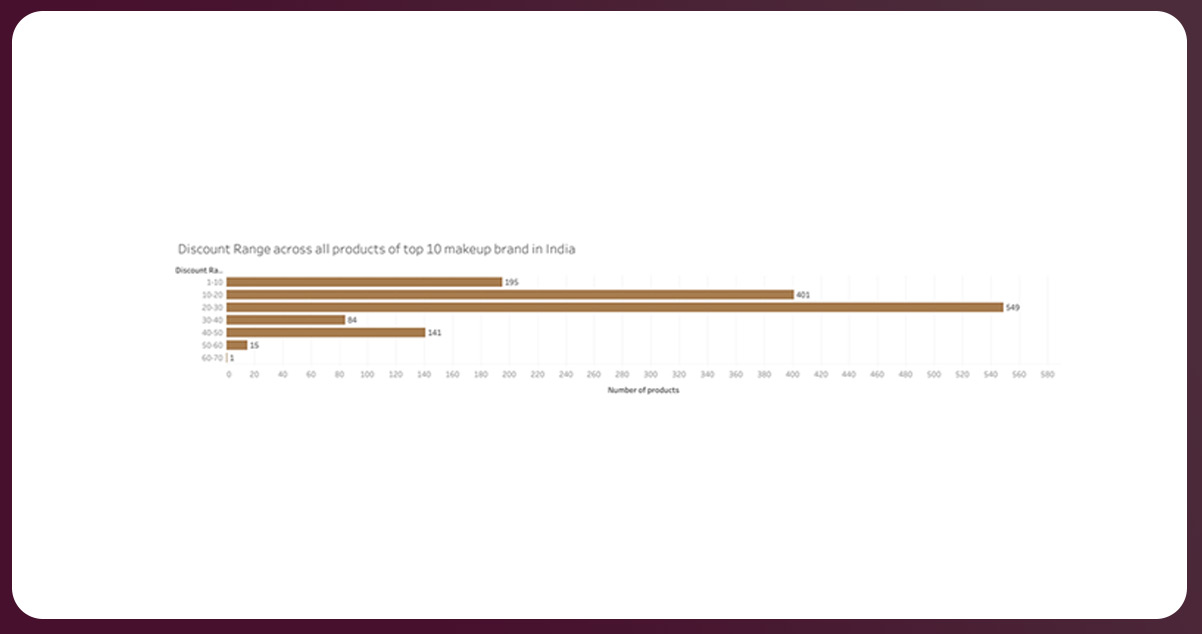
The discount range across products is a crucial metric, indicating the variation in discounts a brand offers on its diverse product portfolio. Understanding this range is pivotal for beauty brands, as it can impact consumer perceptions and influence purchasing decisions.
Significance of Discount Ranges:
Pricing Strategy Insights: The discount range reflects a brand's approach to pricing, showcasing whether higher-priced items receive more significant discounts or if discounts are available across the product range.
Consumer Perception Impact: Discounts play a role in shaping how consumers perceive a brand. Striking the right balance in discount ranges is essential to avoid negative consumer perceptions.
Consumer Survey Insights:
In our consumer survey, we discovered that discounts of up to 30% generally positively impact consumer perceptions. However, discounts exceeding 30% can lead to negative perceptions.
No-Discount Dominance: Among the 2527 products analyzed, 45% (1141 products) had no discount, indicating a prevalent strategy of maintaining regular prices for a significant portion of the product range.
Sweet Spot at 20-30%: The most common discount range falls between 20-30%, encompassing 21% of all products (549). This range aligns with consumer preferences and tends to impact perceptions positively.
Varied Discount Strategies: While 15% of products (401) fall in the 10-20% discount range, only one product achieved the maximum range of 60-70%. This diversity underscores different discounting strategies employed by the top 10 makeup brands.
Visualizing Discount Diversity:
Explore the interactive visualization below to gain insights into the discount ranges within the product offerings of the top 10 makeup brands.
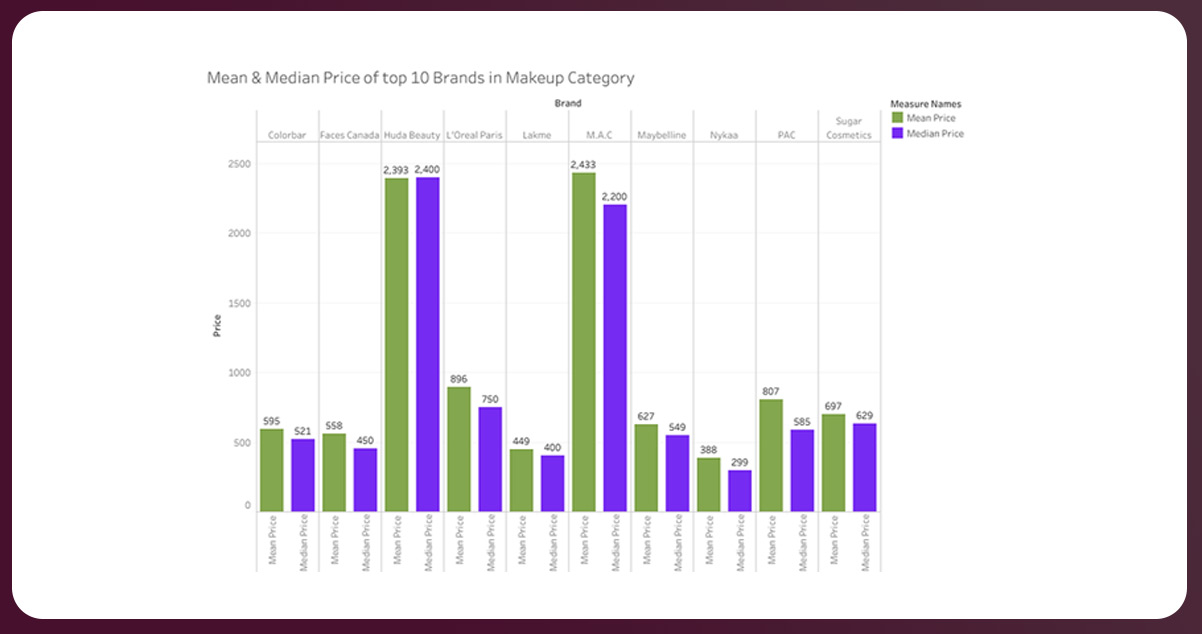
Understanding the mean and median prices within beauty brands provides nuanced insights into the pricing dynamics, offering distinct perspectives on the average and middle-most price points within a product range.
Mean Price: The mean represents the average price of all products, indicating a brand's most common price value. It offers a comprehensive view of the overall pricing trend.
Median Price: The median is the middle-most price, especially useful for brands with a broad range of product prices. It provides insights into whether product pricing leans towards the higher or lower end.
Huda Beauty's Premium Mean: Huda Beauty leads with the highest mean price of Rs 1393, reflecting a premium pricing strategy. It signifies that the average price of Huda Beauty products is higher than other brands.
MAC's Comparable Mean: MAC closely follows with a mean price of Rs 1432, reinforcing a competitive positioning in the premium segment.
Nykaa's Budget-Friendly Mean: In contrast, Nykaa stands out with the lowest mean price at Rs 287, indicating a budget-friendly approach that appeals to a broader customer base.
Median Price Insights: Huda Beauty maintains the highest median price at Rs 2900, emphasizing consistency in higher-end pricing. Nykaa's lowest median price, Rs 300, showcases affordability across its product range.
Visualizing Pricing Perspectives:
Explore the interactive visualization below to gain insights into the mean and median prices across products within the top 10 makeup brands.
Price: 0, 1000, 1500, 2000, 2500, 3000 Color Bar: Mean price: 488 ‘Median: 400 Faces Canada: Mean: 500 Median: 420 Huda Beauty Mean: 1393 Mean: 2900 Loreal Paris Mean: 888 Meadian: 650 Lakme Mean: 400 Median: 380 MAC Mean: 1432 Medain: 1200 Maybelline Mean: 600 Median: 540 Nykaa Mean: 287 Median: 300 PAC Mean: 800 Median: 565 Sugar Cosmetics Mean: 688 Median: 675Conclusion: This blog aims to provide readers with a comprehensive insight into the dynamic landscape of the Indian makeup industry. By delving into historical trends and future projections, brands can gain valuable foresight to shape their goals and strategically focus on key growth factors in this rapidly expanding market.
The Indian makeup industry is a thriving multi-billion dollar sector, witnessing annual waves of new product launches. We intend to offer a nuanced understanding of the industry's intricacies, shedding light on the demand for specific makeup products and providing actionable insights for retailers seeking a competitive edge. Through meticulous data analysis, we aspire to deliver pertinent results and insights that can serve as a valuable guide for retailers across India, enabling them to navigate and capitalize on the evolving trends within the makeup industry.
Feel free to reach out to iWeb Data Scraping for all-encompassing data solutions! Whether you require web scraping service or mobile app data scraping, our team is ready to help. Contact us today to discuss your needs and discover how our customized data scraping solutions can provide efficiency and reliability tailored to your unique requirements.