Extract Grocery Price Data from US Stores to Analyze Competitive Pricing Trends

Extract-Grocery-Price-Data-from-US-Stores-to-Analyze-Competitive-Pricing-Trends_Mesa de trabajo 1

Introduction

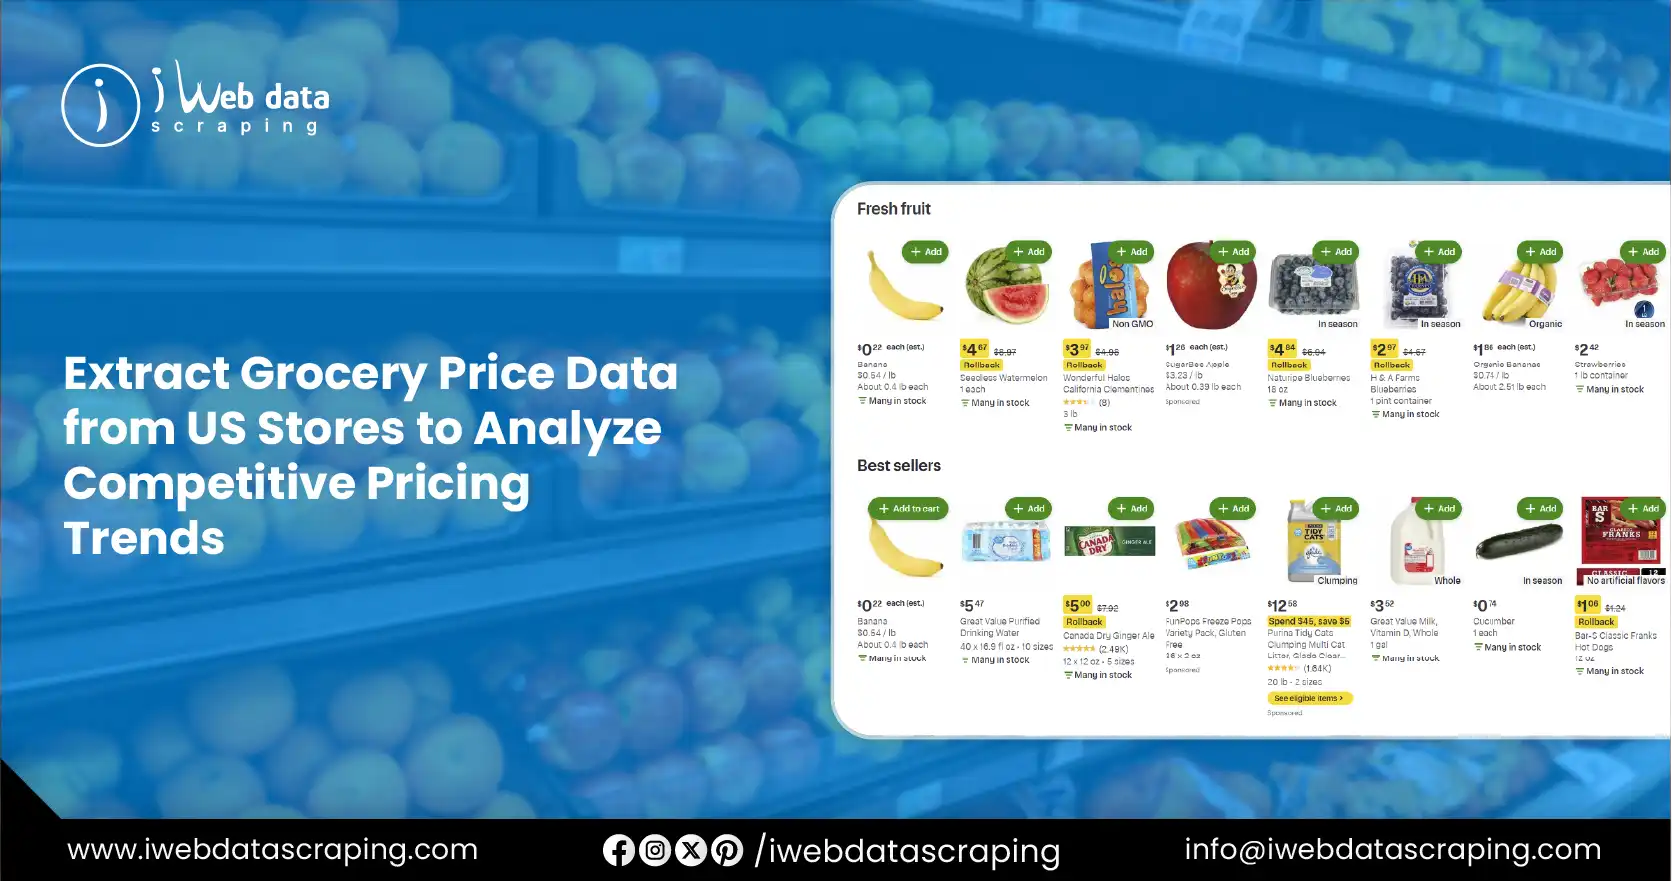
San Francisco’s grocery retail sector, known for its economic and cultural diversity, offers a vibrant setting to analyze consumer price trends amid rising food costs and growing online grocery demand. This report utilizes advanced US Grocery Store Price Data Scraper techniques to extract comprehensive grocery price data from leading San Francisco retailers in 2025. By targeting key product categories across prominent stores such as Safeway, Whole Foods Market, and Trader Joe’s, the study aims to reveal pricing patterns and evolving market dynamics. The data was gathered by employing methods to Extract Grocery Price Data from US Store websites, ensuring accuracy and breadth of coverage. This approach provides valuable insights for retailers to adjust pricing strategies, policymakers to understand affordability issues, and consumers to make informed purchasing decisions. The report delivers an in-depth overview of San Francisco’s grocery pricing landscape through precise and systematic data extraction.

Methodologies

Methodologies

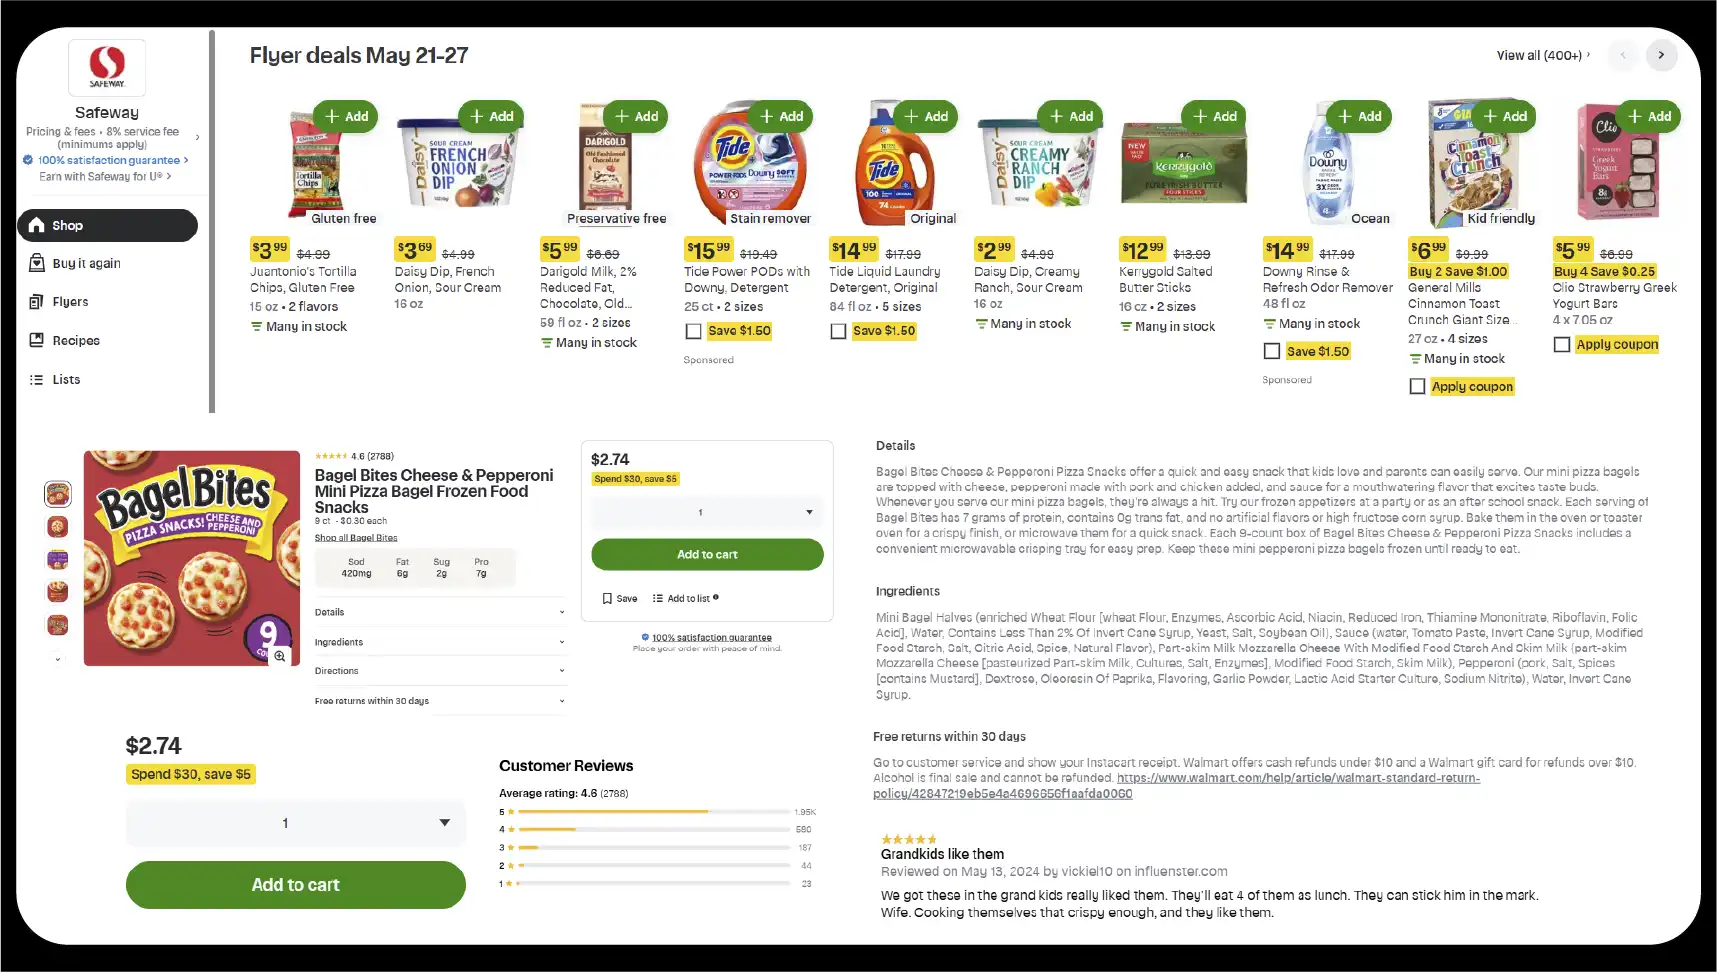
Price data was collected from the online platforms of Safeway, Whole Foods Market, and Trader Joe’s, which are among the most prominent grocery retailers in San Francisco. The dataset includes prices for 50 staple grocery items across five categories: dairy, produce, meat, bakery, and pantry staples. Data was scraped daily from January 1, 2025, to March 31, 2025, to capture short-term price fluctuations and promotional trends. This effort represents a comprehensive attempt to Scrape Retail Grocery Prices in the USA for detailed market insights. The analysis focuses on average prices, price ranges, and promotional discounts, with comparisons across retailers to identify competitive pricing strategies. Leveraging US Grocery Store Price Scraping Services, the data was cleaned and structured using Python libraries, ensuring accuracy and consistency for analysis. Overall, this dataset supports robust Grocery Price Comparison Data Scraping USA to understand price dynamics in the grocery sector better.

Key Findings

Key-Findings-01
  • Price Variation Across Retailers: Safeway offered the lowest average prices for dairy ($4.29 for 1 gallon of milk) and pantry staples ($1.99 for 1 lb of white rice), while Whole Foods Market had the highest prices, particularly for organic produce ($6.49 for 1 lb of organic spinach) and meat ($9.29 for 1 lb of ground beef). Trader Joe’s consistently provided competitive pricing, undercutting Safeway by 5-10% on produce and bakery items and offering the lowest price for organic dairy ($3.99 for 1 gallon of organic milk). These insights were derived from analyzing the US Grocery Product Dataset collected through extensive web scraping techniques.
  • Promotional Activity: Safeway exhibited the highest frequency of promotional discounts, with 35% of dairy and 30% of meat products on sale weekly, often reducing prices by 15-25%. Whole Foods Market had fewer promotions (15% for dairy, 10% for meat), focusing on organic and specialty items, with discounts rarely exceeding 10%. Trader Joe’s maintained stable pricing, with only 10% of dairy and 5% of meat items on sale, emphasizing consistent value over promotional spikes. This pattern was observed using Web Scraping Grocery App Data methods to capture real-time promotional pricing.
  • Price Stability: Pantry staples showed the least volatility, with standard deviations below 5% across all retailers (e.g., white rice prices varied by ±$0.10). Produce and meat prices fluctuated significantly, with weekly variations of up to 15% for apples and 12% for chicken breast, driven by seasonal supply changes and promotional cycles. For example, apple prices peaked at $3.29 at Safeway in mid-February 2025 due to reduced orchard supply. Such fluctuations highlight the value of Web Scraping Quick Commerce Data for monitoring fast-changing grocery prices.
  • Organic Premium: Organic products commanded a 20-40% price premium across retailers, with Whole Foods Market showing the highest markup (45% for organic produce, e.g., $6.49 vs. $4.49 for non-organic spinach). Trader Joe’s offered the most affordable organic options, with organic dairy and produce prices 10-15% lower than Whole Foods (e.g., $4.29 for organic spinach). Organic meat at Whole Foods averaged a 35% premium over conventional options. This data was compiled as part of ongoing Grocery Data Scraping Services to understand organic market pricing trends better better.
  • Inflation Trends: Grocery prices in San Francisco increased by 2.8% from January to March 2025, slightly above the national food-at-home inflation rate of 2.7% (Economic Research Service, 2025). Meat prices rose by 3.5% (e.g., ground beef at Safeway increased from $7.29 to $7.54), and dairy prices rose by 3.2% (e.g., milk at Whole Foods increased from $5.39 to $5.56), driven by rising production and transportation costs. These trends were tracked using robust Grocery and Supermarket Store Datasets compiled for regional pricing intelligence.
  • Category-Specific Trends: Bakery items showed moderate price increases (2.1% on average), with Safeway’s white bread loaf rising from $2.69 to $2.79. Produce prices were influenced by local sourcing, with Trader Joe’s offering California-grown apples at $2.29, 8% cheaper than Safeway’s $2.49. Dairy products at Trader Joe’s remained the most stable, with only a 1.8% increase over the study period. These observations form the basis of the broader Grocery Pricing Data Intelligence used to inform competitive market strategies.
  • Regional Price Differences: Prices in San Francisco were 10-15% higher than national averages for similar items, based on USDA retail price data for 2025. For instance, 1 lb of chicken breast averaged $6.49 nationally but $6.99 at Safeway and $8.99 at Whole Foods in San Francisco, reflecting the city’s high cost of living and logistics costs. These regional discrepancies highlight the importance of localized Grocery Data Scraping Services to capture nuanced pricing dynamics.

Table 1: Average Prices for Key Grocery Items (January-March 2025)

Category Item Safeway ($/unit) Whole Foods ($/unit) Trader Joe’s ($/unit)
Dairy 1 Gallon Milk $4.29 $5.49 $3.99
Dairy 16 oz Cheddar Cheese $5.99 $7.29 $5.49
Produce 1 lb Apples $2.49 $3.99 $2.29
Produce 1 lb Organic Spinach $4.99 $6.49 $4.29
Meat 1 lb Chicken Breast $6.99 $8.99 $6.49
Meat 1 lb Ground Beef $7.49 $9.29 $6.99
Bakery White Bread Loaf $2.79 $3.99 $2.49
Pantry Staples 1 lb White Rice $1.99 $2.49 $1.79

Note: Prices are averages based on daily web-scraped data from January 1 to March 31, 2025.

Table 2: Promotional Discount Frequency by Category (January-March 2025)

Category Safeway (% of items on sale) Whole Foods (% of items on sale) Trader Joe’s (% of items on sale)
Dairy 35% 15% 10%
Produce 25% 20% 15%
Meat 30% 10% 5%
Bakery 20% 15% 10%
Pantry Staples 15% 10% 5%

Note: Percentages reflect the proportion of items in each category that were discounted at least once per week during the study period.

Analysis

Analysis

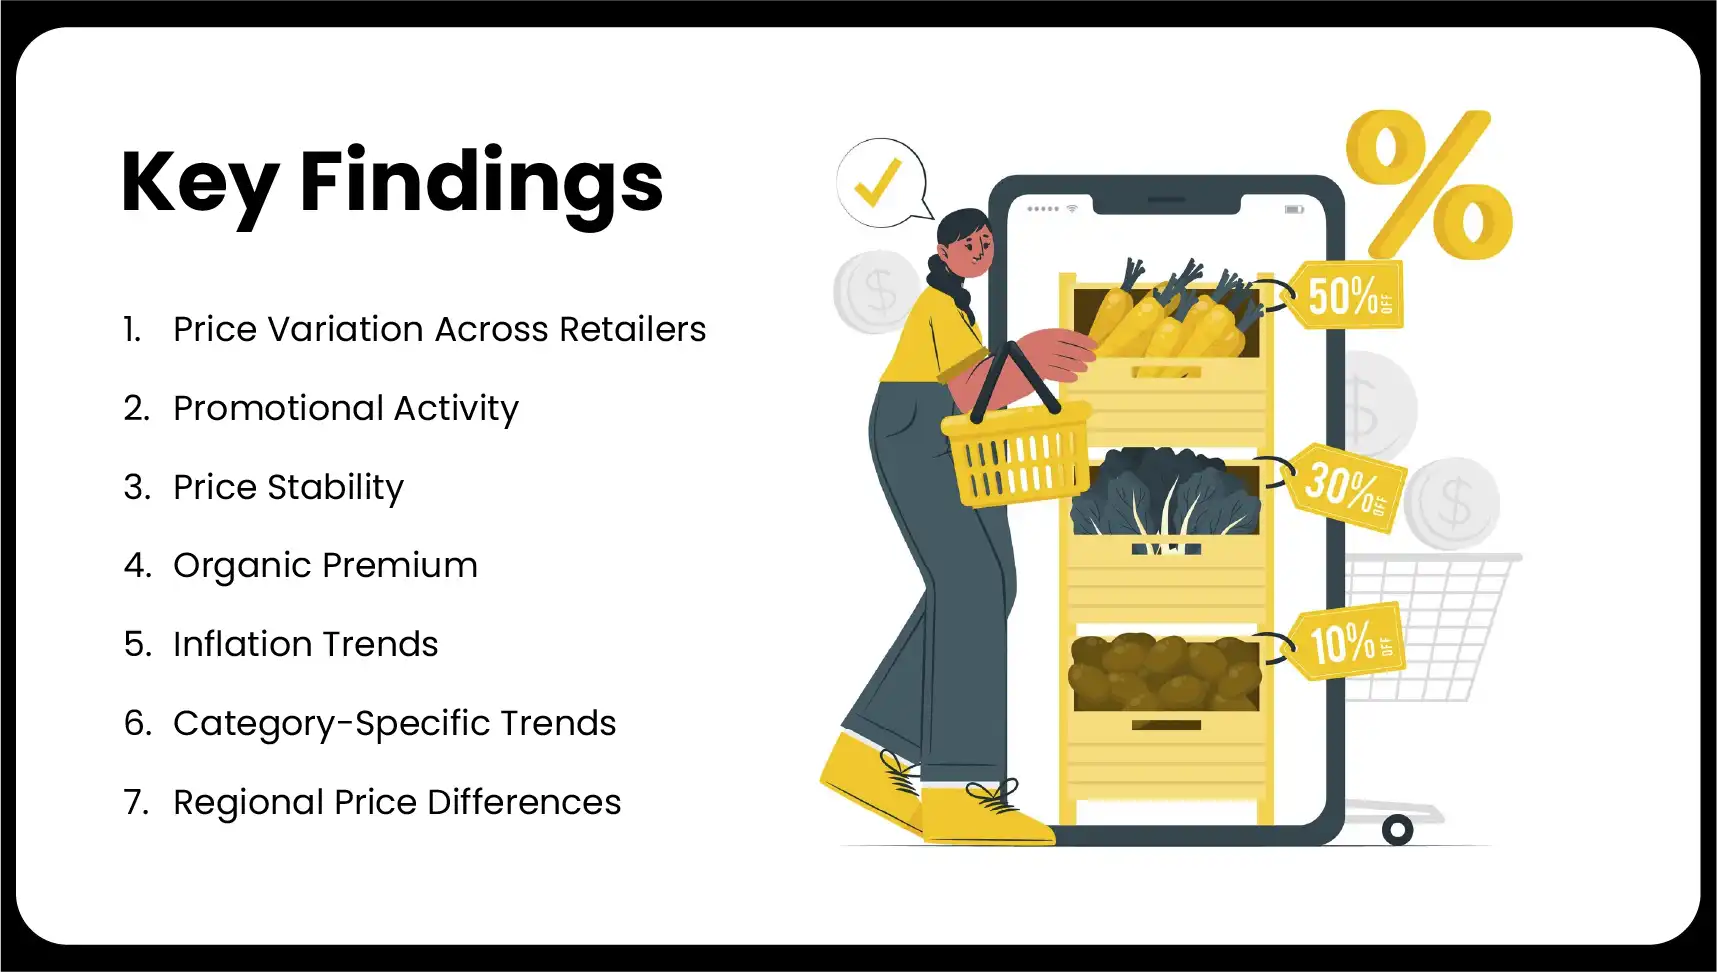
Price Competitiveness

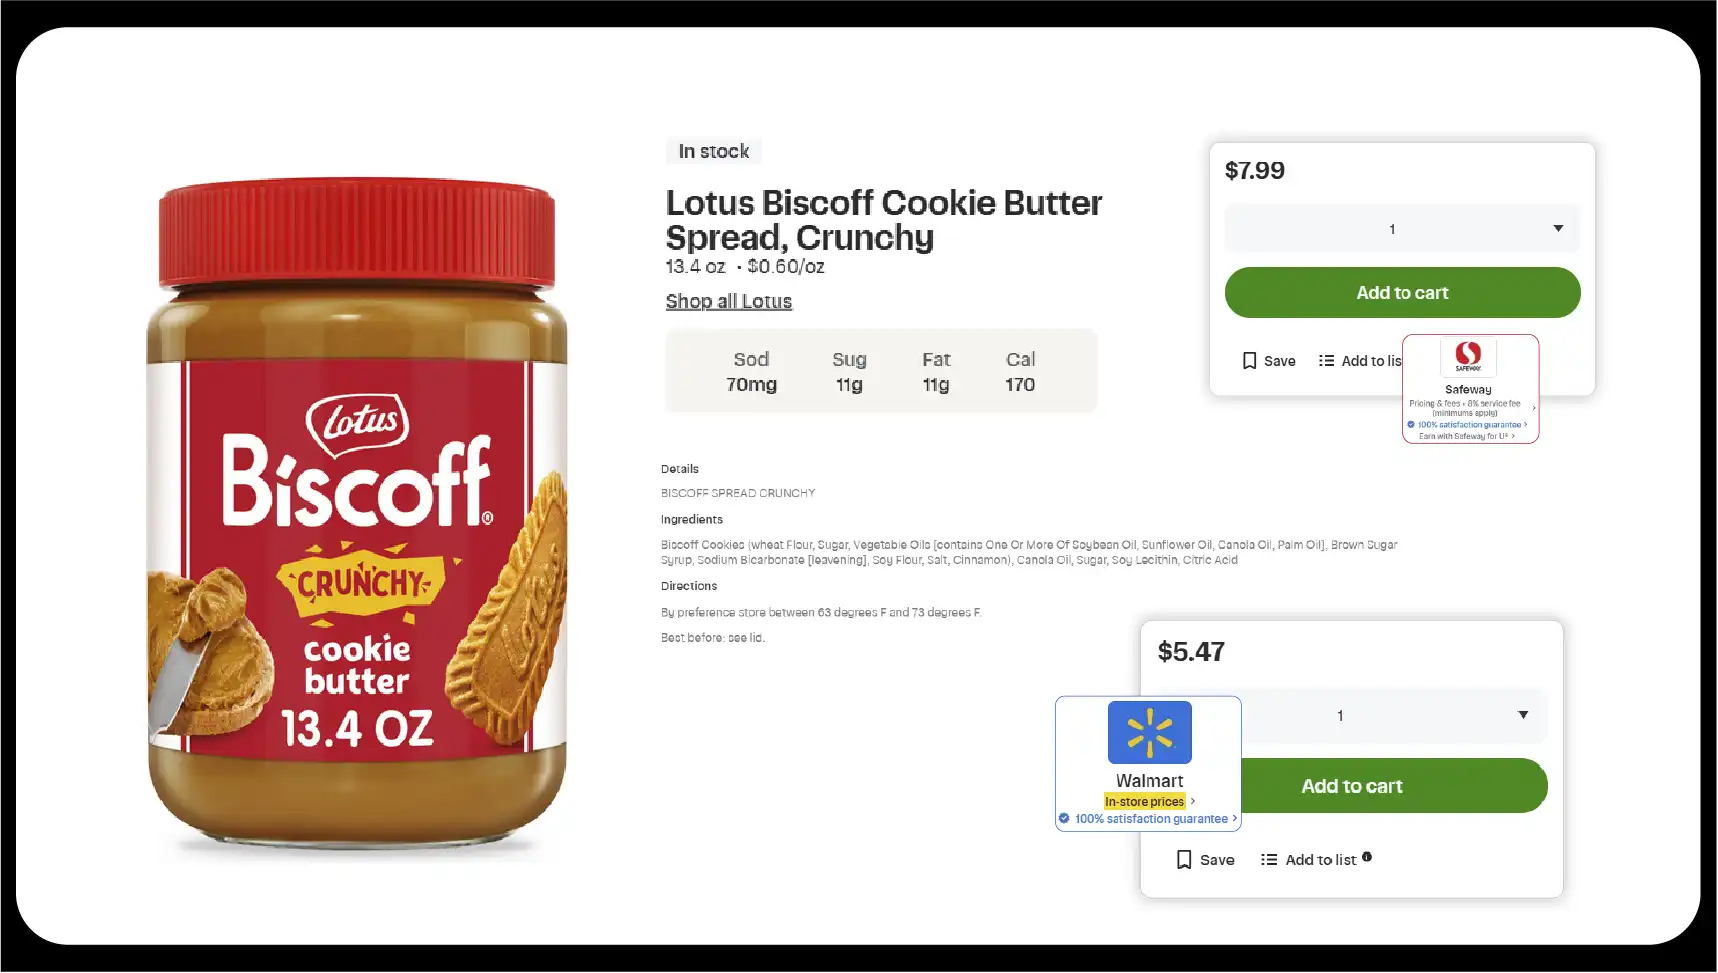
Safeway’s lower prices in dairy and pantry staples align with its mass-market appeal and frequent promotions, targeting cost-conscious consumers. Whole Foods Market’s higher prices reflect its focus on organic and premium products, catering to a niche market. Trader Joe’s balances affordability and quality, undercutting competitors on organic items and appealing to a broad demographic.

Promotional Strategies

Safeway’s high promotional frequency drives sales volume, particularly in dairy and meat. Whole Foods Market’s limited promotions focus on organic products, reinforcing brand loyalty. Trader Joe’s stable pricing fosters consumer trust by avoiding the perception of inflated regular prices.

Price Volatility

Pantry staples exhibited low volatility due to stable supply chains, while produce and meat fluctuated due to seasonal and promotional factors. Apple price spikes in February 2025 highlight supply chain vulnerabilities, while meat price increases reflect broader inflationary pressures.

Organic Market Dynamics

The organic premium underscores strong demand in San Francisco. Trader Joe’s competitive organic pricing positions it as a market leader, while Whole Foods’ higher markups cater to premium shoppers.

Inflation and Economic Context

The 2.8% price increase aligns with national trends but is elevated by San Francisco’s high cost of living. Meat and dairy drove inflation, reflecting rising production costs.

Observations from the Data

Observations-from-the-Data-01
  • Retailer Positioning: Safeway targets budget-conscious shoppers with frequent promotions, while Whole Foods caters to premium consumers. Trader Joe’s captures a broad market with competitive organic pricing, with 60% of its produce items priced below competitors’ averages.
  • Consumer Behavior Implications: Whole Foods’ 45% organic premium suggests a loyal base willing to pay for quality, while Trader Joe’s affordability (e.g., 1 lb organic spinach at $4.29 vs. $6.49 at Whole Foods) attracts younger, cost-conscious shoppers. Safeway’s 35% promotional rate in dairy likely drives impulse purchases.
  • Seasonal and Supply Influences: Produce price fluctuations (e.g., apples peaking at $3.29 in February) reflect local orchard supply constraints. Meat prices rose steadily, with chicken breast increasing by 3.7% at Safeway, highlighting supply chain and energy cost pressures.
  • Promotional Impact: Safeway’s frequent discounts (e.g., 25% off chicken breast weekly) may boost sales but risk eroding perceived value. Trader Joe’s low 5% promotional rate in meat suggests a strategy of consistent pricing, with 80% of items maintaining stable prices throughout the period.
  • Regional Cost Factors: San Francisco’s 10-15% higher prices compared to national averages (e.g., $6.99 vs. $6.49 for chicken breast) reflect urban logistics costs. Trader Joe’s mitigates this with local sourcing, offering California-grown produce at 8-12% lower prices than competitors.
  • Category-Specific Patterns: Dairy prices at Trader Joe’s showed the lowest increase (1.8%), suggesting efficient sourcing or inventory management. Bakery items at Whole Foods, such as white bread ($3.99), had a 25% premium over Trader Joe’s ($2.49), indicating a focus on artisanal offerings.

Conclusion

This web-scraped analysis of San Francisco grocery prices reveals distinct retailer strategies and market dynamics. Safeway’s promotional focus, Whole Foods’ premium positioning, and Trader Joe’s value-driven approach highlight diverse consumer options. The 2.8% price increase, organic premiums, and category-specific trends provide actionable insights for retailers, policymakers, and consumers. Future research could explore additional retailers or consumer purchasing patterns to further illuminate San Francisco’s grocery market.

Experience top-notch web scraping service and mobile app scraping solutions with iWeb Data Scraping. Our skilled team excels in extracting various data sets, including retail store locations and beyond. Connect with us today to learn how our customized services can address your unique project needs, delivering the highest efficiency and dependability for all your data requirements.

Let’s Talk About Product

What's Next?

We start by signing a Non-Disclosure Agreement (NDA) to protect your ideas.

Our team will analyze your needs to understand what you want.

You'll get a clear and detailed project outline showing how we'll work together.

We'll take care of the project, allowing you to focus on growing your business.