
The U.S. apparel sector is a battlefield shaped by shifting consumer tastes, omnichannel expansion, promotional pricing pressure, and digital marketplace disruption. In this detailed Gap vs American Eagle comparison, we analyze two legacy brands that represent sharply different strategic models in 2025.
To build this report, structured methodologies similar to Gap vs American Eagle data scraping are used to collect verified store counts across the United States. Advanced Gap Inc retail data extraction frameworks help compile pricing spreads and promotional trends across product categories. Marketplace-level product assortment and inventory depth are evaluated using systematic digital shelf tracking models. Customer review volumes and sentiment signals are analyzed independently across major e-commerce platforms to ensure accuracy and clarity.
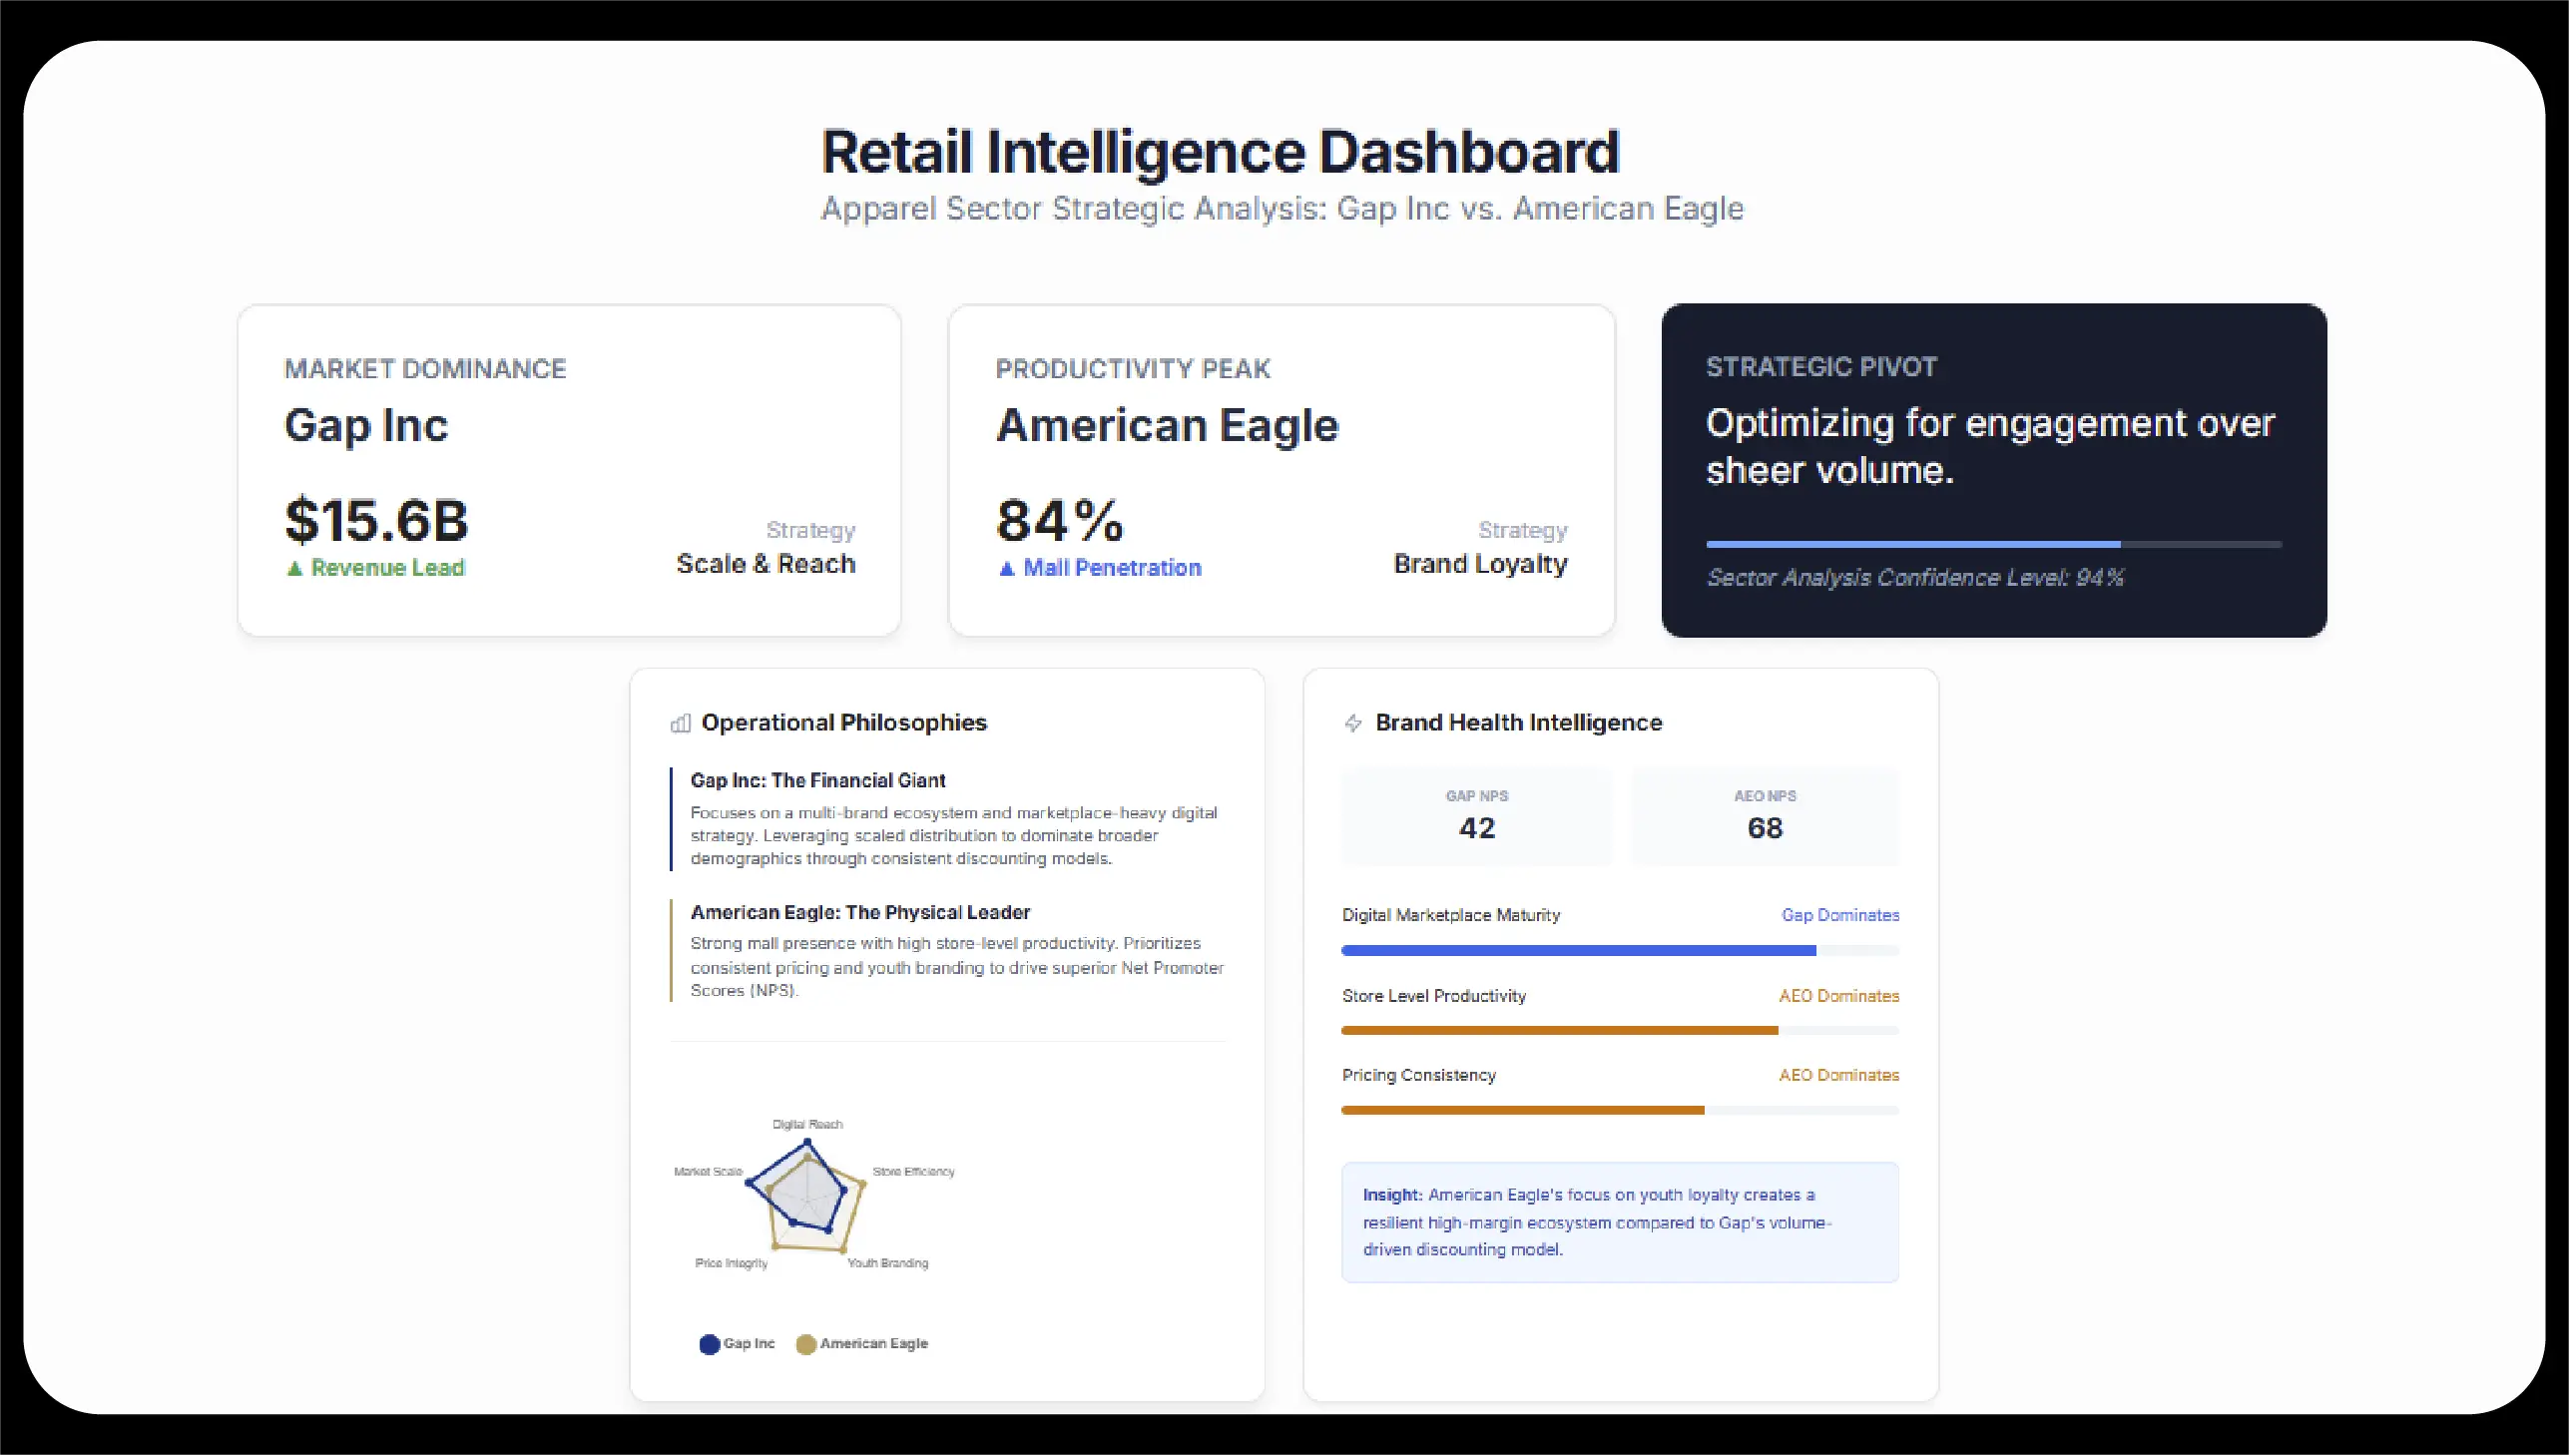
On one side stands Gap Inc.—a diversified apparel conglomerate with global distribution strength and digital marketplace saturation. On the other stands American Eagle Outfitters (AEO)—a brand deeply rooted in mall retail dominance and customer loyalty.
This is not just a revenue comparison. It’s a structural divide between scale-driven distribution and customer-driven brand affinity.
Gap Inc. operates a multi-brand portfolio including Gap, Old Navy, Banana Republic, and Athleta. American Eagle Outfitters focuses primarily on American Eagle and Aerie, with a stronger lifestyle positioning among Gen Z and Millennials.
| Metric | Gap Inc. | American Eagle Outfitters |
|---|---|---|
| Total Revenue | $15.16 Billion | $5.27 Billion |
| Gross Margin | 38.5% | 36.2% |
| Net Income | $502 Million | $235 Million |
| Market Capitalization | $8.54 Billion | $3.33 Billion |
| Digital Sales Contribution | 42% | 38% |
| International Revenue Share | 18% | 12% |
| Brand Portfolio Size | 4 Major Brands | 2 Major Brands |
| Average Store Revenue | $3.9M | $6.4M |
| Inventory Turnover Ratio | 4.2x | 4.6x |
Gap Inc. dominates in absolute scale. Revenue is nearly three times that of American Eagle. However, American Eagle generates higher average revenue per store, signaling stronger store-level productivity.
This highlights a crucial Clothing brand market performance insight: bigger networks do not automatically translate into higher unit efficiency.
When we analyze brick-and-mortar presence using models similar to American Eagle store and sales data scraping, we uncover a clear structural split.
| Region | Gap Stores | American Eagle Stores |
|---|---|---|
| Northeast | 78 | 166 |
| Midwest | 62 | 141 |
| South | 131 | 279 |
| West | 115 | 227 |
| Total U.S. Stores | 386 | 813 |
| Average Store Size | 8,200 sq ft | 6,500 sq ft |
| Mall Locations (%) | 61% | 82% |
| Outlet Locations (%) | 27% | 11% |
| Standalone Urban Stores (%) | 12% | 7% |
American Eagle has more than double the physical footprint in the U.S. Their concentration in mall environments reinforces their identity as a mall-driven lifestyle brand.
Gap, in contrast, has strategically reduced underperforming stores over the past decade while shifting focus toward outlets and digital growth.
This reflects a broader Fast fashion vs mall-based retailers contrast:
Marketplace presence tells a completely different story. Gap has aggressively expanded into third-party marketplaces, while American Eagle has maintained selective participation.
This type of structured Apparel pricing and inventory analysis reveals major digital asymmetry.
| Metric | Gap (Amazon) | American Eagle (Amazon) |
|---|---|---|
| Total Products Listed | 1,526 | 13 |
| Average Price (Men’s Denim) | $49.99 | $54.95 |
| Average Price (Women’s Tops) | $34.50 | $38.00 |
| Total Reviews (All Listings) | 310,000+ | 15,000 |
| Average Rating | 4.3 | 4.4 |
| Prime Eligible Products (%) | 82% | 61% |
| Sponsored Listings Activity | High | Minimal |
| New Product Additions (Quarterly) | 120+ | <10 |
| Metric | Gap (Walmart) | American Eagle (Walmart) |
|---|---|---|
| Total Products Listed | 1,039 | 374 |
| Total Reviews | 33,063 | 25 |
| Average Rating | 4.2 | 4.3 |
| Price Spread Range | $14.99–$79.99 | $19.99–$89.99 |
| Clearance Listings (%) | 28% | 17% |
| Third-Party Seller Participation | Moderate | Low |
| Inventory Refresh Rate | Monthly | Quarterly |
Gap floods Amazon and Walmart with inventory depth, capturing transactional search traffic at scale. American Eagle appears to prioritize its owned e-commerce channels instead.
From a Retail demand and consumer behavior data standpoint:
Using structured models similar to competitor price tracking, we can observe how Gap adjusts pricing across different product categories.
A separate analysis using e-commerce price monitoring helps track promotional campaigns and discount patterns over time.
| Category | Gap Avg Price | American Eagle Avg Price |
|---|---|---|
| Men’s Jeans | $49.99 | $59.95 |
| Women’s Jeans | $54.00 | $64.95 |
| Graphic Tees | $22.50 | $25.00 |
| Hoodies | $45.00 | $49.95 |
| Activewear | $39.00 | $44.00 |
| Seasonal Discounts (Peak) | Up to 60% | Up to 40% |
Gap runs deeper discount cycles and more aggressive clearance campaigns. American Eagle maintains stronger perceived brand value and pricing integrity.
This supports a broader Apparel retail brand comparison insight: Gap competes on accessibility and volume, while AE competes on brand loyalty and lifestyle positioning.
While Gap dominates revenue and inventory scale, American Eagle wins in advocacy.
| Brand | NPS Score |
|---|---|
| American Eagle | 44 |
| Gap Inc. | 7 |
A 37-point difference is enormous in retail. It signals:
On Amazon:
On Walmart:
This Apparel brand comparison data API-driven analysis reveals two powerful but contrasting retail philosophies.
Gap Inc – The Financial Giant
American Eagle – The Physical Leader
Through structured Fashion retail intelligence API modeling, we observe:
Future apparel competition will depend on:
Brands using a Fashion Product Data Scraping Service to monitor digital competitors can track:
Gap’s advantage lies in operational scale and distribution leverage.
American Eagle’s advantage lies in emotional connection and brand loyalty.
If macroeconomic pressures intensify, Gap’s discounting muscle may dominate.
If consumer sentiment drives purchasing decisions, American Eagle’s advocacy engine may prevail.
The divide between Gap and American Eagle is not about who is “better.” It is about two fundamentally different growth engines.
In today’s competitive landscape, brands increasingly rely on advanced tools to scrape e-commerce product data for accurate product insights. Leveraging a dedicated Amazon Search Results Scraper allows tracking of customer reviews and marketplace inventory efficiently. Using a specialized Walmart Search Results Scraper helps monitor pricing trends and assortment changes across multiple categories.
The Gap vs American Eagle divide from American Eagle store location dataset ultimately highlights a powerful retail truth:
Experience top-notch web scraping service and mobile app scraping solutions with iWeb Data Scraping. Our skilled team excels in extracting various data sets, including retail store locations and beyond. Connect with us today to learn how our customized services can address your unique project needs, delivering the highest efficiency and dependability for all your data requirements.
We start by signing a Non-Disclosure Agreement (NDA) to protect your ideas.
Our team will analyze your needs to understand what you want.
You'll get a clear and detailed project outline showing how we'll work together.
We'll take care of the project, allowing you to focus on growing your business.