Despite facing a significant revenue decline due to the pandemic, first identified in December 2019, the retail industry remains dynamic and ever-evolving. However, retail businesses must continually adapt to the latest consumer trends to maintain a competitive edge. Amidst fierce competition, gaining market share is crucial, and one effective strategy is opening new stores. Geospatial analysis plays a vital role in identifying potential locations for these new stores by providing valuable insights into the locations of competitors' stores, making it an invaluable tool in decision-making.
To address this issue, we have two options: utilizing Web Crawlers (Web Scraping) or leveraging the Google Places API. While Web Crawlers can help extract data from Google Maps, we'll opt for the second option—using the Google Places API. The API offers several advantages, including a free trial period of 90 days and user-friendliness, even for those without a programming background. With the Google Places API, we can easily retrieve the longitude and latitude of potential store locations, allowing us to overcome the limitation of the maximum number of stores shown on Google Maps and automate gathering essential data for decision-making.
Indeed, the Google Places API enables us to obtain the longitude and latitude coordinates of all the stores we are interested in. By utilizing the Folium library in Python, we can display the locations of all our competitors on an interactive map. This approach will allow us to visualize the distribution of competitor stores effectively and gain valuable insights into potential new store locations, giving us a competitive advantage in the retail market.
Folium is a versatile and powerful Python library that facilitates the creation of various types of interactive Leaflet maps. With Folium, you can effortlessly generate a base map of any desired width and height, offering the flexibility to choose from default tilesets and predefined map styles or even utilize a custom tileset URL to tailor the map according to specific preferences and requirements.
Folium's key feature in geospatial analysis is the ability to create choropleth maps, which are thematic maps used to represent statistical data visually. It is achievable through the color mapping symbology technique, wherein geospatial analysis divides geographical areas or regions, known as enumeration units, and colors, shades, or patterns based on the values of a specific data variable. By employing this technique, choropleth maps effectively convey information in geospatial analysis, allowing users to discern patterns and variations in the data across different geographic areas at a glance.
We'll use Geospatial Analysis with Google Places API and Folium in Python to access competitor store locations' coordinates to create the choropleth map. Then, we'll gather population density data for regions and prepare it for visualization. With Folium, we'll create the choropleth map based on population density. Finally, we'll mark competitor store locations on the map to identify potential new store sites in favorable areas. This comprehensive geospatial analysis process enables us to make informed decisions for retail expansion, leveraging population density and competitor analysis.
To begin, create a Gmail account. Next, visit https://cloud.google.com/ and complete the registration form, which will prompt you to provide your credit card number. You can access a $300 credit trial with your new account upon successful registration.
An API, or Application Programming Interface, consists of rules that enable an application to share its data with external developers. Put, an API allows you to integrate and utilize "their stuff" (data and functionalities) within "your stuff" (your application). This interaction occurs through the API endpoint, where the external data and services are accessible and seamlessly integrated into your application.
Here is a step-by-step guide on how to obtain the API key for Google Places API:
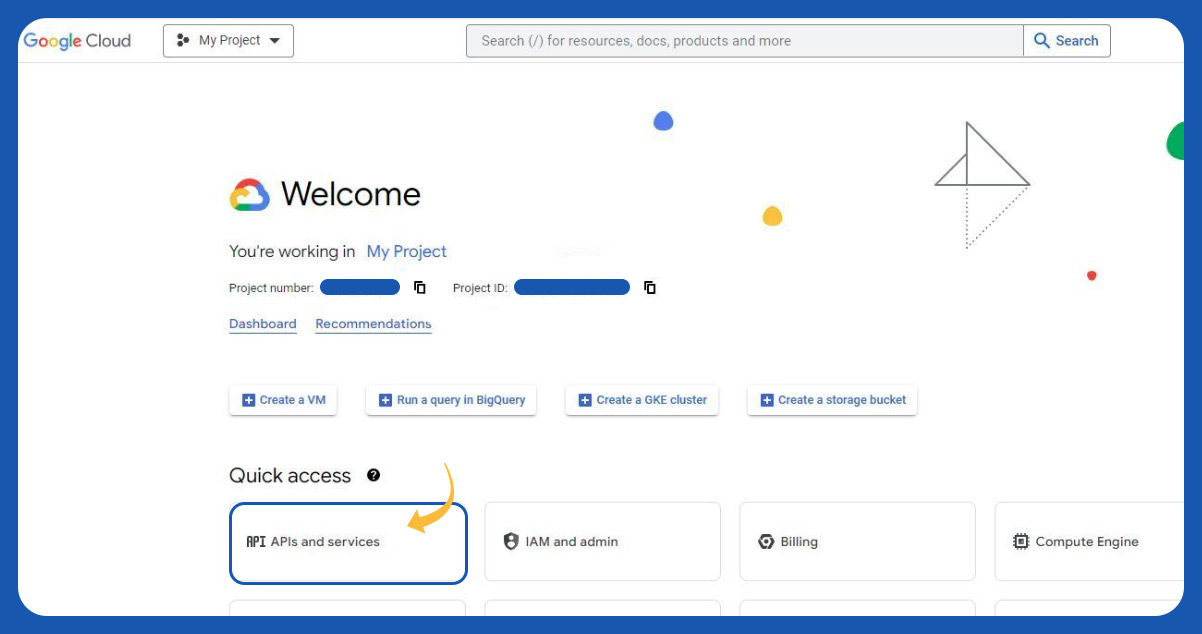
Go to the Google Cloud Console and open "API & Services."
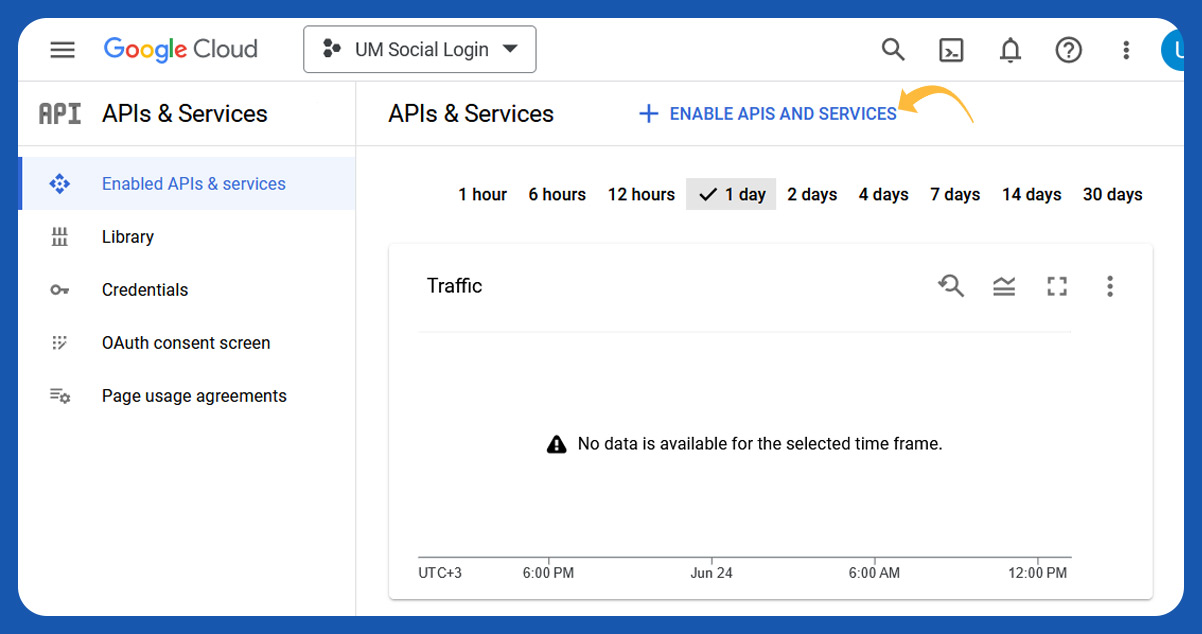
Click on "ENABLE APIS AND SERVICES."
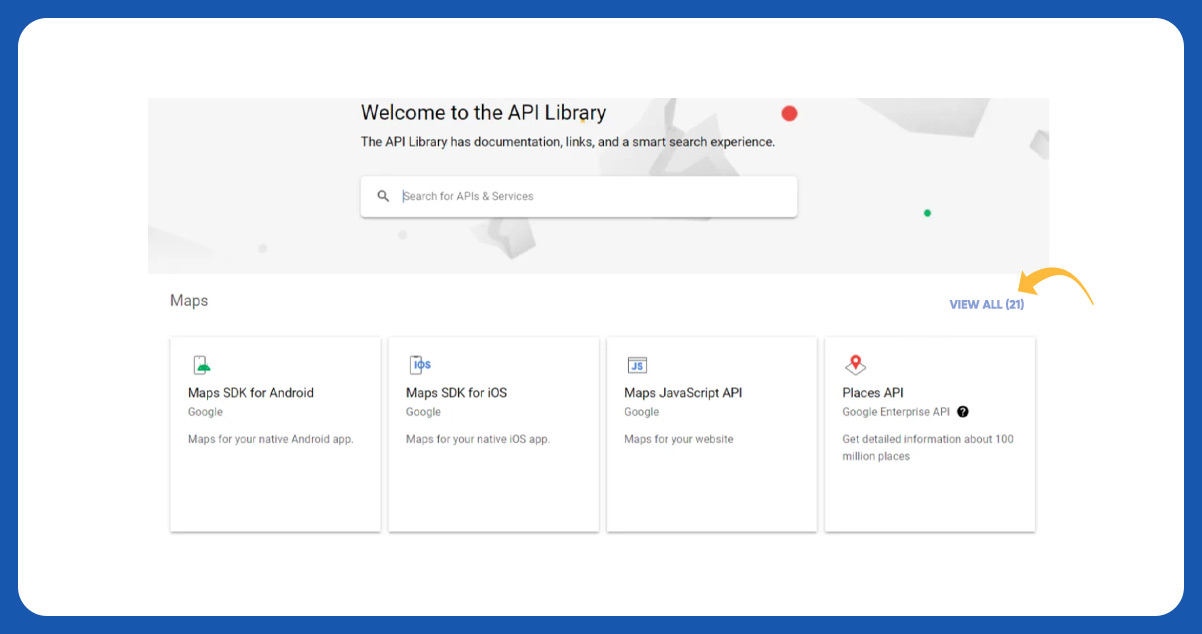
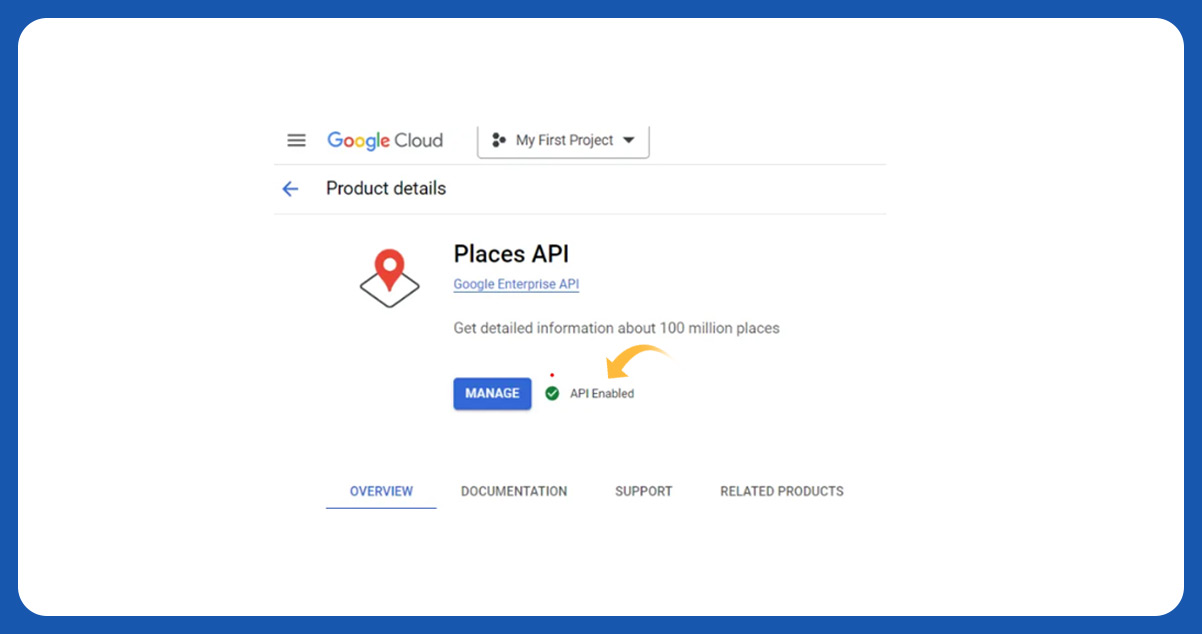
Look for "Places API" in the right corner and open it.
Click the "ENABLE" button next to the "MANAGE" button. After enabling the API, click on the 'MANAGE' button.
Select the "Keys and Credentials" menu on the left navigation bar, and then click on the 'SHOW KEY' button.
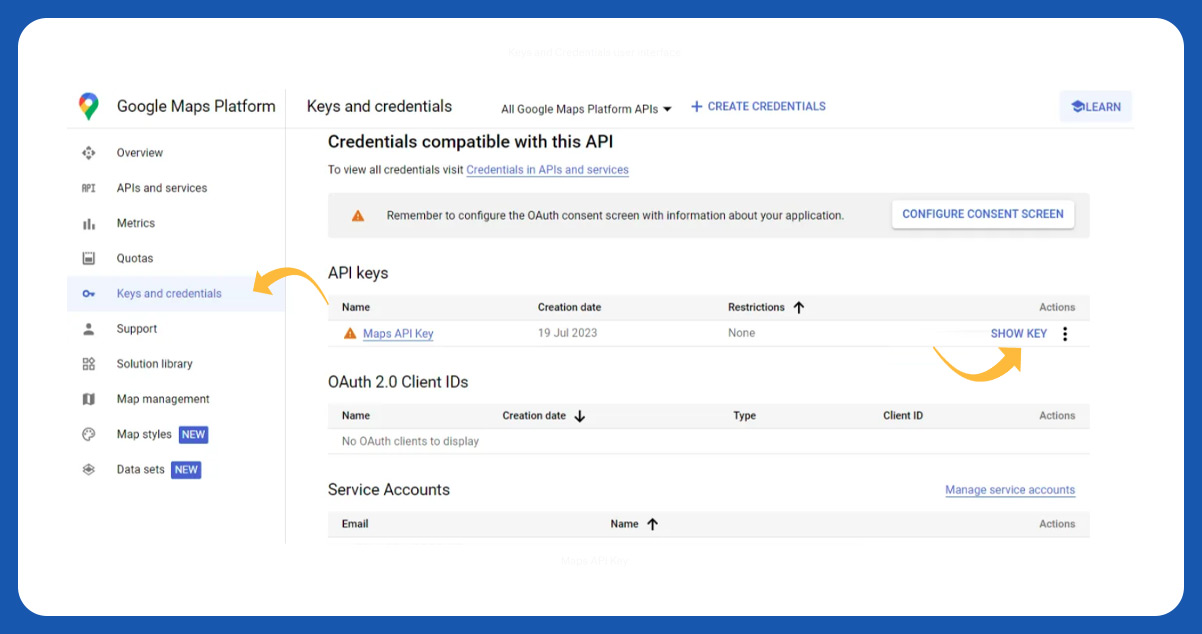
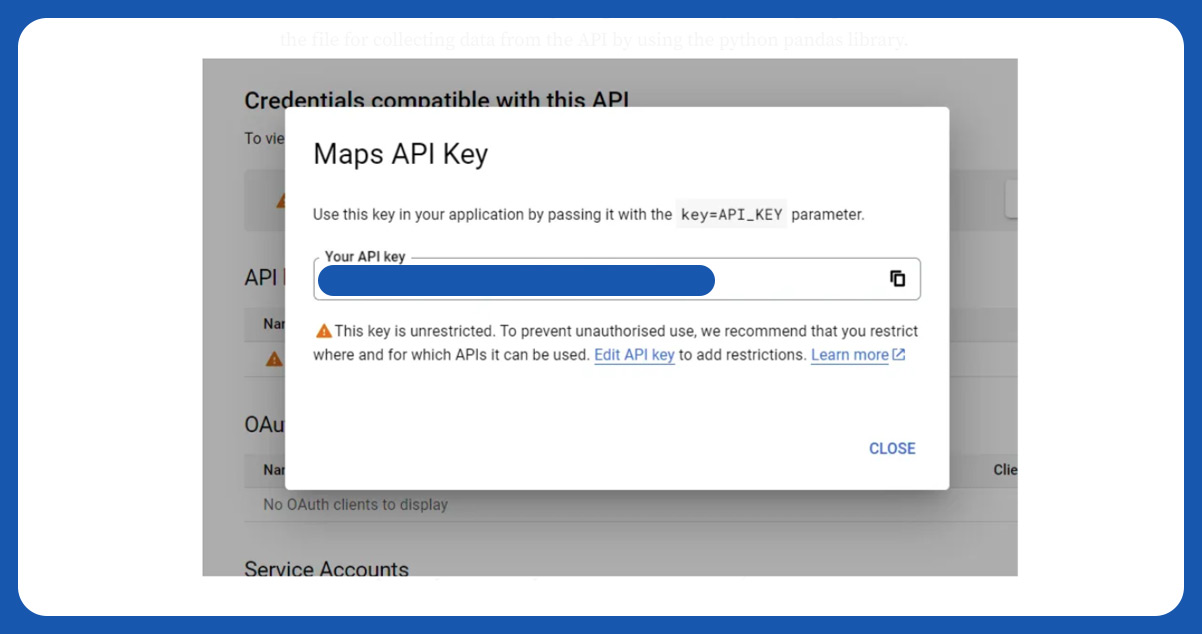
You will find your Maps API key, which is helpful in the Python script. Remember that this key is sensitive information, so keep it confidential to avoid unexpected billing fluctuations.
Python (Pandas & Folium)
We will create two files in Python: one for collecting data from the API and the other for creating the map using Folium. First, let's focus on creating the file for data collection from the API using the Python pandas library.
Google Places API Parameters:
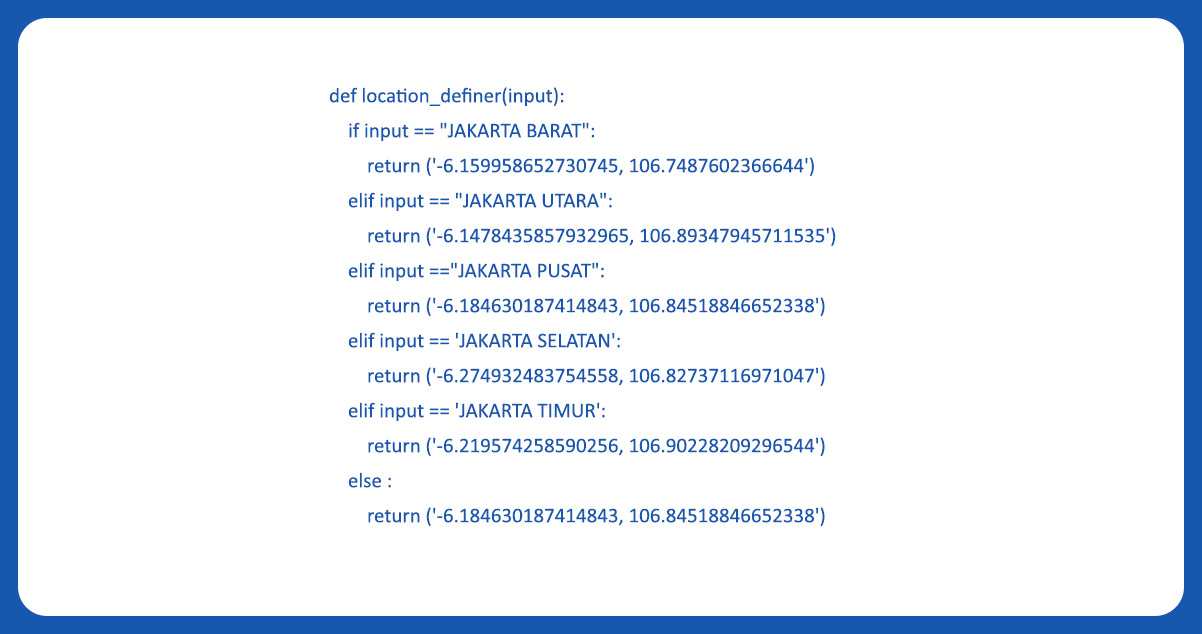
Hence, the logic is straightforward to collect all the stores' data. We will utilize a for loop for each district (kecamatan) in DKI Jakarta. The location parameter is determined based on whether the district is in North Jakarta, West Jakarta, East Jakarta, South Jakarta, or the Center of Jakarta. For the text query, we will use specific examples like
"Alfamart+KEMAYORAN" or "Indomaret+CIPAYUNG" to search for specific stores in each district. Here's a step-by-step guide on how to collect the API data:
To begin the project on DKI Jakarta, ensure you have the dataset containing all the districts in the city. Ensure that the dataset is free of duplicates for accurate analysis.
Next, create a regular Python function to determine the location's center point (latitude and longitude) based on each district. This function will play a key role in specifying the location parameter while collecting data from the Google Places API for each district. By following these steps, you will be well-prepared to proceed with data collection and analysis for the project.
We will create a list of text queries to facilitate looping during the data collection.
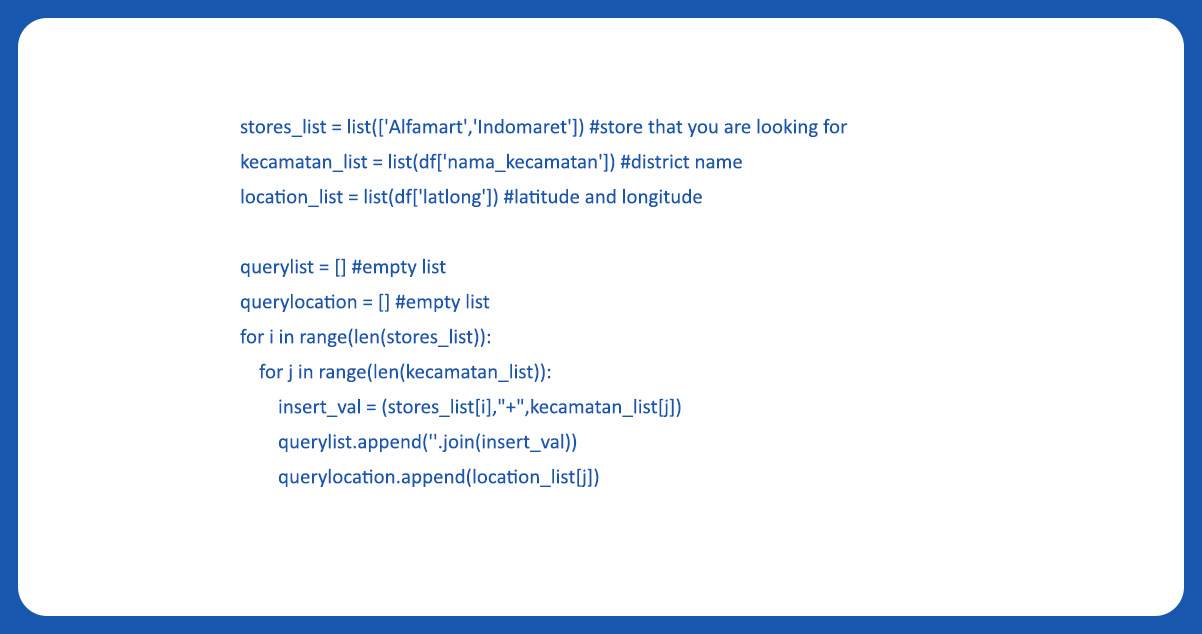

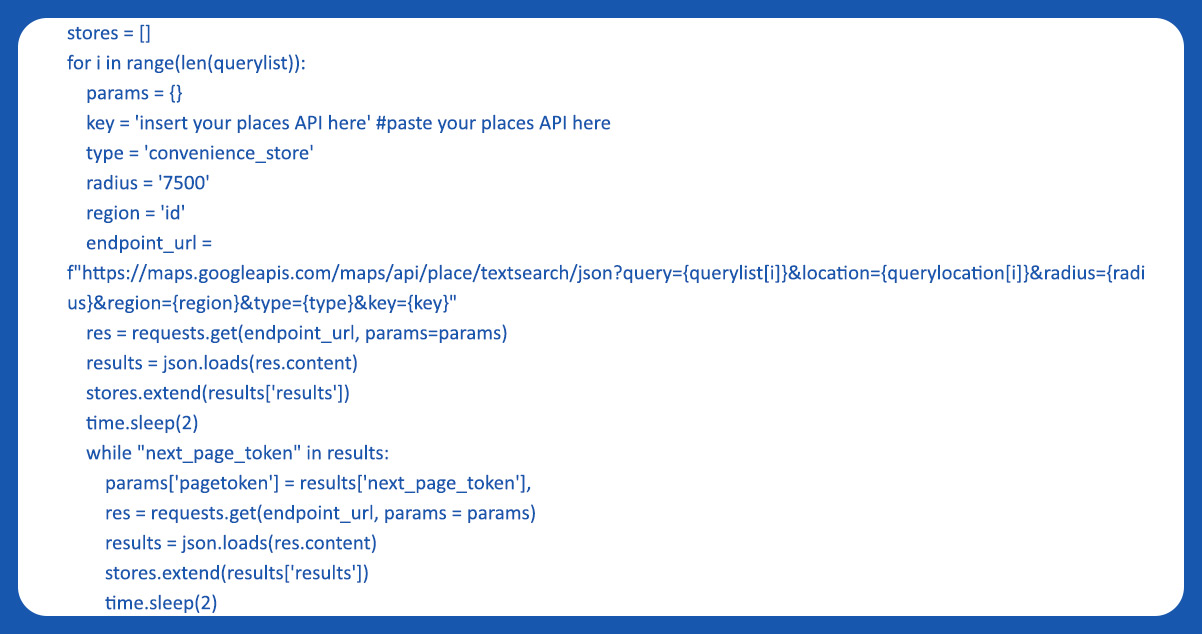
After creating both the text query list and location query, we will utilize the Google Places API for data collection.
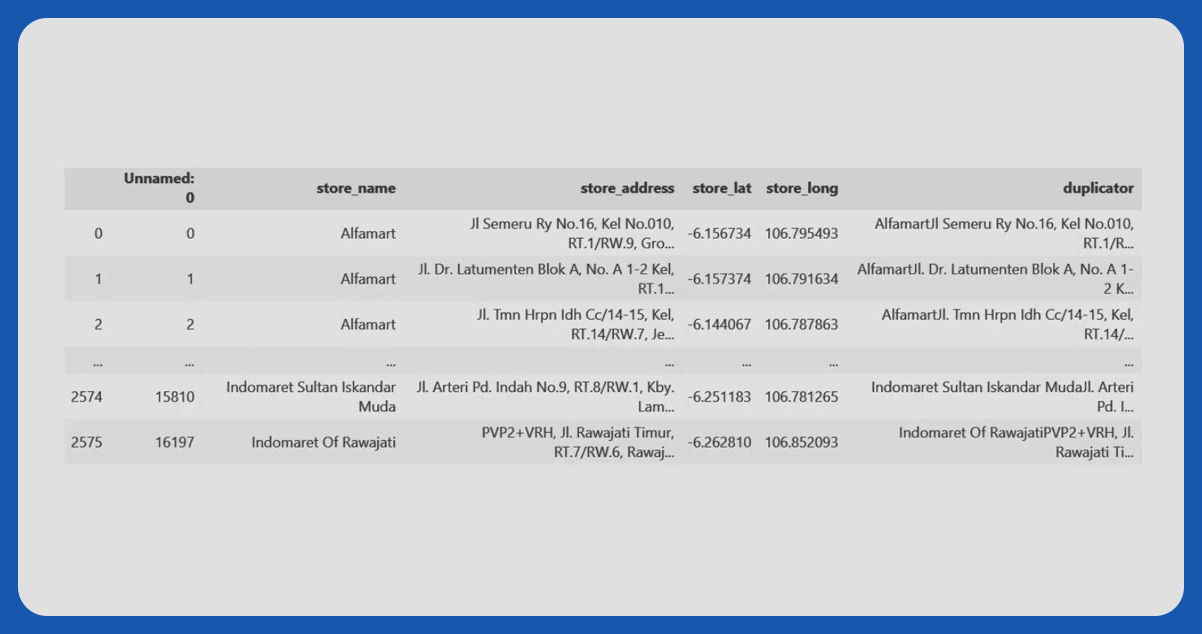
Next, we'll extract the data from the Google Places API. We've created four empty lists to store the store names, addresses, latitudes, and longitudes.
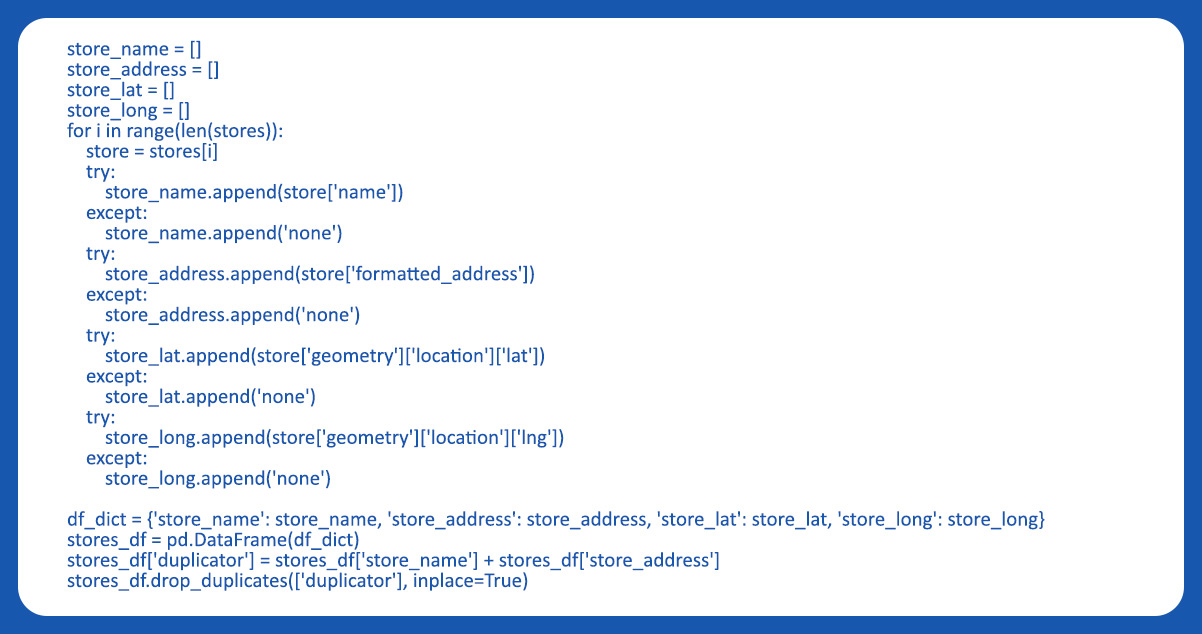
Finally, we can save the extracted data in either an XLSX or CSV file format, allowing us to use the data later when creating the Folium map.

After obtaining the store data locations from the Google Places API, the initial step is to perform data cleaning for the population density dataset sourced from
https://data.jakarta.go.id/.
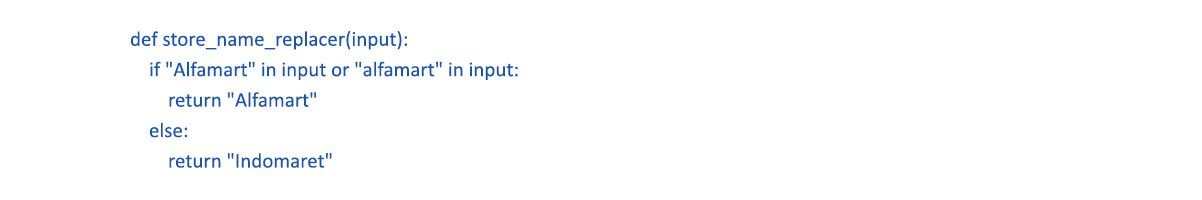
We will create a new column containing only "Indomaret" or "Alfamart" using a regular Python function to clean the store names obtained from the API. This process will simplify the store names and make them more standardized for further analysis and mapping.
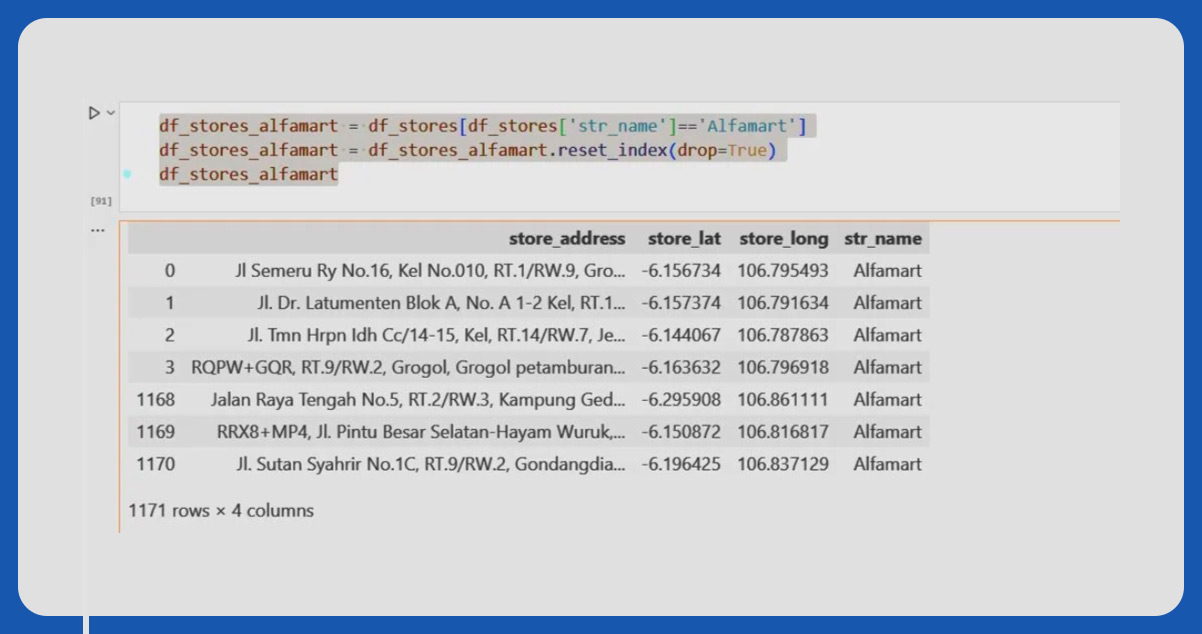
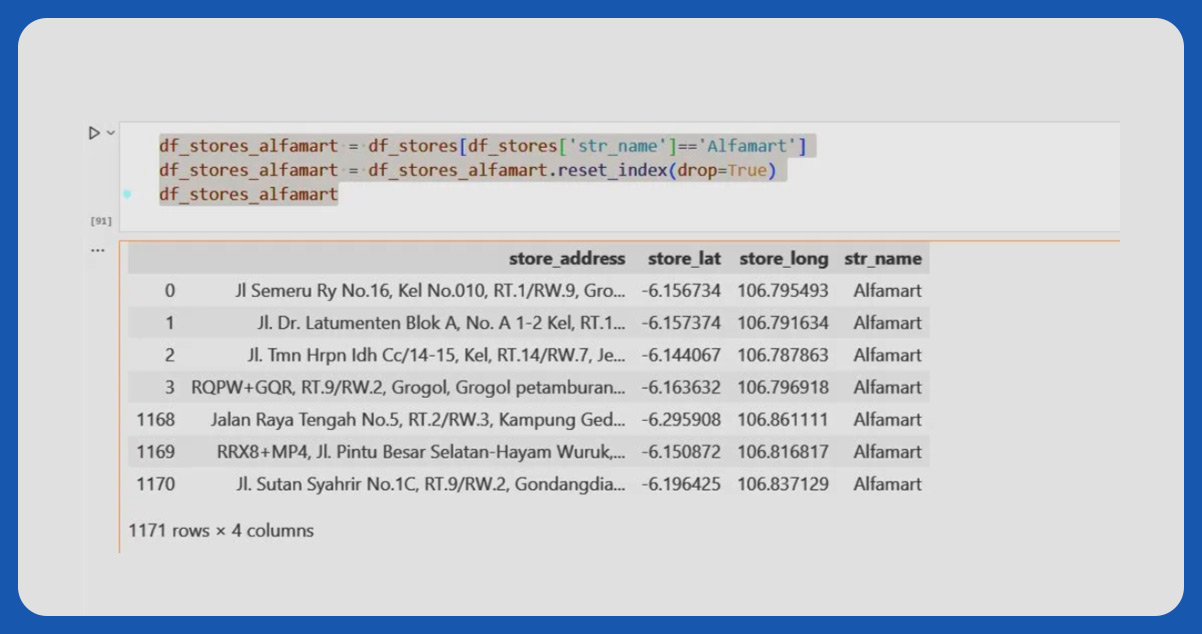
After cleaning the data and creating the new column with standardized store names, we will drop unused columns from the dataset. Next, we will separate the dataframe into two separate dataframes: "df_stores_alfamart" and "df_stores_indomaret." These data frames will contain the relevant information for each store type (Alfamart and Indomaret), making it easier to perform specific analyses or visualizations for each store category.


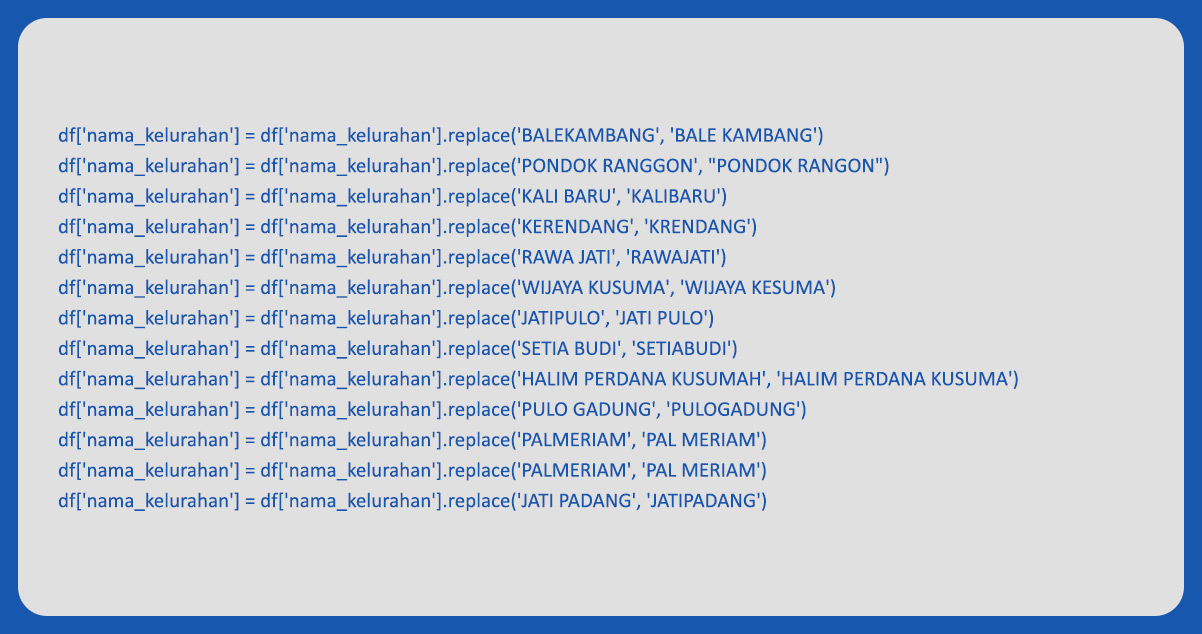
To ensure that the population density data is compatible with the choropleth map, the district names in the dataset and the geojson file must be an exact match; otherwise, they are not displayable on the map. Below is the code demonstrating how this matching is available:
Next, we will set up the bin density for the choropleth map. The bins will be based on the population density quantiles, ensuring an evenly spread range. This process will help us effectively represent the population density data on the map, providing clear and informative visualizations.

Now that we have separated the data frame into "df_stores_alfamart" and "df_stores_indomaret," we will create three lists: "store_latitude," "store_longitude," and "store_address." The Folium script will use these lists to plot the store locations on the map accurately. This step is crucial for visualizing the store data effectively and identifying potential new store locations to population density.

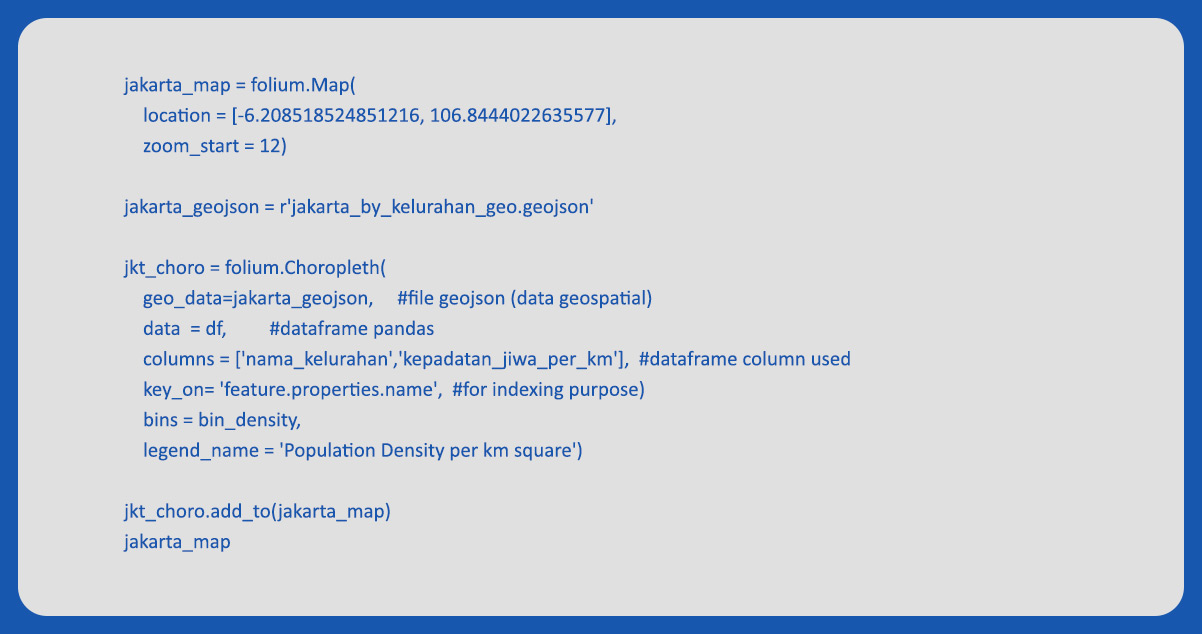
Below is the script to create the DKI Jakarta map using the geojson, folium, and the population density dataset:
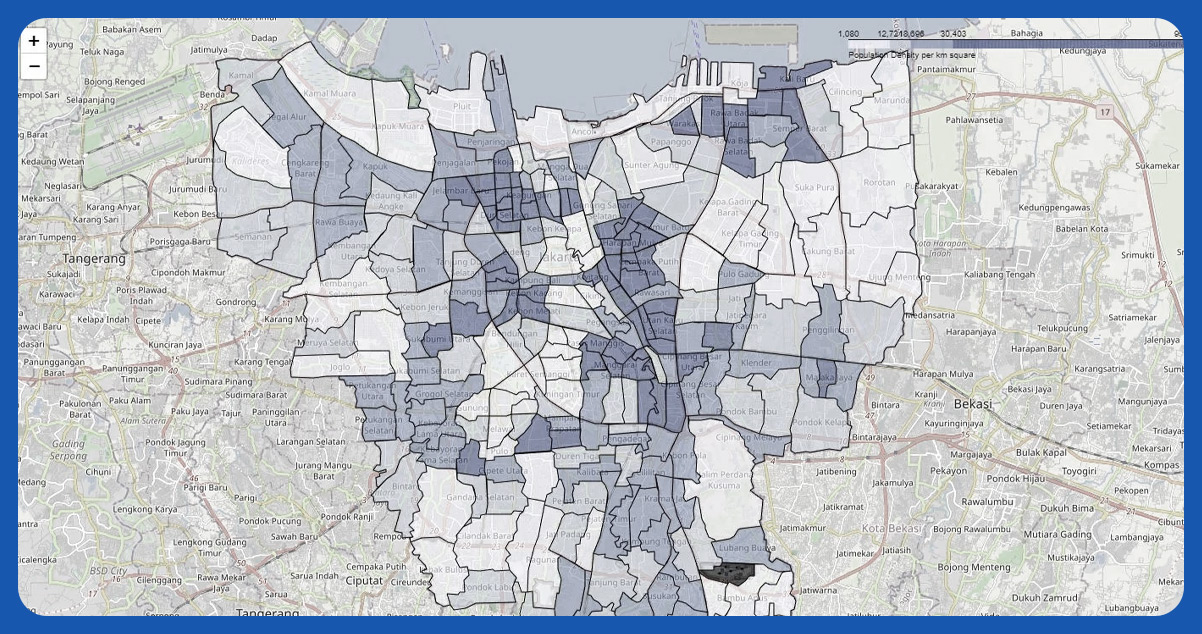
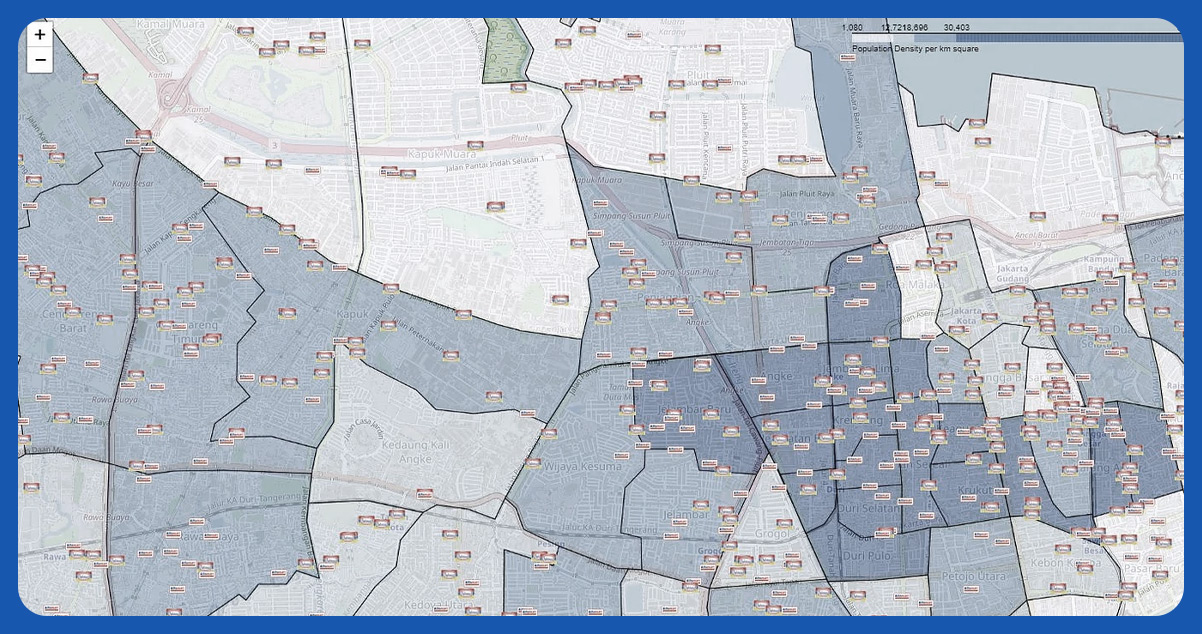
The choropleth map will display a darker gradient color in areas with higher population density, indicating denser regions. Conversely, areas with lower population density will appear whiter on the map, representing less dense areas. This color gradient provides a clear visual representation of population density variations across different districts in DKI Jakarta.
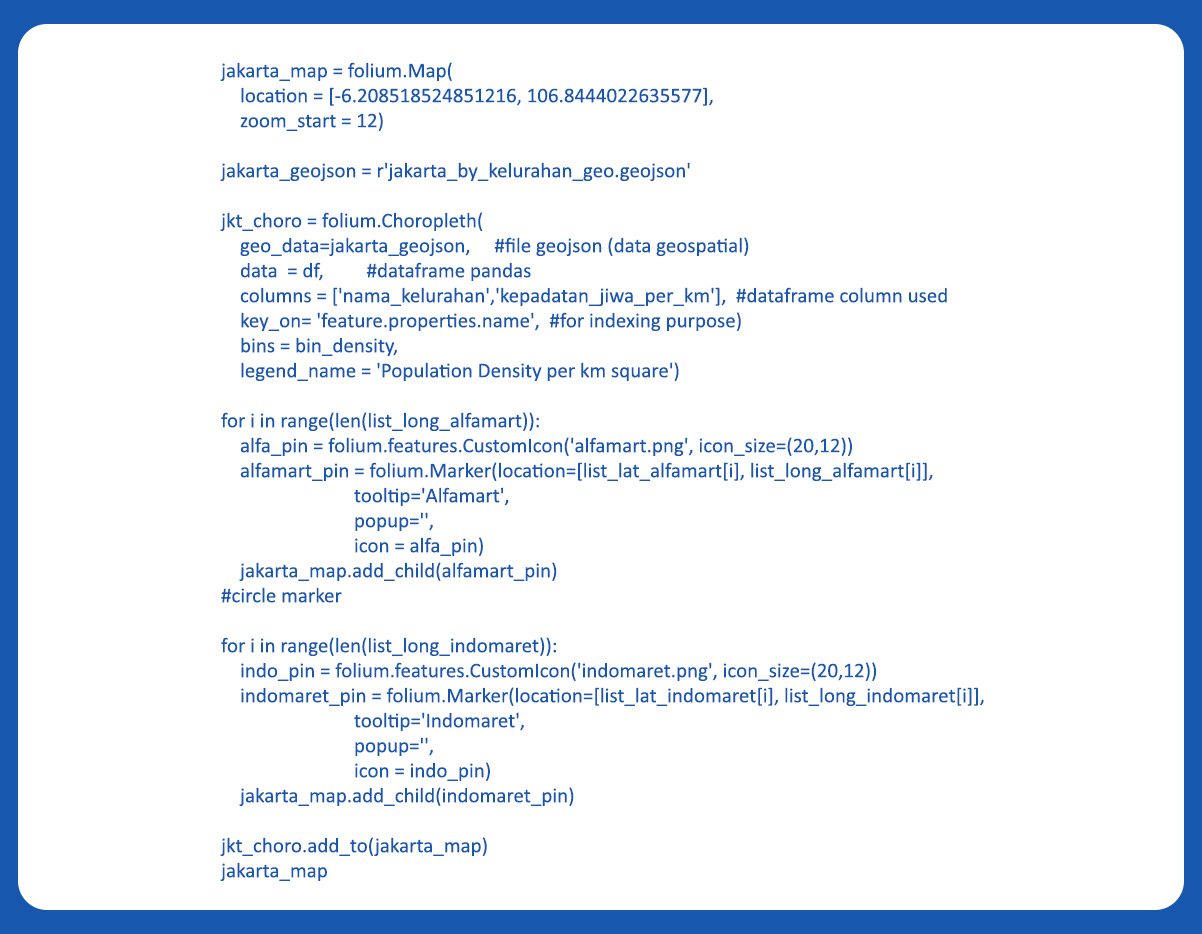
Next, we'll use the dataset containing information about Alfamart and Indomaret stores to add markers on the Folium map. Here's the code:
The DKI Jakarta Map appears crowded due to the significant number of Indomaret and Alfamart stores, totaling more than 2500, scattered across the region. The abundance of store markers can make the map visually overwhelming, potentially hindering the clear visualization of other important information, such as population density.
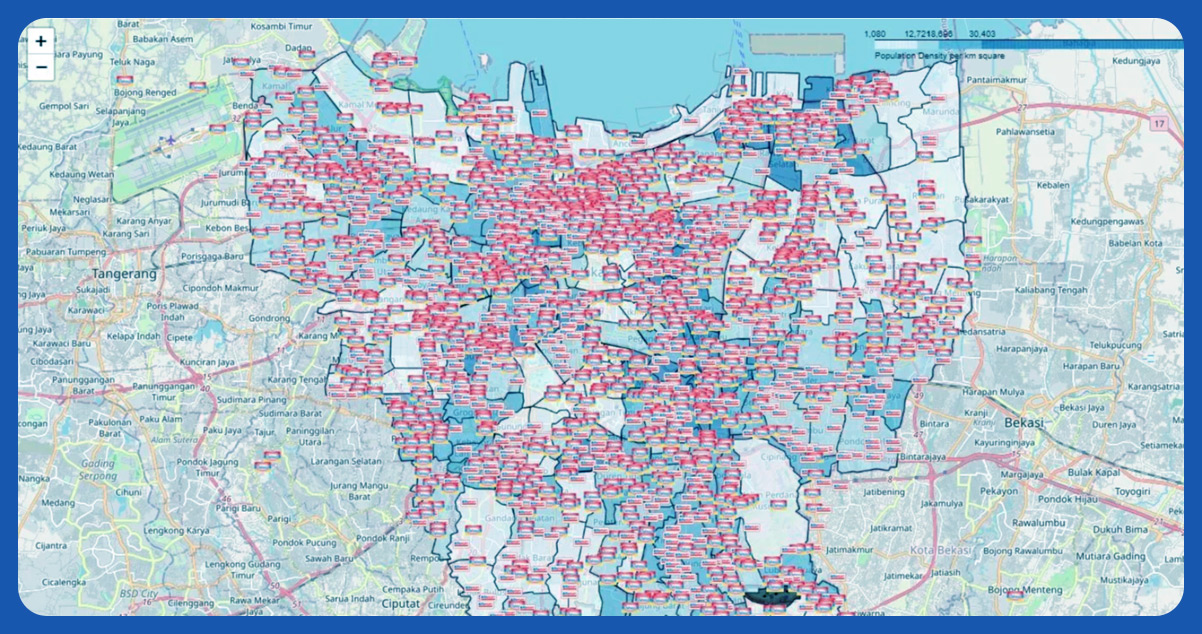
As depicted in the picture below, there is a noticeable disparity in the number of stores opened between the less dense (white) and more densely populated (darker blue) areas on the map. Additionally, it's evident that wherever an Indomaret store is present, an Alfamart store also exists, showing a pattern of coexistence between these two retail chains across DKI Jakarta.
Next, we'll use the dataset containing information about Alfamart and Indomaret stores to add markers on the Folium map. Here's the code:
The DKI Jakarta Map appears crowded due to the significant number of Indomaret and Alfamart stores, totaling more than 2500, scattered across the region. The abundance of store markers can make the map visually overwhelming, potentially hindering the clear visualization of other important information, such as population density.
As depicted in the picture below, there is a noticeable disparity in the number of stores opened between the less dense (white) and more densely populated (darker blue) areas on the map. Additionally, it's evident that wherever an Indomaret store is present, an Alfamart store also exists, showing a pattern of coexistence between these two retail chains across DKI Jakarta.
Conclusion:
Utilizing the Google Places API offers a straightforward and efficient way to access location information without developing a web-crawling application, which can be time-consuming. This API lets us quickly gather relevant data, saving time and effort.
Moreover, this technique is versatile and applies to various case studies, such as identifying ATM locations near universities or other specific scenarios. By leveraging the Google Places API, we can efficiently obtain valuable location insights for many use cases, making it a powerful tool for location-based analysis and decision-making.
Get in touch with iWeb Data Scraping today for more information! Whether you require web or mobile data scraping services, we've covered you. Don't hesitate to contact us to discuss your specific needs and find out how we can help you with efficient and reliable data scraping solutions.
For further details, contact iWeb Data Scraping now! You can also reach us for all your web scraping service and mobile app data scraping needs