In footwear, Nike and Adidas stand out as industry giants, boasting immense popularity, a dedicated consumer base, and a diverse product lineup renowned for its quality, performance, and style. Our recent endeavor involved scraping product data from Nike and Adidas, explicitly focusing on the men's and women's footwear categories. This blog delves into a comprehensive competitive analysis of this dataset, aiming to scrape nike product data and gain insights into product variety, pricing tactics, customer ratings, and overall satisfaction strategies adopted by both companies. The download links for the data are available at the bottom of this page.
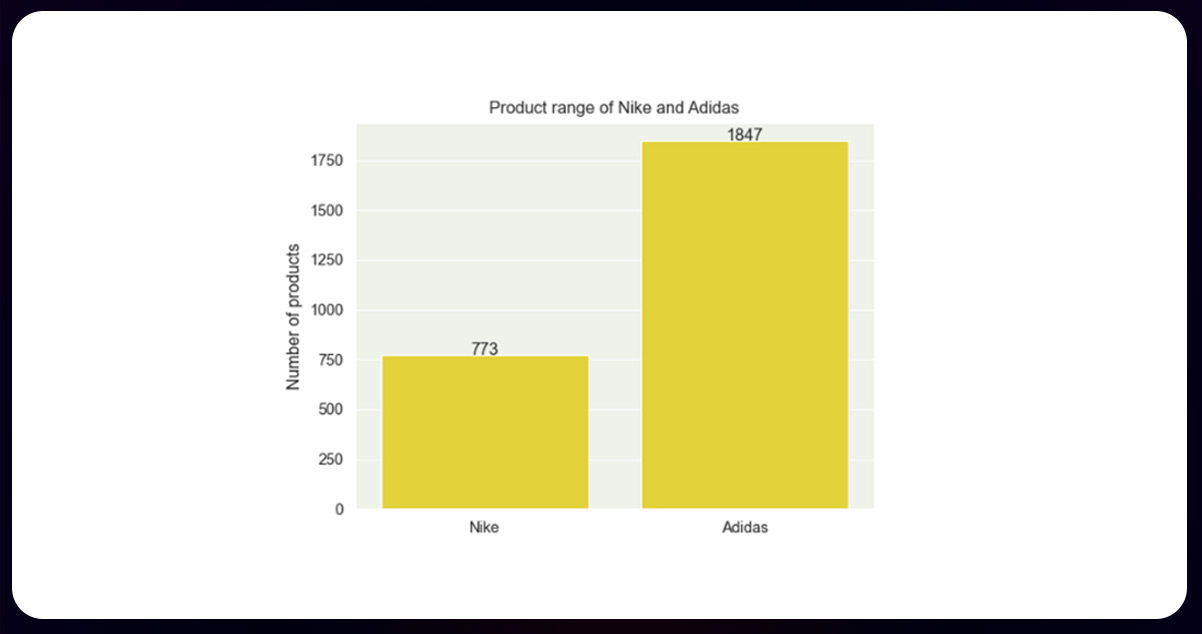
Nike vs. Addidas Competitive Analysis determine how these titans in the sportswear industry, showcase extensive product offerings with noteworthy distinctions. Adidas boasts a substantial product range of 1547 items, priced between 450 and 30999, surpassing Nike's 750 products ranging from 1695 to 27995. Analyzing Adidas's inventory, 55.6% targets men, 22.1% women, and the remainder is unisex. Nike's product distribution includes 42.2% for men, 37.1% for women, and unisex options. While both favor men's products, Adidas dominates with a higher proportion, particularly in the footwear category. Access the detailed visualizations and download links for the data below.
Nike vs. Adidas: A Comparative Analysis of Pricing Strategies
Scraping e-commerce product data reveals that effective pricing strategies are pivotal for product sales and brand establishment. Our focus involves examining four distinct segments determined by the Maximum Retail Price (MRP), not the sale price. The ensuing visualizations encapsulate a comprehensive analysis of these segments, shedding light on their significance in shaping pricing dynamics and contributing to overall brand strategy.
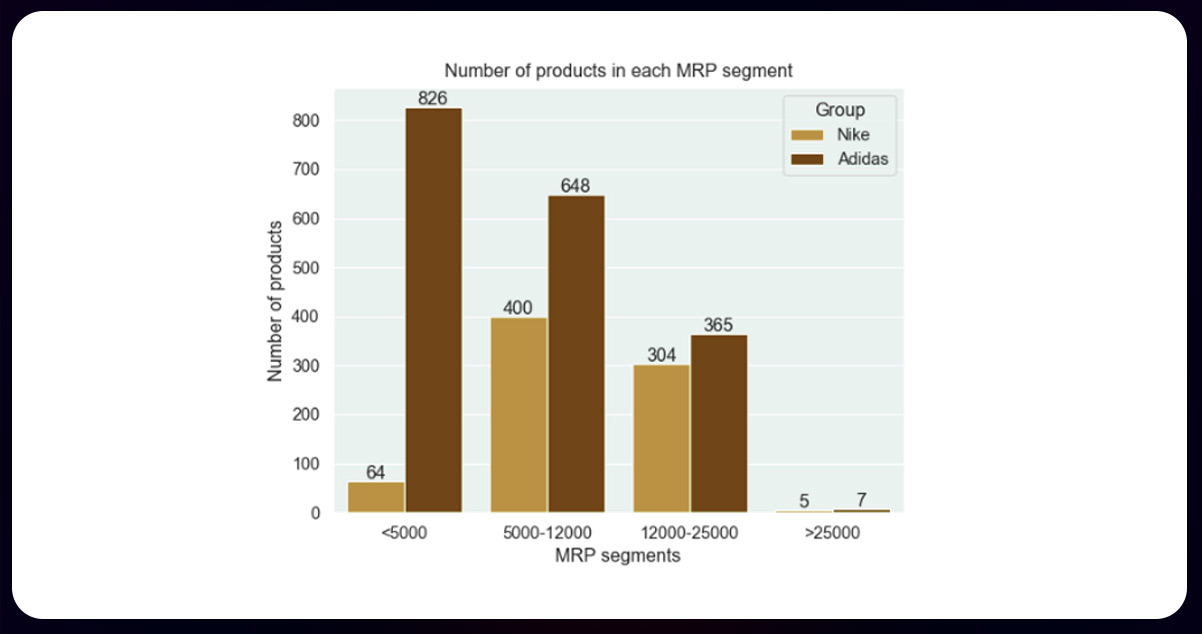
Using E-commerce data scraping services, we found that Adidas offers 1026 items in this category, starting at Rs 809. In contrast, Nike features 60 products in this price range, with the lowest-priced item at Rs 1705.
Within this range, Adidas provides 620 products, starting from Rs 5099. On the other hand, Nike has 490 products, with the lowest priced at Rs 5285.
Adidas presents 300 items in this bracket, beginning at Rs 12079, while Nike showcases 304 products, with the lowest priced at Rs 12157.
In the premium category, Adidas boasts 7 products, starting at Rs 26569, and Nike features 5 products, with the lowest priced at Rs 22500.
Utilizing discounts ranks among the most potent marketing strategies, captivating customers who view them as opportunities for savings. Beyond merely boosting sales, discounts enhance a company's reputation. Striking the right balance in discount percentages is pivotal to E-commerce Data Scraping from Nike and Adidas, as excessive or inadequate discounts can dampen customer interest and harm a company's image. Achieving an optimal average discount becomes crucial for companies seeking to maximize customer engagement while safeguarding their brand reputation.
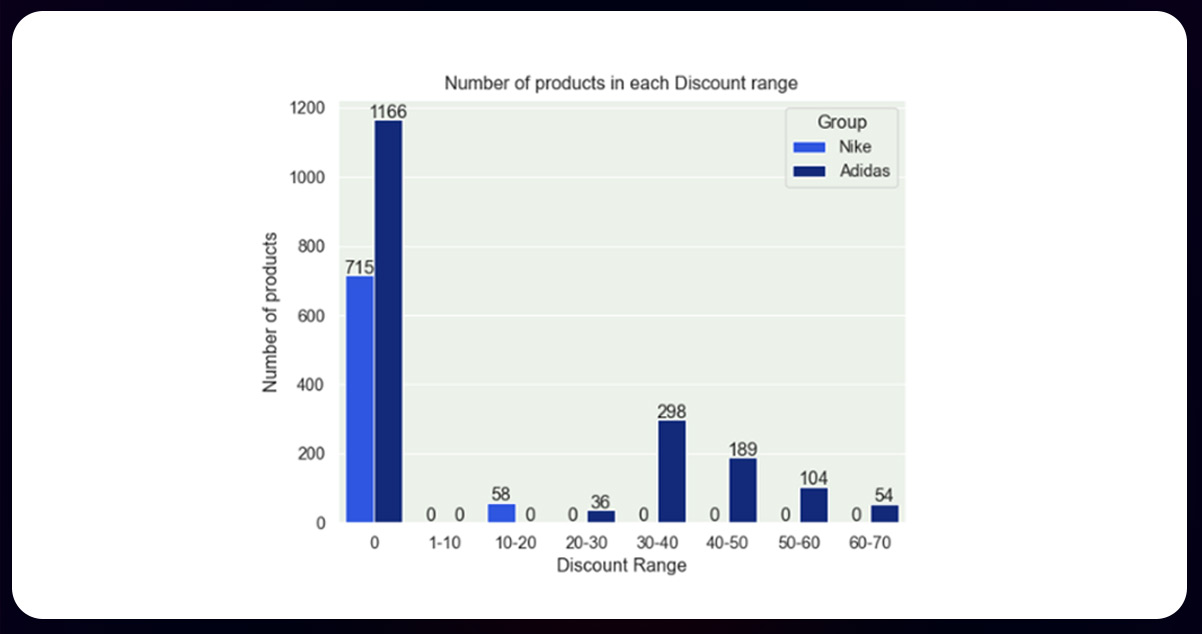
Our analysis of Nike and Adidas discounts using E-commerce data Scraper reveals significant variations in their approaches. Of Nike's 770 products, only 6.5% receive discounts. In contrast, Adidas, with 1047 products, offers discounts on 34.9% of its items. Nike maintains an average discount of 0.45%, with a maximum discount of 15%, while Adidas offers an average discount of 11.99%, reaching a maximum of 64%. Notably, Nike concentrates discounts in the 10-20% range, while Adidas adopts a more widespread approach, offering discounts across various ranges. Visualizations illustrate these distinctive discount strategies.
In the realm of pricing strategy, an essential metric is the average sales price, representing the typical selling price for a specific category of goods or services. This metric is a crucial indicator of a company's sales effectiveness and is prominently available to customers. Maintaining a favorable average sales price is imperative for attracting customers. The visualizations below showcase the pricing variations, providing insights into how brands strategically position themselves in the market.
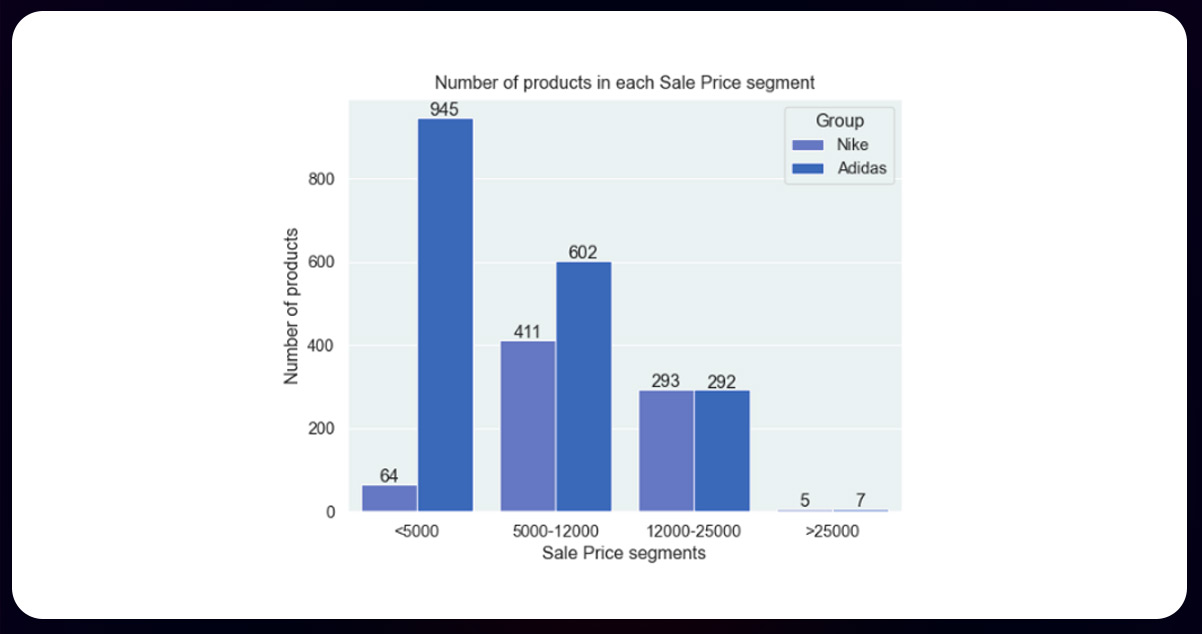
Adidas boasts 900 products in this category, with the lowest-priced item at Rs 350. In comparison, Nike offers 62 products within this range, with the lowest-priced product at Rs 1455.
Within this bracket, Adidas features 700 products, starting from Rs 4200, while Nike showcases 401 products, with the lowest priced at Rs 4097.
Products Priced Between Rs 11500 – 22500 (Approximately $120 – $300):
Adidas presents 290 items in this range, beginning at Rs 12500, while Nike offers 291 products, with the lowest priced at Rs 12050.
In the premium category, Adidas highlights 7 products, starting at Rs 28099, and Nike features 5 products, with the lowest priced at Rs 24005.
.jpg)
From our examination, Nike's average sales price is Rs 10240, while Adidas maintains an average of Rs 6500.
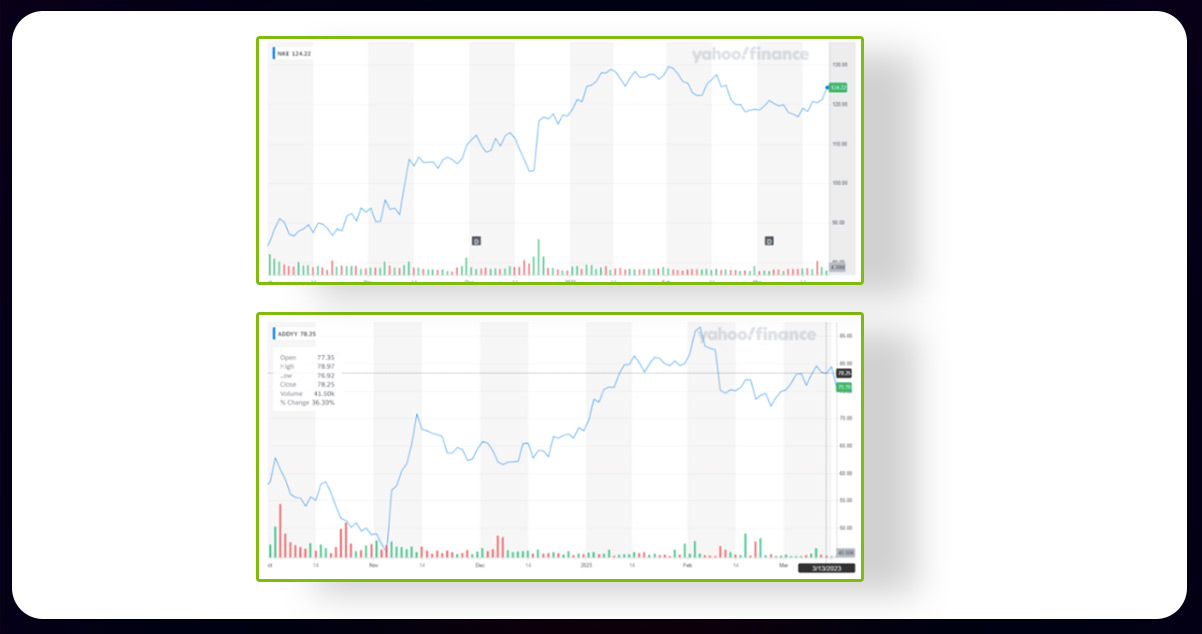
Market share, representing a company's percentage of industry sales, dictates industry leadership and competitiveness. Both Nike and Adidas command substantial market shares in the footwear industry. As of March 2023, Nike's market capitalization reached 187.33 billion, significantly surpassing Adidas's market capitalization of 22.883 billion. These figures underscore their prominence and influence in the market.
Nike vs Adidas: Social Media Following Analysis
In digital marketing, Nike and Adidas wield significant influence with substantial social media presence, enhancing brand recognition and trust in the digital era. As of March 2023, the follower counts for both brands across major social media platforms are detailed below:
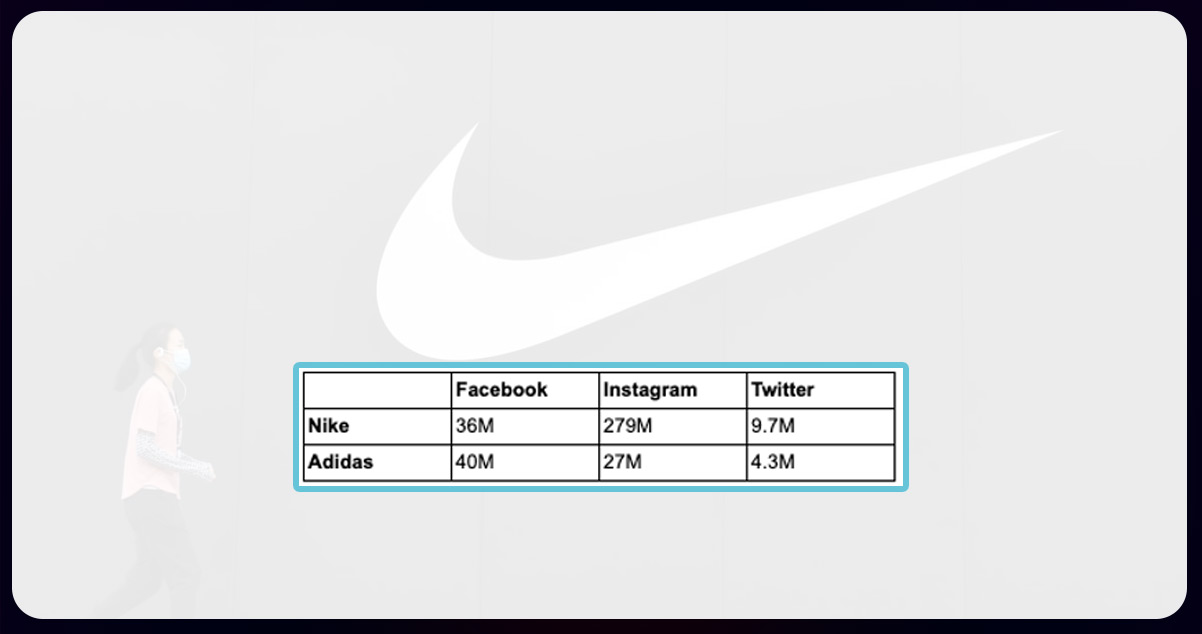
While Adidas takes the lead in Facebook followers, Nike significantly outpaces Adidas on Instagram and Twitter. This substantial difference underscores Nike's superior social media presence and more effective strategy, positioning it as a frontrunner in leveraging digital platforms for brand engagement and outreach.
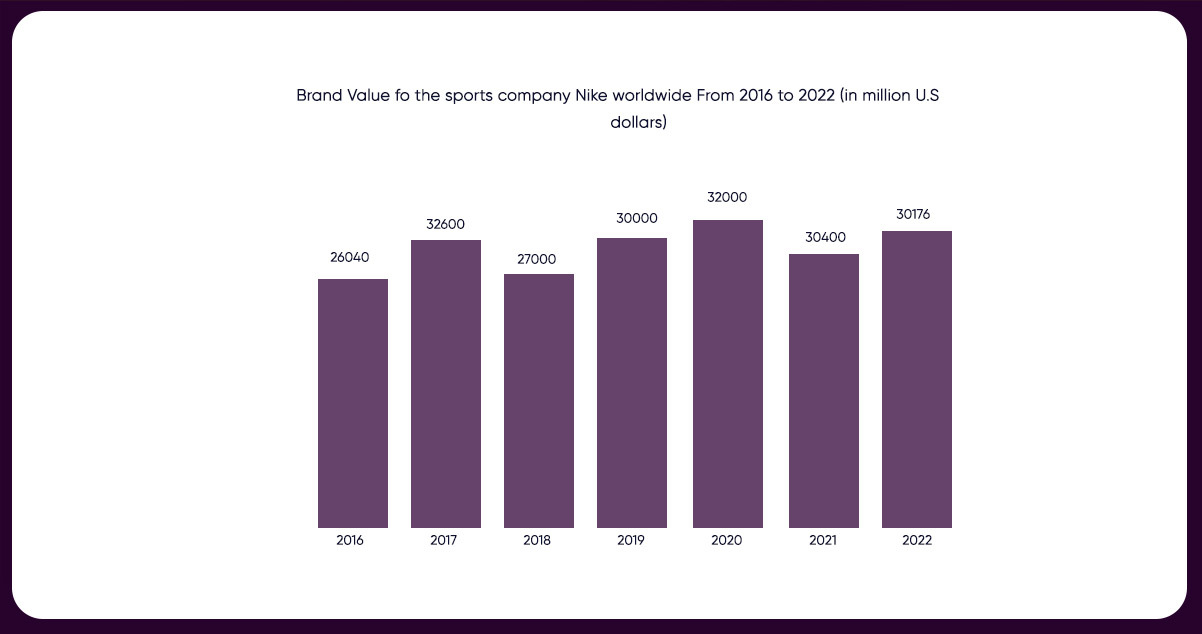
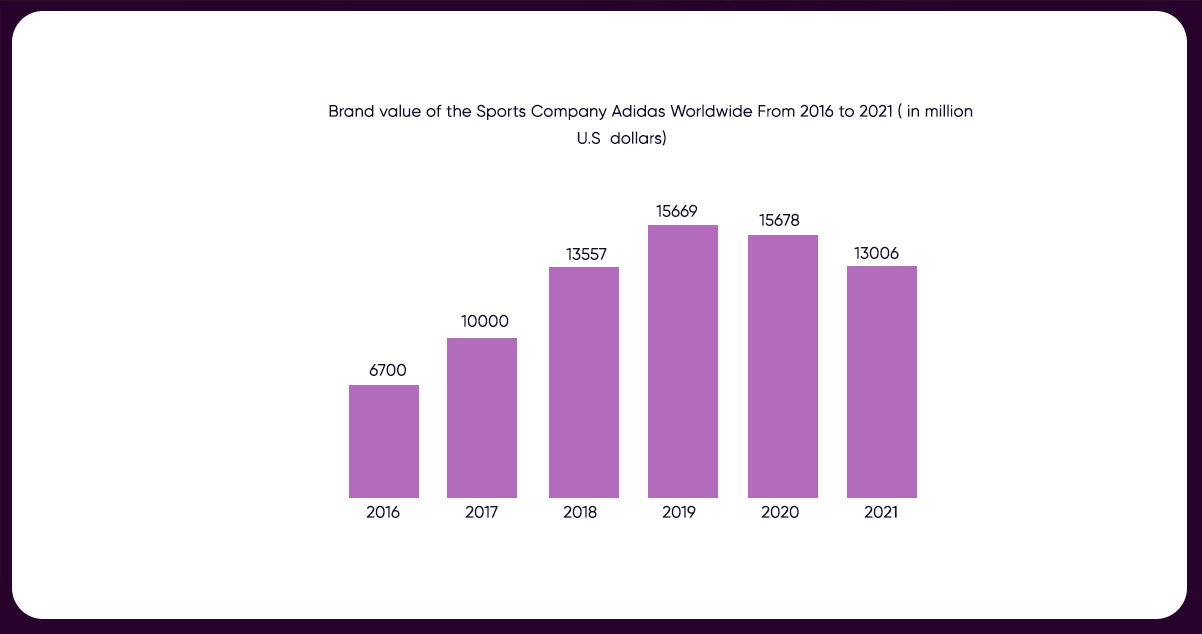
Brand value serves as a reflection of a company's standing and customer perception. It represents the worth of a brand in the eyes of its consumers, influencing the ease of introducing and selling new products. Nike and Adidas have cultivated robust brand values over the years, maintaining a positive brand image. As of 2022, Nike holds an estimated brand value of around 30.1 billion U.S. dollars, surpassing Adidas, at approximately 12.3 billion U.S. dollars. These figures underscore the enduring strength and resonance of both brands.
Conclusion: Nike and Adidas, stalwarts in the footwear industry, share prominence for their distinct designs, comfort, performance, and pricing. Choosing between the two can be challenging, prompting a perpetual Nike vs Adidas debate. Our analysis covered product range, pricing, discounts, market share, social media presence, and brand value to provide clarity. Scrape Adidas product data to understand how Adidas excels in product variety, lower average sales, and extensive discounts. Conversely, Nike leads in market share, social media following, and brand value. The ultimate choice between Adidas and Nike hinges on individual preferences, highlighting the effectiveness of each brand's unique strategies in dominating the footwear industry.
Feel free to reach out to iWeb Data Scraping for all-encompassing data solutions! Whether you require web scraping service or mobile app data scraping, our team is ready to help. Contact us today to discuss your needs and discover how our customized data scraping solutions can provide efficiency and reliability tailored to your unique requirements.