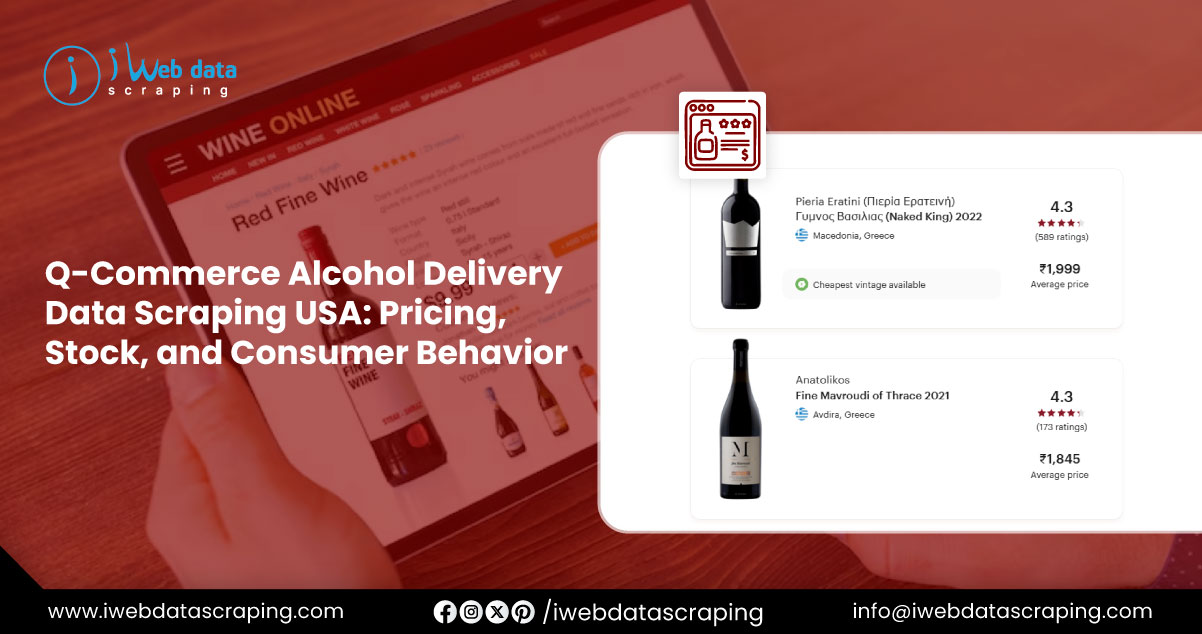
The United States has experienced a significant surge in Q-Commerce alcohol delivery data scraping USA, fueled by growing consumer demand for quick, convenient, and reliable access to alcoholic beverages. Quick commerce (Q-Commerce) platforms, which guarantee delivery within 30–60 minutes, are reshaping the landscape of liquor retail, allowing consumers to receive their favorite products faster than ever before. By utilizing advanced tools to Scrape alcohol retail pricing data and implementing robust data extraction methods, businesses can gain valuable insights into key market trends, customer preferences, competitive pricing strategies, and state-specific regulatory compliance requirements. Accessing and Extracting U.S. liquor delivery market Data is increasingly essential not only for established retailers but also for emerging Q-Commerce startups seeking to carve out a competitive edge. Real-time visibility into product availability, dynamic pricing, delivery efficiency, and consumer behavior allows operators to optimize inventory management, tailor promotional campaigns, enhance customer experience, and make data-driven strategic decisions to remain agile in a rapidly evolving marketplace.
The rapid growth of Q-Commerce in alcohol delivery is fueled by several key factors:
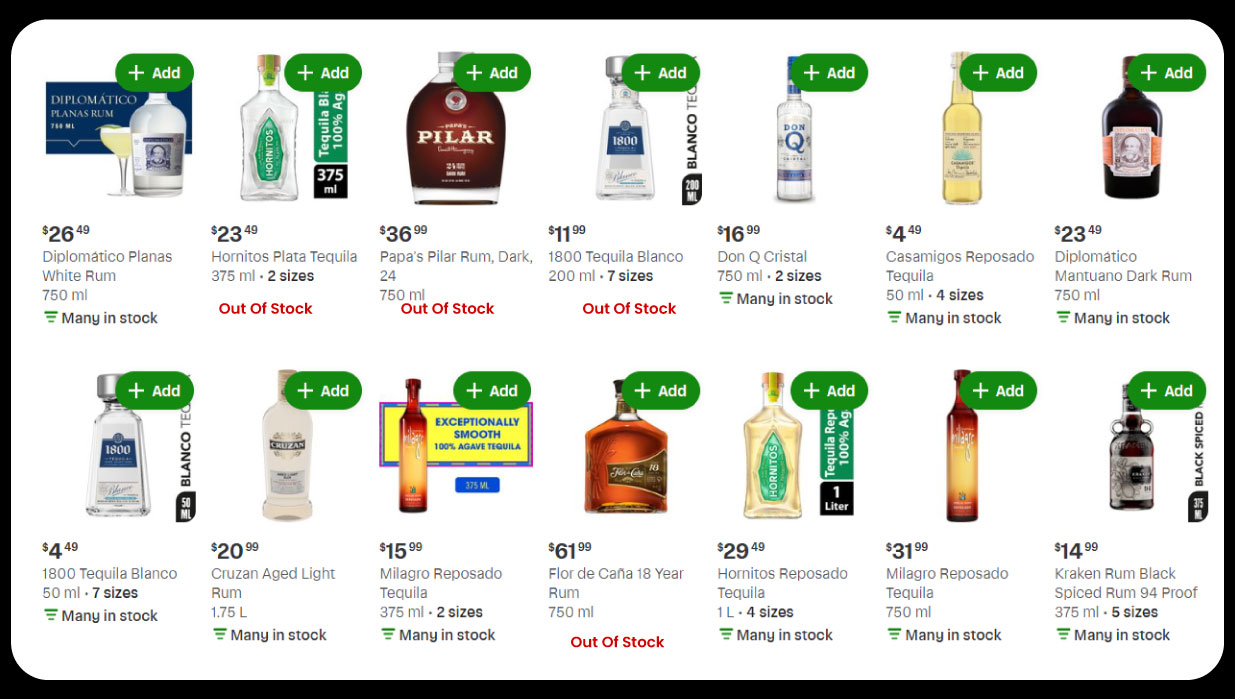
Web Scraping alcohol retail pricing data allows businesses to track competitor pricing, promotions, and availability across multiple states. This ensures informed decision-making, enabling retailers to remain competitive while maximizing margins.
Table 1: Top Alcohol Categories by Online Q-Commerce Sales (USA, 2025)
| Alcohol Category | % of Total Orders | Average Order Value (USD) | YoY Growth (%) |
|---|---|---|---|
| Beer | 40% | 25.5 | 6.2 |
| Wine | 30% | 45.0 | 7.1 |
| Spirits | 20% | 60.2 | 5.5 |
| Ready-to-Drink (RTD) | 5% | 15.0 | 9.0 |
| Mixers & Accessories | 5% | 12.5 | 4.8 |
The table, generated from Extract real-time alcohol stock data, highlights beer and wine as the most popular categories, while ready-to-drink beverages show the fastest growth, reflecting changing consumer preferences.
Scraping U.S. alcohol regulation insights and sales data requires a multi-layered approach:
U.S. beverage data extraction is crucial for understanding regional variations in alcohol consumption. Different states have diverse laws, taxes, and delivery restrictions, which directly affect Q-Commerce strategies. US regulatory data extraction tools assist in monitoring these regulations in real time, reducing legal risk and operational friction.
Table 2: State-wise Liquor Delivery Performance (USA, 2025)
| State | Avg Delivery Time (min) | Avg Order Value (USD) | % Orders Delivered On-Time | Popular Category |
|---|---|---|---|---|
| California | 35 | 55.0 | 92% | Wine |
| New York | 30 | 60.5 | 95% | Spirits |
| Texas | 40 | 50.2 | 88% | Beer |
| Florida | 33 | 53.0 | 90% | Wine |
| Illinois | 38 | 52.5 | 89% | Beer |
The table demonstrates how US state-wise liquor delivery data Scraping provides insights into delivery efficiency, average order value, and category popularity across major states.
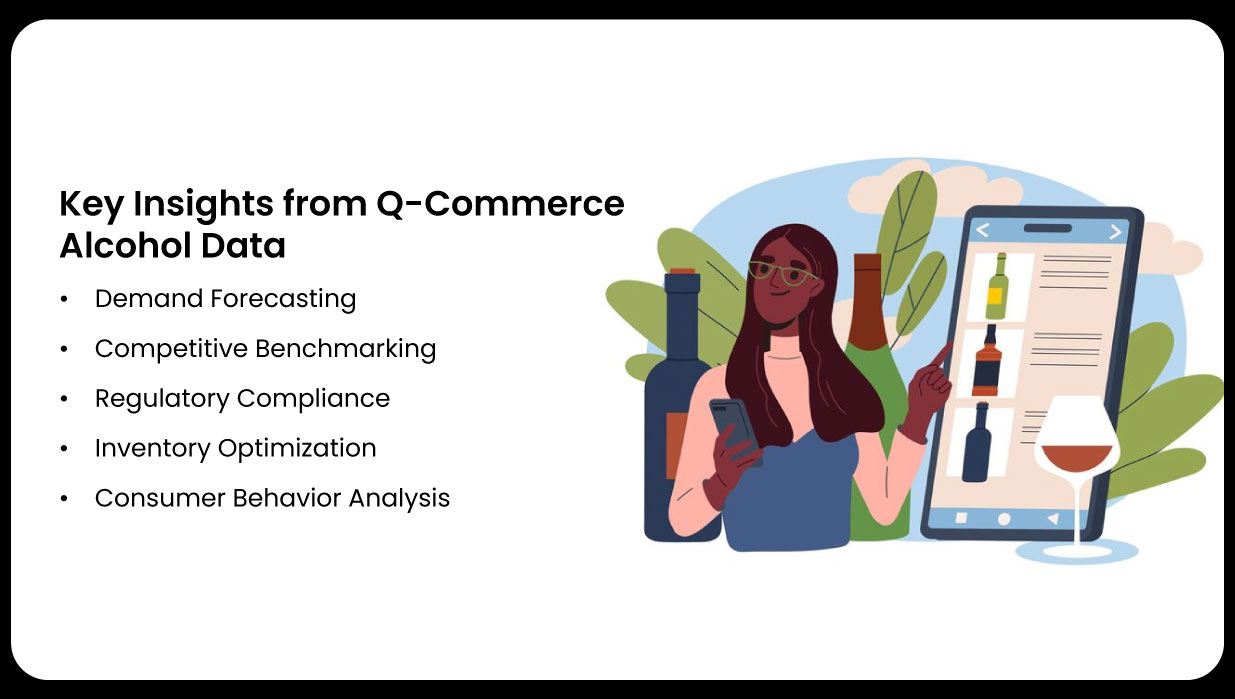
The Q-Commerce alcohol delivery market is expected to continue its rapid growth through 2026. Platforms will increasingly rely on Quick Commerce & FMCG Data Extraction Services to monitor real-time stock, pricing, and consumer trends. Enhanced predictive analytics will allow for more precise demand forecasting, dynamic pricing, and personalized promotions. Additionally, regulatory insights extracted through data scraping will become even more critical, given evolving state and federal laws.
Integration of AI-driven analytics will further improve decision-making, enabling personalized recommendations and optimized inventory management. Retailers leveraging Web Scraping alcohol retail pricing data will be able to respond faster to market changes, maintain competitive pricing, and improve customer satisfaction.
In conclusion, data scraping plays a critical role in the Q-Commerce alcohol delivery market in the USA. Platforms leveraging BevMo data scraping gain a competitive advantage by accessing real-time insights into pricing, stock levels, consumer behavior, and regulatory compliance. Using the alcohol data scraping API, businesses can streamline operations, accurately forecast demand, and make informed strategic decisions. As the Q-Commerce sector grows, the Q-Commerce Data Scraping API will become increasingly vital for maintaining efficiency and competitiveness. These tools help reduce operational risks, improve customer satisfaction, and position businesses for sustainable growth in a fast-evolving, highly competitive market.
Experience top-notch web scraping service and mobile app scraping solutions with iWeb Data Scraping. Our skilled team excels in extracting various data sets, including retail store locations and beyond. Connect with us today to learn how our customized services can address your unique project needs, delivering the highest efficiency and dependability for all your data requirements.
We start by signing a Non-Disclosure Agreement (NDA) to protect your ideas.
Our team will analyze your needs to understand what you want.
You'll get a clear and detailed project outline showing how we'll work together.
We'll take care of the project, allowing you to focus on growing your business.