Founded in 1950 by Harmon Dobson, Whataburger has evolved from a single Texas burger stand into a beloved regional fast-food chain. Recognized for its orange-and-white A-frame buildings and customizable burgers, the brand now spans 16 states, primarily across the southern United States. As of 2025, Whataburger’s growing footprint reflects regional dominance and national expansion ambitions. This report utilizes Real-time Whataburger Menu Data Scraping 2025 to analyze the chain’s presence, highlighting state-wise distribution, menu diversity, and strategic positioning. The analysis delivers a clear view of current operations and consumer trends by integrating insights from Whataburger Food Data Scraping Services, including data from its official website and third-party aggregators. Additionally, efforts to Extract Whataburger Food Delivery Data reveal pricing, availability, and menu customization options critical to understanding customer preferences. These insights offer valuable guidance for stakeholders, from franchise developers to market analysts, seeking to evaluate Whataburger’s influence in the competitive fast-food sector.
The data collection involved real-time web scraping of Whataburger’s official website (whataburger.com) and relevant third-party platforms such as whataburgermenuprices.com and xmap.ai. This effort aimed to Scrape Whataburger restaurant locations data in the USA, focusing on total outlet counts, geographic distribution by state, and operational attributes like drive-thru availability. The scraped dataset includes precise restaurant addresses, opening hours, and detailed menu information. To Extract Whataburger Prices and Product Details, the process captured popular item pricing and descriptions, enabling an in-depth analysis of value offerings across regions. The study also incorporates Web Scraping Whataburger Restaurant Listings to map brand reach and assess expansion patterns. The final analysis centers on the number of operational Whataburger restaurants in the United States as of 2025 and key menu pricing trends. Two tables are included: one showing the state-wise distribution of locations and another presenting menu prices for selected popular items.
Number of Restaurants
Whataburger’s footprint in 2025 reflects a strategic focus on southern states, with Texas dominating the distribution due to its historical roots and customer loyalty. The 1,109 locations reported by ScrapeHero align closely with xmap.ai’s estimate of 1,112, suggesting a minor discrepancy possibly due to recent openings or temporary closures, backed by reliable Food Delivery Data Scraping Services.
The chain’s expansion into Florida, Oklahoma, and Arizona indicates a deliberate strategy to target high-traffic areas near highways, universities, and suburban centers, supported by insights derived through the Restaurant Data Scraping Services.
The single-location states (Colorado, Georgia, Missouri, Tennessee) highlight untapped markets with significant growth potential, primarily as the brand aims to surpass 1,200 locations by 2026, a move monitored through comprehensive Food Delivery Data Intelligence Services.
State-wise Distribution
The following table summarizes the distribution of Whataburger restaurants across the US as of January 2025:
| State | Number of Locations | Percentage of Total | Restaurants per 100,000 People |
|---|---|---|---|
| Texas | 761 | 68.6% | 2.62 |
| Oklahoma | 46 | 4.1% | 1.16 |
| Florida | 42 | 3.8% | 0.21 |
| Arizona | 25 | 2.3% | 0.34 |
| Louisiana | 20 | 1.8% | 0.43 |
| Alabama | 18 | 1.6% | 0.36 |
| Mississippi | 15 | 1.4% | 0.51 |
| Arkansas | 12 | 1.1% | 0.40 |
| New Mexico | 10 | 0.9% | 0.47 |
| Other States* | 160 | 14.4% | Varies |
| Total | 1,109 | 100% | - |
*Other States include Colorado, Georgia, Missouri, Tennessee (1 each), and additional locations in Kansas, South Carolina, and others.
Menu Analysis
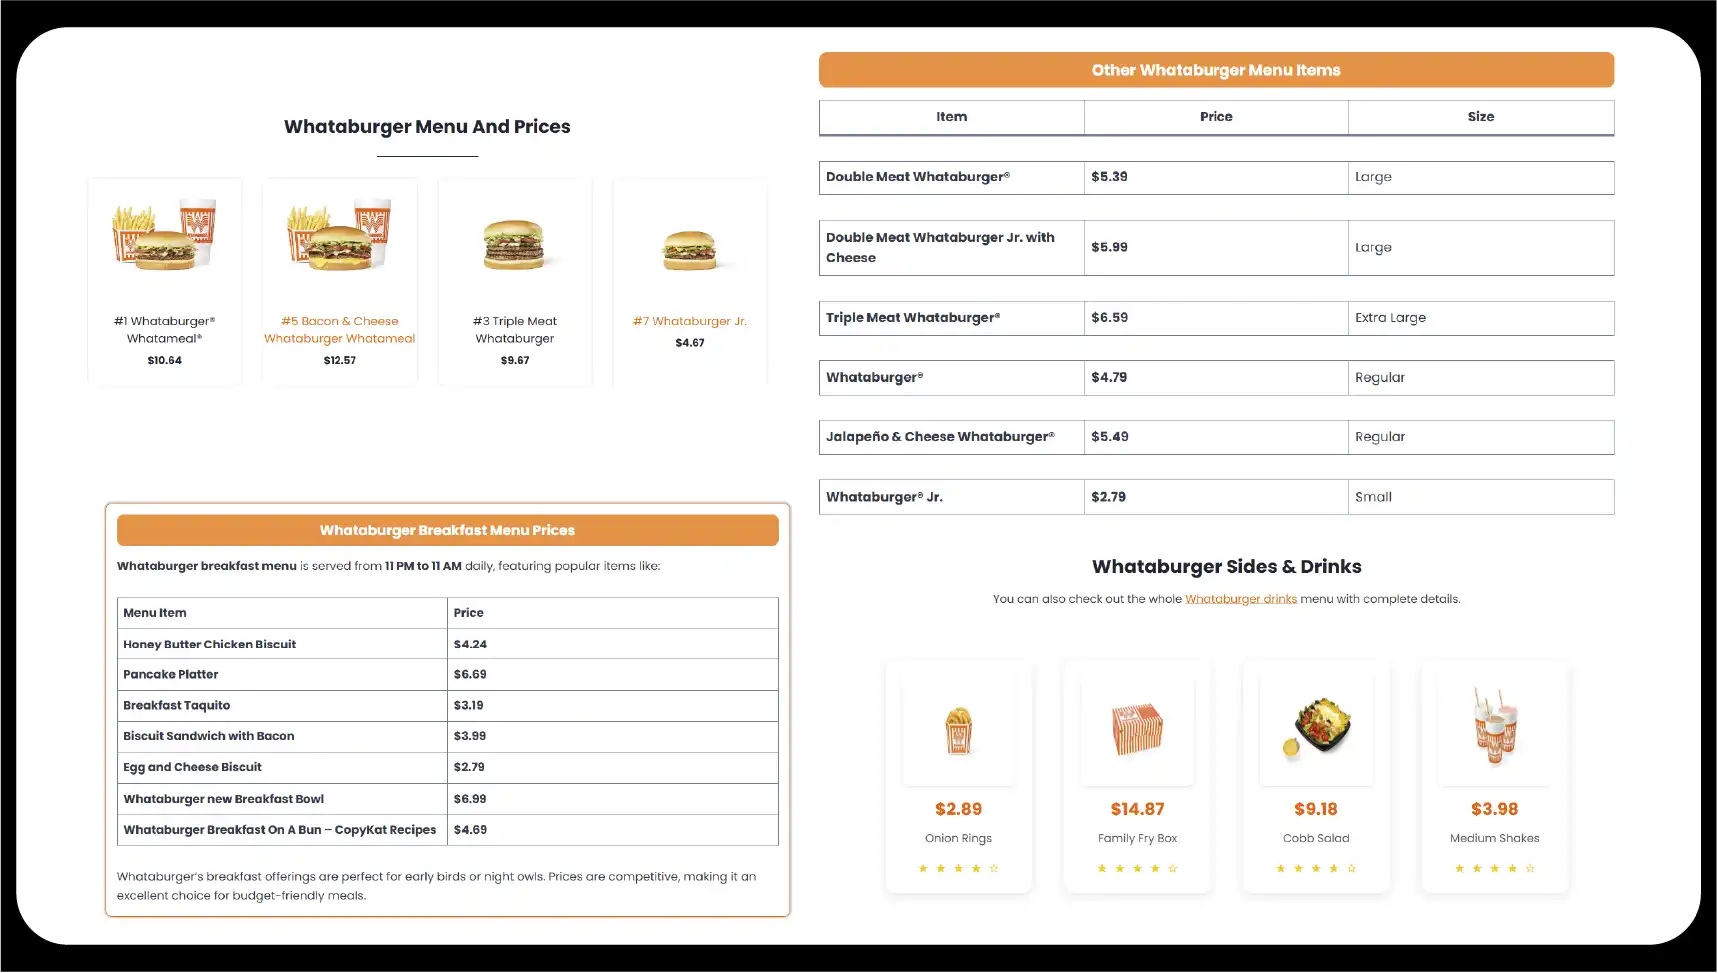
Real-time scraping of Whataburger’s menu reveals a diverse range of offerings, from classic burgers to breakfast items and limited-time specials. The menu is designed for customization, with over 36,864 topping combinations, catering to varied customer preferences. The following table highlights prices for key menu items in May 2025:
| Menu Item | Price (USD) | Category | Notes |
|---|---|---|---|
| Whataburger® | 7.09 | Burgers | Standard single-patty burger |
| Double Meat Whataburger® | 8.24 | Burgers | Popular choice for larger appetites |
| Triple Meat Whataburger® | 9.44 | Burgers | High-protein option |
| Bacon & Cheese Whataburger® | 8.09 | Burgers | Limited-time favorite |
| Honey Butter Chicken Biscuit | 4.24 | Breakfast | Served 11 PM–11 AM |
| Whatawings (9-piece) | 9.99 | Chicken | Limited-time, available in four flavors |
| 10 Whataburger Box | 58.07 | Group Ordering | Best value for group meals |
| Chocolate Chunk Brownie | 2.49 | Desserts & Snacks | New addition for 2025 |
| Mexican Hot Chocolate Shake | 4.99 | Drinks & Shakes | Limited-time anniversary item |
Whataburger’s operational model emphasizes freshness, with all items made to order, contributing to its reputation for quality. The chain’s 24/7 drive-thru availability at most locations and app-based ordering options enhance accessibility. The introduction of limited-time items like the Monterey Melt and Whatawings in 2025 reflects a strategy to keep the menu dynamic and attract repeat customers. The chain’s focus on community engagement, such as the Whataburger Feeding Student Success program, further strengthens its brand loyalty, with over $6.5 million donated to support education since 2020.

For investors, Whataburger’s consistent growth, with over $4 billion in annual revenue and a projected 1,200 locations by 2026, presents a lucrative opportunity. Franchisees can target emerging markets like Colorado and Tennessee, where single locations indicate low competition. Market analysts should note the chain’s use of AI-driven location scouting and real-time analytics, supported by Web Scraping Food Delivery App Data, which optimize site selection and menu offerings. Competitors like In-N-Out and Five Guys face challenges matching Whataburger’s customization options and regional loyalty, particularly in Texas. However, the chain must innovate with digital ordering and sustainable practices to maintain its edge in a competitive fast-food landscape, benefiting from comprehensive Food Data Scraping Services to stay ahead.
Whataburger’s 1,109 restaurants in 2025 reflect its robust growth and strategic focus on southern states, with Texas as its stronghold. Real-time Whataburger Restaurant App Datasets provides valuable insights into its operational model, pricing strategy, and expansion plans. The chain’s emphasis on customization, community engagement, and technological integration positions it for continued success. Through advanced Restaurant Data Intelligence Services, stakeholders can leverage this data to identify high-potential regions, optimize pricing, and enhance customer experiences. As Whataburger celebrates its 75th anniversary, its blend of nostalgia, innovation, and the use of Food Delivery App Menu Datasets ensures it remains a fast-food leader.
Experience top-notch web scraping service and mobile app scraping solutions with iWeb Data Scraping. Our skilled team excels in extracting various data sets, including retail store locations and beyond. Connect with us today to learn how our customized services can address your unique project needs, delivering the highest efficiency and dependability for all your data requirements.
We start by signing a Non-Disclosure Agreement (NDA) to protect your ideas.
Our team will analyze your needs to understand what you want.
You'll get a clear and detailed project outline showing how we'll work together.
We'll take care of the project, allowing you to focus on growing your business.