Introduction
The ongoing shift from conventional gasoline vehicles to electric vehicles (EVs) is profoundly transforming the transportation infrastructure across the United States. As electric mobility continues to gain traction, it has become increasingly important for businesses, policymakers, and consumers to understand the distribution, accessibility, and availability of EV charging stations in comparison to traditional gas stations. Mapping these networks not only provides insights into current infrastructure coverage but also identifies gaps that could impact adoption rates and consumer convenience.
This research focuses on Scraping EV Charging Points vs Gas Stations Data US, aiming to offer a detailed understanding of how EV chargers and fuel stations are spatially distributed across different regions, including urban and rural areas. The study leverages advanced web scraping methodologies to conduct a comprehensive Web scraping EV vs Gas Station analysis Data, allowing the collection of structured and real-time information for actionable insights.
Modern data extraction techniques enable us to Extract Real-time EV charger vs fuel stations data US, helping track not only the number and locations of stations but also operational status, usage patterns, and fuel pricing trends. By employing these tools, it becomes possible to Scrape EV charging points and gas locations Data, facilitating accurate comparative studies, identifying infrastructure gaps, and supporting data-driven planning for both the EV ecosystem and traditional fuel networks.
This report effectively demonstrates the potential of advanced data scraping techniques in analyzing the US energy infrastructure, identifying trends, and supporting future planning for both EV and gasoline networks.
Objectives
The main objectives of this research are:
- To analyze the distribution and density of EV charging stations and gas stations across the US.
- To identify geographic regions with high demand and low availability of EV chargers or gas stations.
- To compare fuel pricing trends at gas stations with the accessibility of EV charging points.
- To evaluate the effectiveness of Web Scraping EV and Gas Station Locations Across the US for real-time data monitoring.
- To provide actionable insights for businesses, policymakers, and EV infrastructure developers.
Methodology
This study employed a systematic approach to collect, clean, and analyze EV charging points and Gas Stations Stores Location Data across the United States. The methodology consists of the following steps:
1. Data Sources
- EV Charging Data: Public APIs such as the US Department of Energy’s Alternative Fuels Data Center (AFDC) and private platforms providing EV station data.
- Gas Station Data: Aggregated from commercial APIs, business directories, and publicly available datasets on gas station locations.
- Supplementary Sources: Google Maps API, Yelp business listings, and regional utility databases.
2. Web Scraping Techniques
- Python-based scraping using libraries such as BeautifulSoup, Selenium, and Scrapy to extract data from websites that list EV chargers and gas stations.
- Data cleaning to remove duplicates, outdated records, and erroneous entries.
- Standardization of address formats, geographic coordinates, and station attributes for uniformity.
3. Data Attributes Collected
- Station Name
- Station Type (EV Charger or Gas Station)
- Address, City, State, ZIP Code
- Latitude and Longitude
- Number of Charging Ports / Fuel Pumps
- Fuel Prices (for gas stations)
- Operational Status (Active / Inactive)
4. Analytical Techniques
- Spatial Analysis using GIS tools to visualize density and distribution.
- Comparative analysis to determine the coverage gap between gas stations and EV chargers.
- Trend Analysis for fuel pricing and EV station installations over time.
- Statistical Summaries to assess regional disparities.
Data Overview
Below are two tables representing sample data for EV charging stations and gas stations across major US states.
Table 1: EV Charging Station Sample Data
| California |
12,450 |
6 |
Los Angeles |
98 |
| Texas |
4,230 |
4 |
Austin |
95 |
| New York |
3,120 |
5 |
New York City |
97 |
| Florida |
2,540 |
4 |
Miami |
96 |
| Illinois |
1,820 |
3 |
Chicago |
94 |
Table 2: Gas Station Sample Data
| California |
8,940 |
8 |
Los Angeles |
4.25 |
| Texas |
10,120 |
6 |
Houston |
3.75 |
| New York |
5,650 |
7 |
New York City |
4.10 |
| Florida |
4,900 |
6 |
Miami |
3.90 |
| Illinois |
3,580 |
6 |
Chicago |
3.85 |
Key Analysis
1. Density Comparison
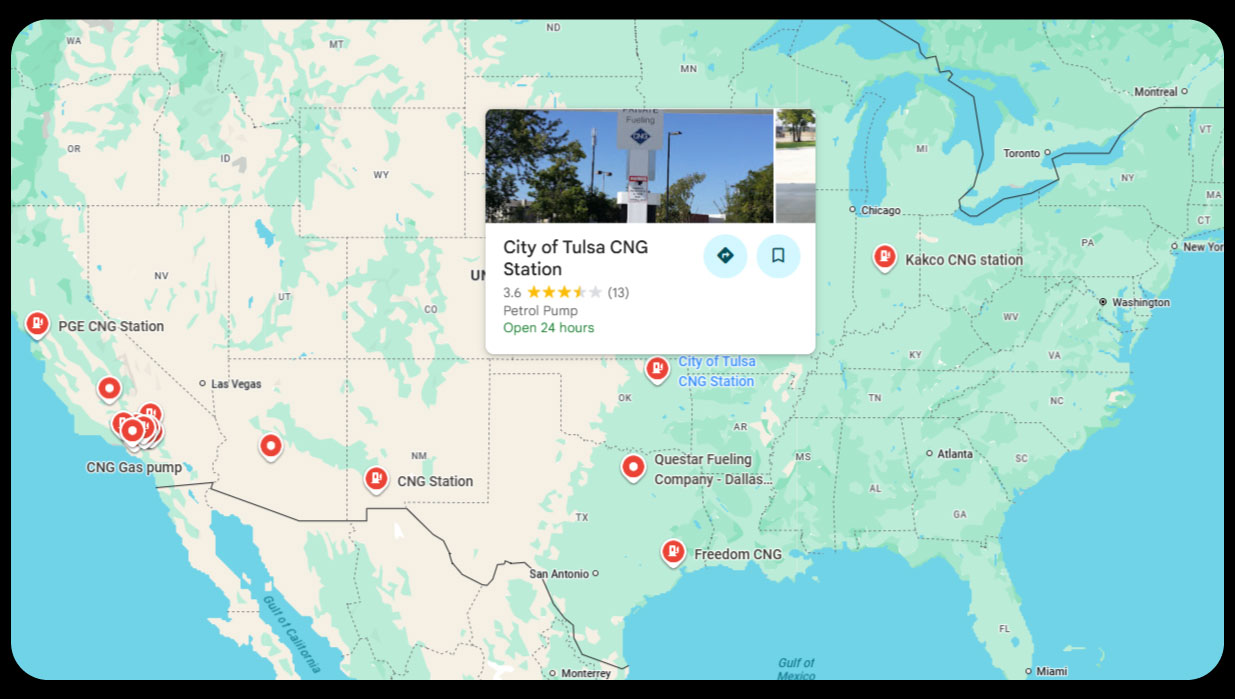
By Scraping Fuel vs EV Station Density in US, it is evident that gas stations still outnumber EV charging stations in most states, particularly in the central and southern regions. However, urban centers like California and New York have seen rapid growth in EV charging infrastructure, reflecting higher EV adoption rates.
- California has more EV stations than gas stations due to policy incentives and high EV adoption.
- States like Texas and Florida still have a larger number of gas stations, indicating slower EV infrastructure deployment.
2. Regional Disparities
Spatial analysis highlights significant regional disparities:
- West Coast States: High EV station density, reflecting strong government incentives.
- Southern States: Low EV charger availability despite rising EV adoption.
- Midwestern States: Moderate EV charger coverage; gas stations dominate.
This emphasizes the need for targeted infrastructure expansion in regions with growing EV adoption.
3. Fuel Pricing Trends
Using Fuel Pricing Intelligence Services, the study compared gas prices across regions:
- Urban areas consistently show higher fuel prices, which may incentivize EV adoption.
- Gas station density does not always correlate with lower fuel prices; competition in dense urban areas drives pricing variability.
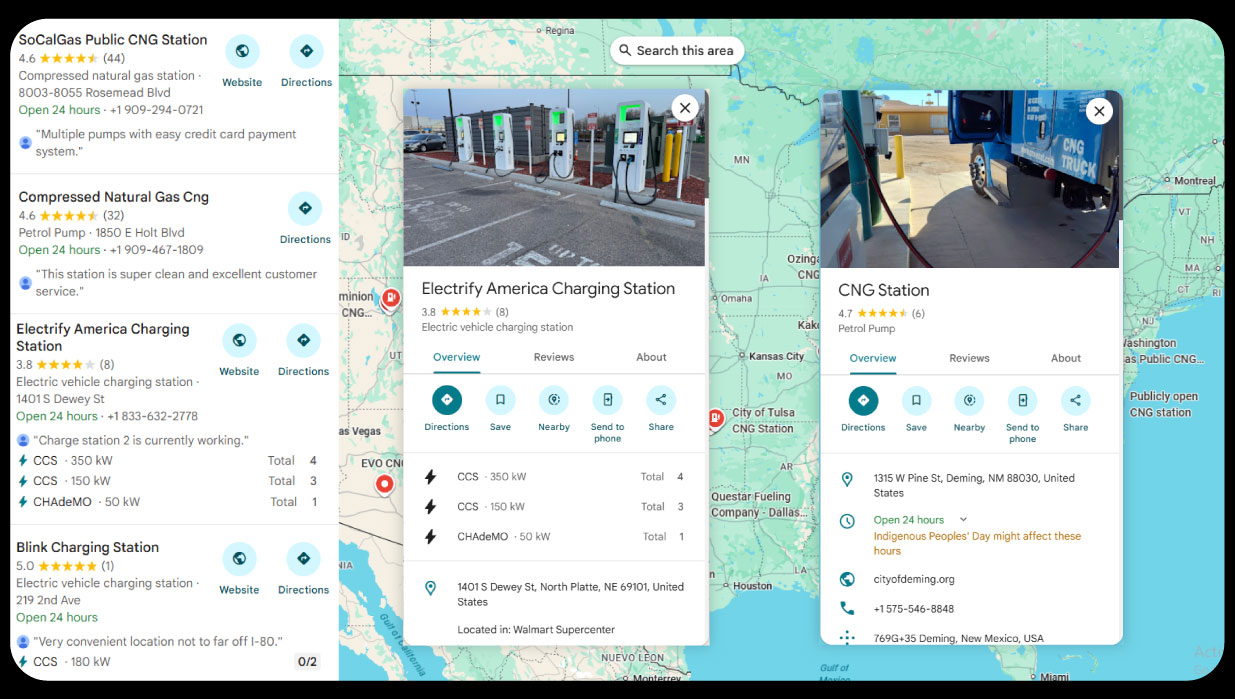
4. EV Charger Utilization
Average number of charging ports per station varies from 3 to 6, with California averaging the highest. High-demand cities like Los Angeles report near-full utilization during peak hours, highlighting infrastructure gaps.
5. Web Scraping Insights
- Real-time data collection allows tracking of station operational status, outage alerts, and new installations.
- Web scraping EV vs Gas Station analysis Data enables integration of geographic, operational, and pricing metrics for advanced analytics.
Observations from Tables
- California leads in both EV chargers and gas stations, but EV charger density surpasses gas stations in urban regions.
- Texas and Florida have significant gas station networks, yet EV infrastructure is limited to major cities.
- Average fuel prices correlate with station density in urban centers but are less consistent in rural areas.
- EV charging stations generally have fewer charging points per location than gas stations have pumps, indicating potential bottlenecks during peak demand.
- Web scraping provides near real-time intelligence on both networks, enabling predictive analysis for station expansion and pricing strategy.
Comparative Analysis
EV Charging vs Gas Station Networks
| Density |
Lower, urban-centric |
Higher, widespread |
| Operational Hours |
Mostly 24/7 in urban centers |
Almost always 24/7 |
| Pricing Structure |
Pay per kWh / subscription-based |
Pay per gallon |
| Average Service Time |
30 min – 1 hour |
5–10 minutes |
| Accessibility |
Dependent on city infrastructure |
Widely accessible, rural-friendly |
| Real-time Data Availability |
Moderate (increasing via apps) |
High (fuel pricing apps & services) |
Key Insight: While gas stations remain dominant in coverage, EV charging stations are strategically located in high-demand regions, reflecting both urban adoption and state policies supporting EV infrastructure.
Strategic Implications

- Infrastructure Planning: States with low EV charger density need targeted deployment strategies to support the growing EV market.
- Business Opportunities: Companies can leverage web scraping to identify regions with underserved EV demand.
- Policy Making: Data-driven insights from Comparing Gas Stations and EV Chargers via Web Scraping help governments prioritize subsidies, incentives, and installation of fast chargers.
- Pricing Strategy: Fuel retailers can track competitors via Scraping U.S. Gas Stations for Fuel Pricing Trends and adjust prices dynamically.
Conclusion
The comparative analysis of EV charging points and gas stations in the US highlights the evolving landscape of transportation infrastructure. By leveraging Gas Station vs EV Charger Network Data Scraping Analysis, stakeholders gain actionable insights into regional disparities, utilization patterns, and infrastructure gaps.
Electric Charging Station Stores Location Data provides valuable intelligence for strategic planning to ensure businesses remain competitive in a rapidly shifting energy market.
The combination of Web Scraping EV Charger Stations Data and gas station information allows for a holistic understanding of transportation services, empowering policymakers, businesses, and consumers to make informed decisions in the age of electric mobility.
Experience top-notch web scraping service
and mobile app scraping solutions with iWeb Data Scraping. Our skilled team excels in extracting various data sets, including retail store locations and beyond. Connect with us today to learn how our customized services can address your unique project needs, delivering the highest efficiency and dependability for all your data requirements.