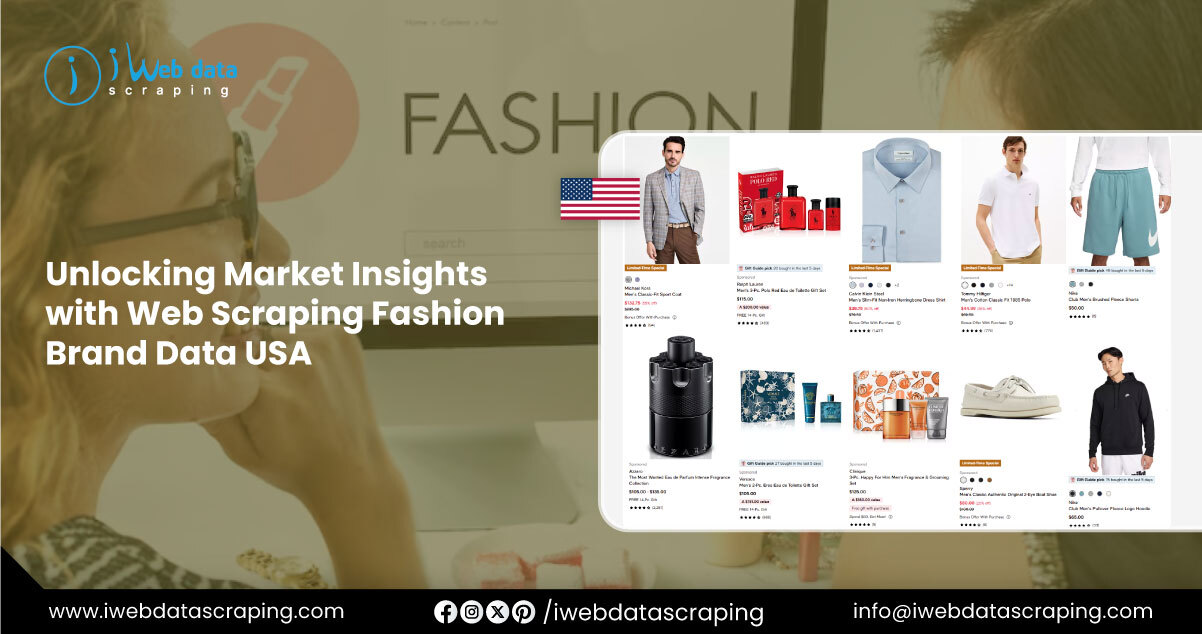
The fashion industry in the United States is a dynamic and rapidly evolving sector, contributing significantly to the global economy. With an approximately $365.7 billion market size in 2023, it is one of the largest apparel markets worldwide, driven by consumer preferences, e-commerce growth, and shifting trends toward sustainability and fast fashion. Web scraping fashion brand data USA has emerged as a powerful tool for gathering actionable insights from fashion brand websites, social media platforms, and e-commerce marketplaces. This report analyzes web-scraped data from fashion brands in the USA, focusing on the number of brands, dominant players, key observations, and significant findings. The clothing and accessories dataset USA extracted through these methods offers a comprehensive view of market dynamics, consumer behavior, and competitive landscapes. Additionally, real-time fashion product price tracking enables stakeholders to monitor pricing trends and competitor strategies, ultimately driving informed decision-making in this highly competitive industry.
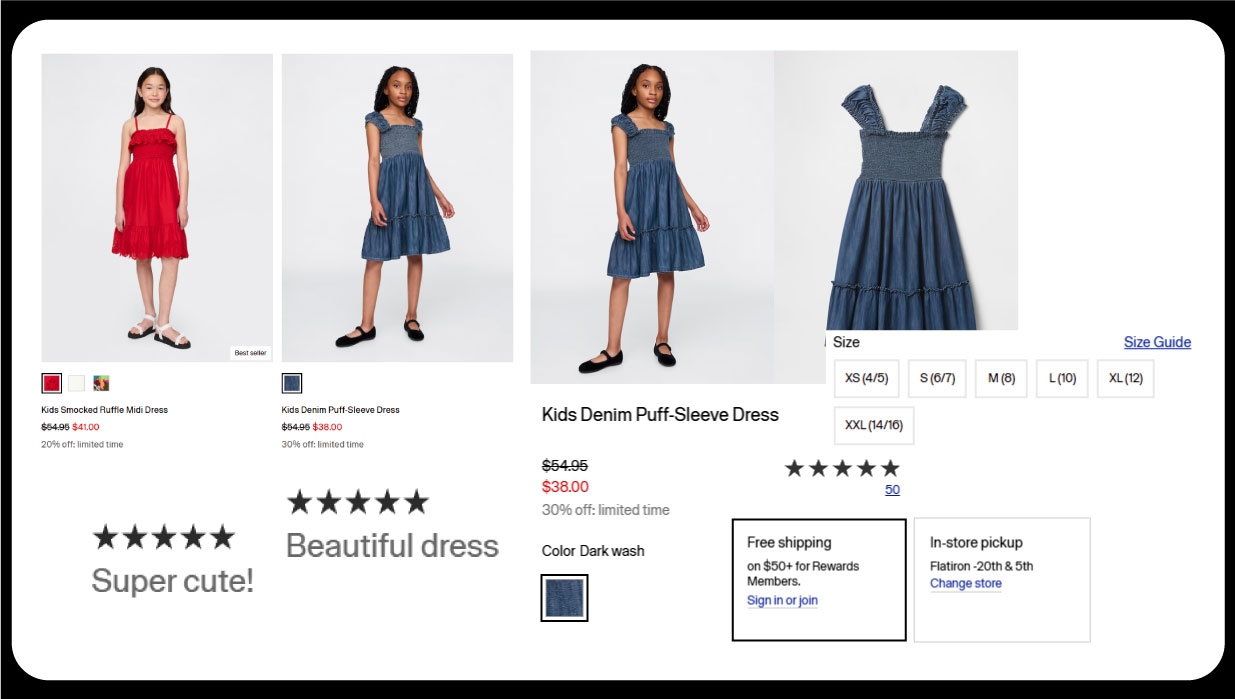
Data was collected by scraping publicly available information from major fashion retailer websites, including Nordstrom, Macy’s, GAP, Zara, SHEIN, and others, as well as e-commerce platforms like Amazon and social media channels like Instagram and TikTok. The scraped data included product listings, pricing, customer reviews, brand mentions, and sustainability metrics. Our ability to extract data from luxury fashion websites USA ensured coverage of high-end market segments. Approximately 1.5 million product records were extracted daily from over 120 fashion websites, leveraging advanced tools to scrape the latest collections from US apparel websites. This comprehensive dataset captures product names, categories, prices, discounts, and consumer sentiment. We also used specialized methods to scrape eCommerce clothing for US retailers, aggregating and analyzing data to identify trends, market dominance, and consumer preferences. Two tables summarize key metrics, with findings derived from quantitative analysis of product offerings, brand visibility, and market share.
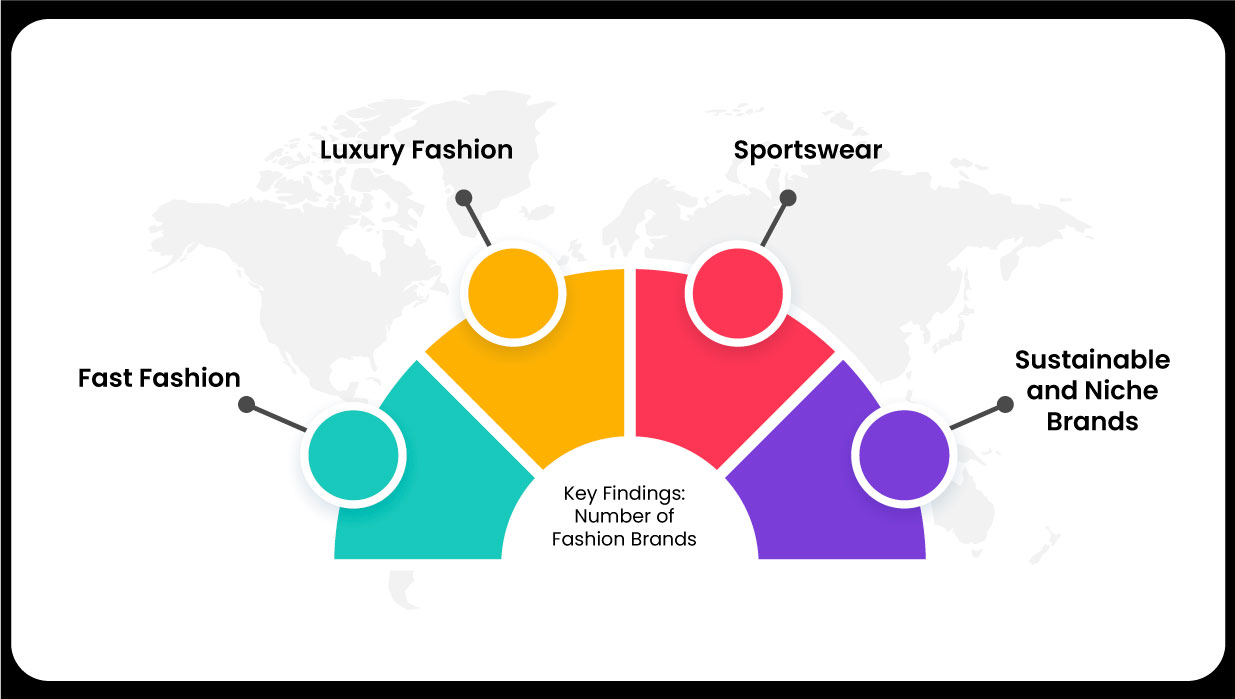
The US fashion industry is characterized by diverse brands, spanning fast fashion, luxury, sportswear, and sustainable segments. Web-scraped data revealed over 5,000 active fashion brands operating in the USA, as tracked by platforms like Good On You and Woven Insights. This includes major players like Nike, Zara, and SHEIN and smaller, niche brands focusing on sustainability or bespoke designs. The dataset highlighted the following breakdown:
The sheer volume of brands underscores the competitive nature of the US fashion market, with e-commerce platforms amplifying visibility for established and emerging players.
Table 1: Distribution of Fashion Brands by Segment in the USA (2024)
| Segment | Number of Brands | Market Share (%) | Key Players |
|---|---|---|---|
| Fast Fashion | 2,800 | 55% | SHEIN, Zara, H&M, Uniqlo |
| Luxury Fashion | 600 | 15% | Louis Vuitton, Gucci, The Row |
| Sportswear | 1,200 | 25% | Nike, Adidas, Lululemon |
| Sustainable/Niche | 400 | 5% | Patagonia, Everlane |
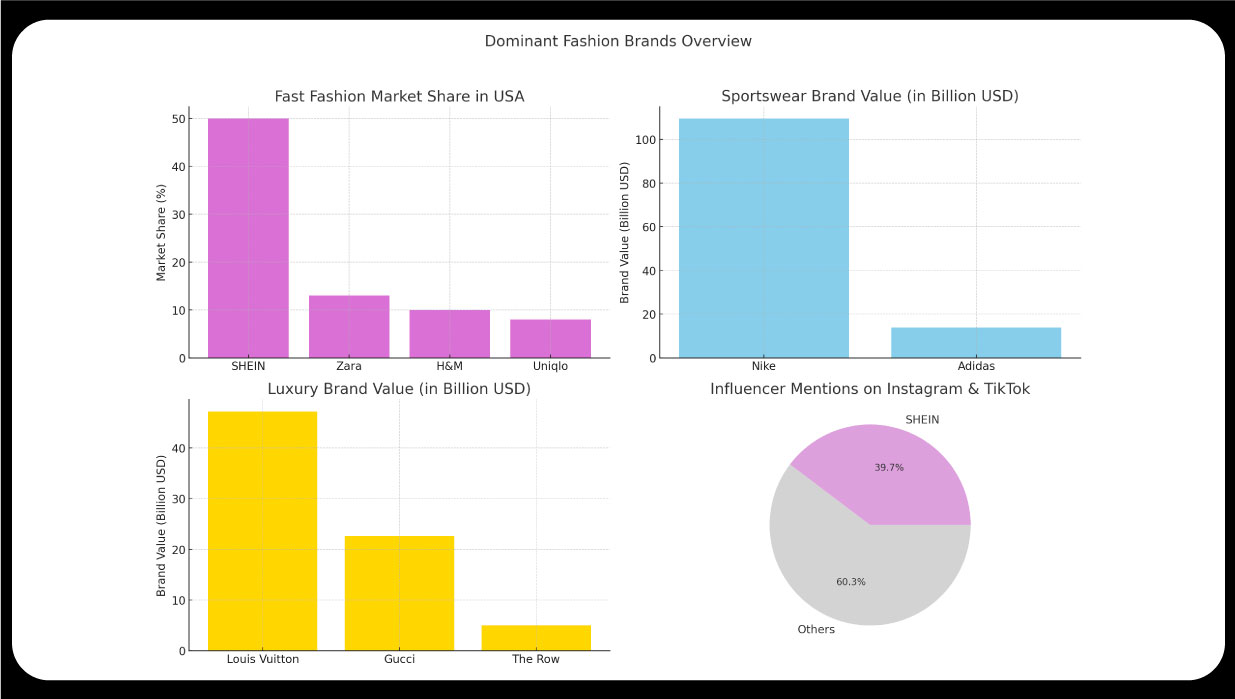
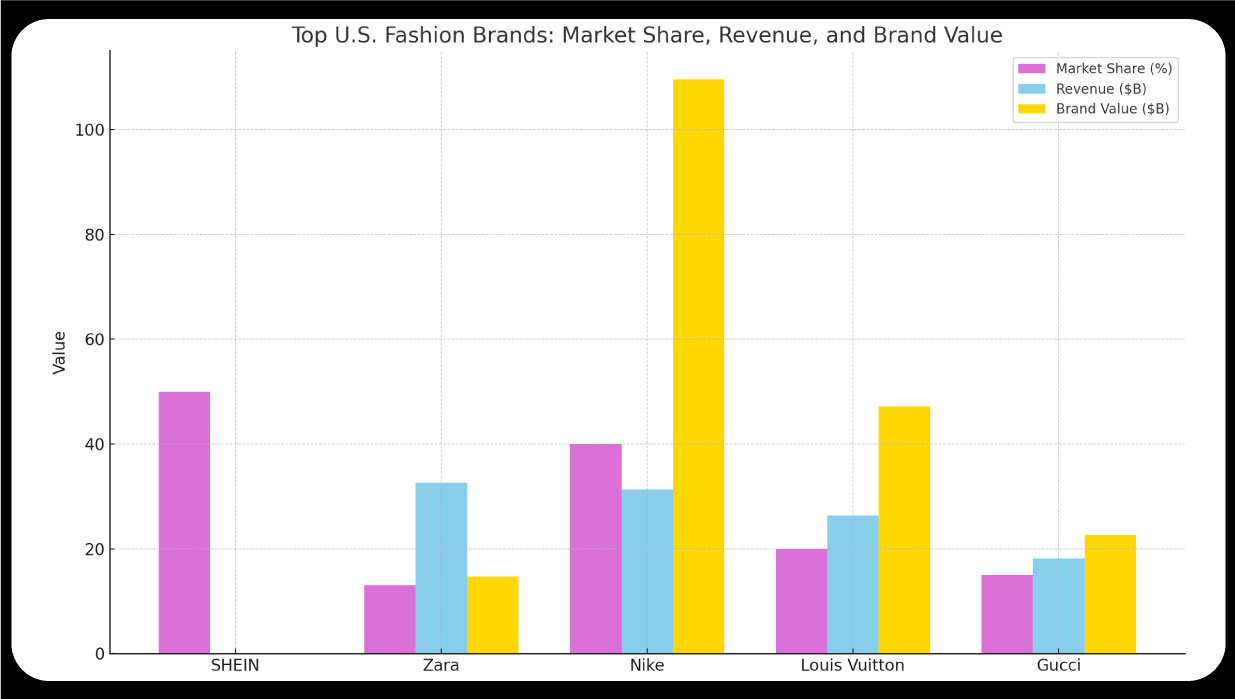
Among the thousands of brands, a few stand out as dominant players based on market share, revenue, and consumer engagement. Scraping top-selling items from US clothing brands reveals SHEIN as the leading fast fashion brand in the USA, commanding a 50% market share in the fast fashion segment, a significant increase from 25% in 2020. Zara follows with a 13% share, while H&M and Uniqlo hold smaller portions at 10% and 8%, respectively. The eCommerce data intelligence services reveal that in the sportswear category, Nike dominates with a brand value of $109.6 billion and annual revenue of $31.3 billion, far surpassing Adidas ($13.79 billion). In luxury fashion, Louis Vuitton leads with a brand value of $47.2 billion, followed by Gucci ($22.6 billion) and The Row, which has gained traction for its minimalist designs.
Scrape women's fashion sales data from social media platforms like Instagram and TikTok to further reinforce SHEIN's dominance, with the brand being the most mentioned by influencers (39.7% of nano-influencer posts). Nike also ranks highly, particularly among Gen Z and Millennials, with a consideration score of 37.1% on YouGov's brand tracker. Leveraging ecommerce data scraping services , the data indicates that SHEIN's low pricing (average sale price of $15–$45) and rapid trend turnover (new collections every 13 days) drive its popularity. At the same time, Nike's substantial brand equity and innovation in sportswear maintain its lead.
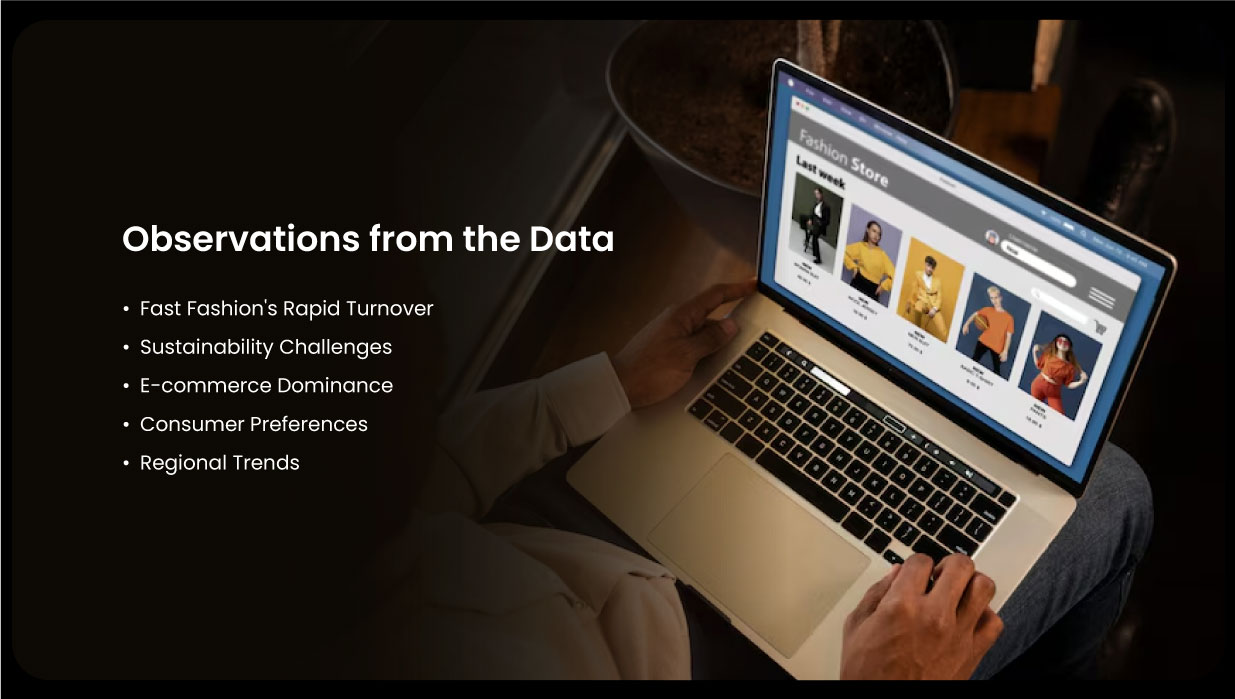
Several key observations emerge from the web-scraped data:
Table 2: Top Fashion Brands by Market Share and Revenue (2024)
| Brand | Segment | Market Share (%) | Revenue ($B) | Brand Value ($B) |
|---|---|---|---|---|
| SHEIN | Fast Fashion | 50% (Fast Fashion) | Not Public | Not Public |
| Zara | Fast Fashion | 13% (Fast Fashion) | 32.57 | 14.7 |
| Nike | Sportswear | 40% (Sportswear) | 31.3 | 109.6 |
| Louis Vuitton | Luxury | 20% (Luxury) | 26.3 | 47.2 |
| Gucci | Luxury | 15% (Luxury) | 18.1 | 22.6 |
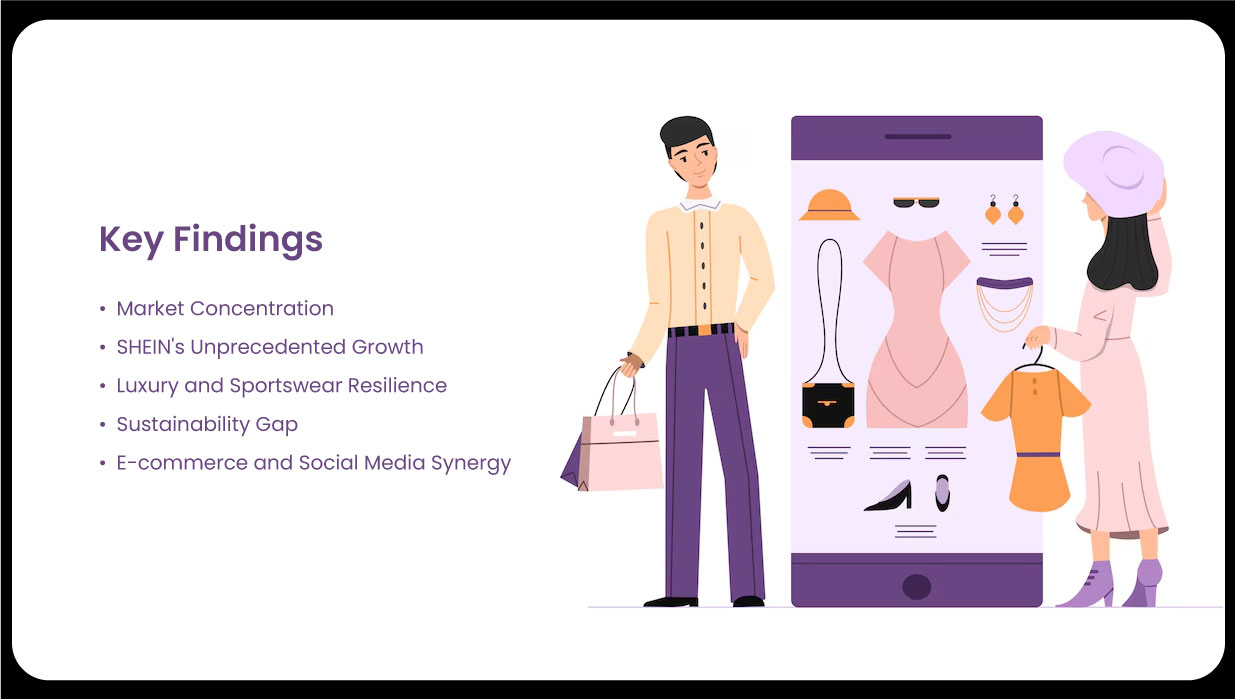
Brand Distribution by Segment
Top Brands by Market Share and Revenue
Web scraping has provided a detailed snapshot of the US fashion industry, revealing a highly competitive market dominated by a few key players like SHEIN, Nike, and Louis Vuitton. The insights gained through data scraping from ecommerce website platforms highlight the rapid growth of fast fashion, the resilience of luxury and sportswear, and the growing but underaddressed demand for sustainability. Utilizing an e-commerce website scraper , businesses can efficiently gather critical market intelligence. Additionally, the ecommerce product ratings and review dataset offer valuable consumer satisfaction and preferences perspectives. As e-commerce and social media continue to shape consumer behavior, brands that leverage data-driven insights and align with sustainability trends will be best positioned for success in 2025 and beyond.
Experience top-notch web scraping service and mobile app scraping solutions with iWeb Data Scraping. Our skilled team excels in extracting various data sets, including retail store locations and beyond. Connect with us today to learn how our customized services can address your unique project needs, delivering the highest efficiency and dependability for all your data requirements.
We start by signing a Non-Disclosure Agreement (NDA) to protect your ideas.
Our team will analyze your needs to understand what you want.
You'll get a clear and detailed project outline showing how we'll work together.
We'll take care of the project, allowing you to focus on growing your business.