27K+
TOTAL REVIEWS
Amazon brand monitoring in action: see how a Sichuan pantry brand's pricing ladder, 8-category expansion, and $31 hot-sauce floor reveal a premium-defense playbook.
Effective Amazon brand monitoring answers a question every growth team eventually faces: as a brand expands into new categories, does it stay premium, or does it quietly slide into a price war it cannot win? We rebuilt a fast-growing pantry brand's storefront from public data to show how that question gets answered with evidence. If you grow, defend, or invest in consumer brands, this teardown is for you. It speaks directly to:
Fly By Jing is a case study in disciplined expansion. Founded and led by Jing Gao, the brand started with a single standout product — its Sichuan chili crisp — and has since grown into a broad pantry presence on Amazon. The interesting part is not that it expanded; plenty of brands do. It is that it expanded without abandoning its premium identity, and the data lets us prove that with numbers rather than narrative.
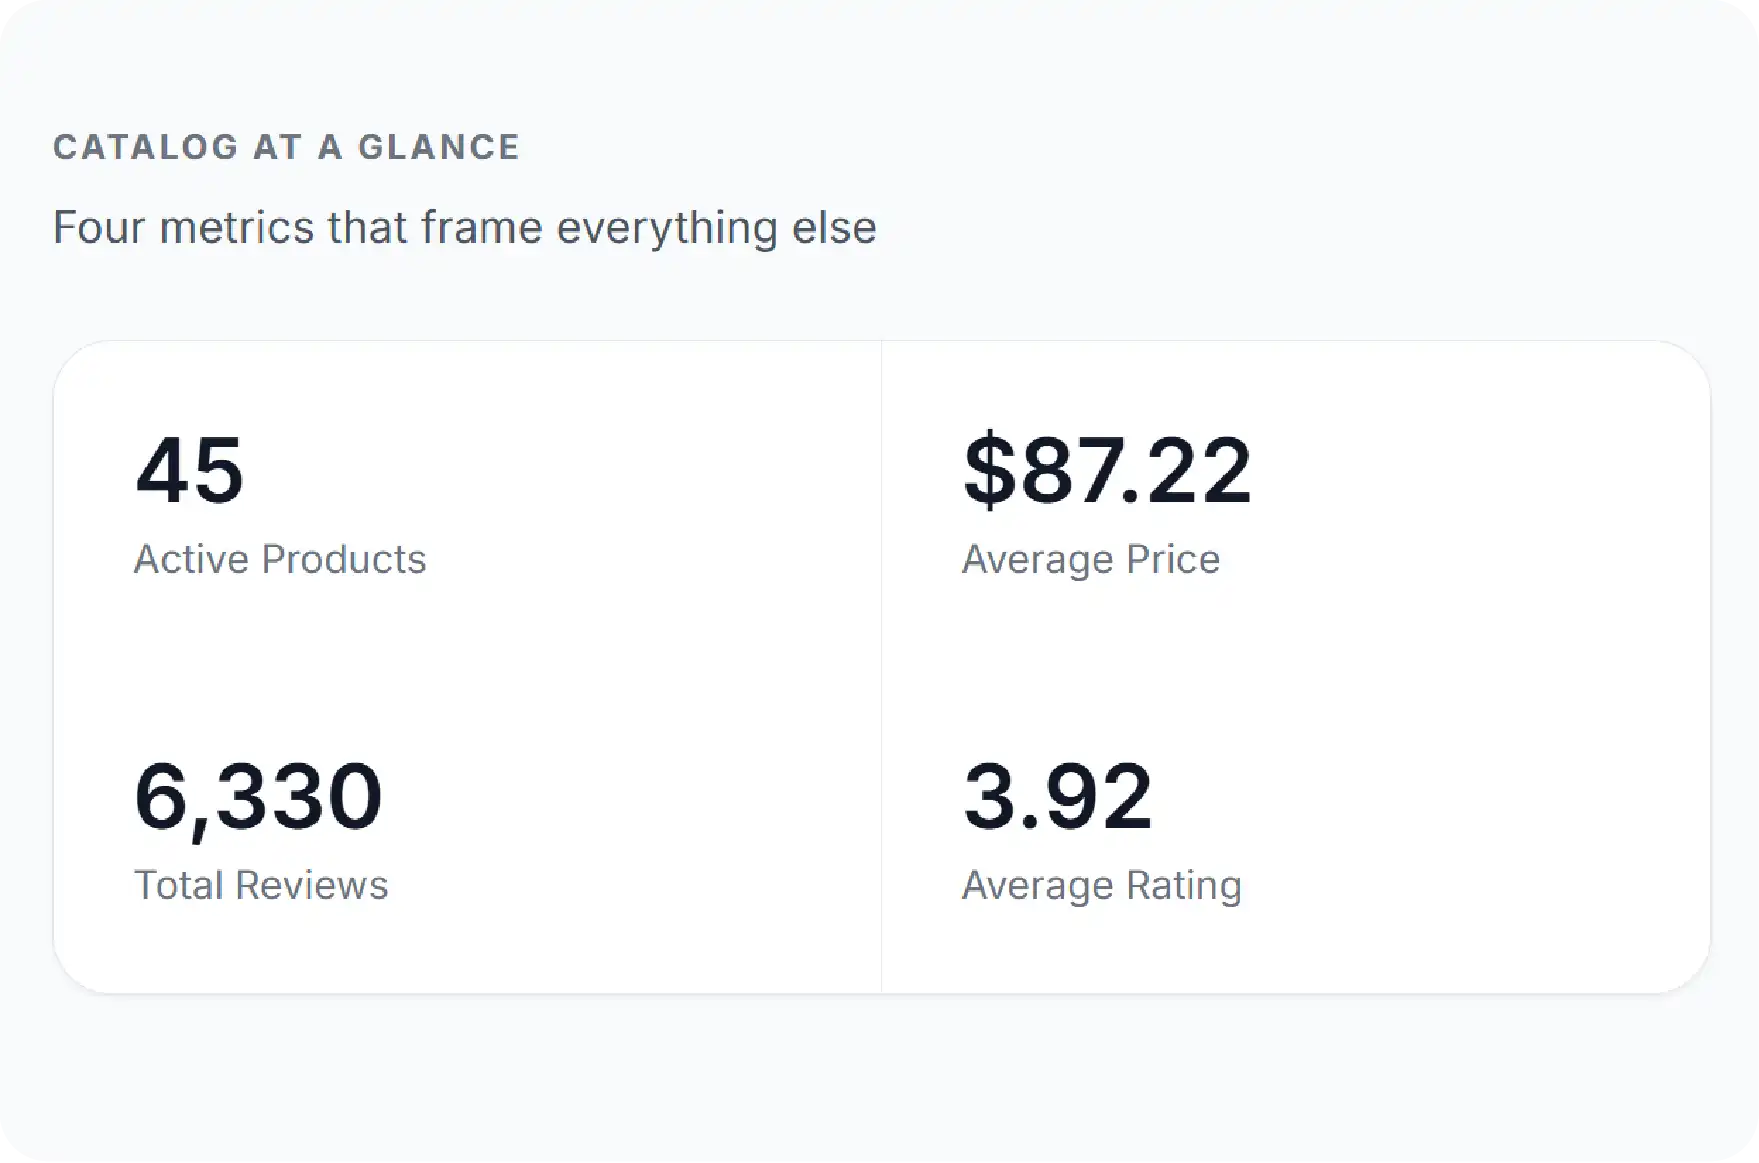
Working only from public marketplace data, we built a structured view of the brand's storefront as of February 2026: 29 unique listings, more than 27,000 cumulative reviews, and a blended rating of 4.27 stars. We then mapped how the pricing is engineered — a deliberate ladder from a $3 trial item to $40 premium bundles, with a $18.55 catalog average — and how the brand holds a high price floor in its core category even while selling budget-friendly noodles.
The defining pattern is the spread between categories: hot sauces average around $31 per unit while rice sits near $3, yet the brand refuses a race to the bottom despite six competing sellers. Conventional analysis reads this as simple multi-category pricing. Our unique angle reads it differently: the premium hero category functions as a price anchor that protects the entire catalog, and watching that anchor over time is one of the clearest early-warning signals of brand health. This report walks through six findings and what the same approach reveals about any brand you track.
Reading one product page once is easy. Monitoring an entire brand's storefront repeatedly, accurately, and over time is a different problem — and it is where most internal tracking efforts collapse. The marketplace is built to resist collection at scale, and brand monitoring multiplies that difficulty because it depends on consistency across many captures, not a single snapshot.
First, retailers actively defend against automated access with rate limits, rotating layouts, bot detection, and CAPTCHAs that break naive scrapers. Second, a brand's pricing is not one fixed number; it moves by the minute and varies across thousands of zip codes, Buy Box winners, coupons, and subscription offers — and an inconsistent capture window quietly corrupts your trend line. Third, the underlying HTML changes constantly, so a selector that worked last week silently returns blanks this week, and the failure is invisible until someone audits the totals.
There is also a structural trap most teams never notice. Amazon groups size, flavor, and bundle options under a parent listing, and reviews are frequently pooled across that family. Count inconsistently from one week to the next and you will see phantom growth or decline that never happened. Reliable tracking is therefore less about writing a script and more about maintaining a resilient, consistent pipeline.
Before the findings, it is worth being honest about the build-versus-partner decision. Here is how a do-it-yourself brand monitoring stack typically compares with a managed service across the dimensions that decide whether the tracking is trustworthy over time.
| Dimension | DIY Monitoring | iWeb Data Scraping |
|---|---|---|
| Setup time | Weeks of engineering before the first clean capture | Live within days, scoped to your brand |
| Anti-bot handling | Constant firefighting against blocks and CAPTCHAs | Managed proxy and detection layer, handled for you |
| Capture consistency | Drifting capture windows corrupt the trend line | Scheduled, consistent snapshots for true trends |
| Variation logic | Reviews easily miscounted across bundles | Parent-child mapping resolved explicitly |
| Price freshness | Stale snapshots between manual runs | Refreshed at your chosen cadence, timestamped |
| Maintenance | Breaks whenever the site layout changes | Pipeline upkeep included, zero overhead |
| Total cost | Hidden in engineering hours and rework | Predictable, decision-ready deliverable |
Values shown are illustrative samples; a live project reflects current marketplace data.
Fly By Jing built its identity on one unmistakable product: a Sichuan chili crisp with a distinctive flavor that gave the brand a clear point of difference in a crowded condiment aisle. Founder and CEO Jing Gao turned that single hero into a recognizable brand, and that recognition became the platform for everything that followed.
What makes Fly By Jing an ideal teaching case is that the entire expansion is publicly observable. The categories entered, the prices set, the reviews earned, and the sellers competing all sit in plain sight. A brand that tracks these signals over time can tell the difference between healthy growth and the slow erosion of a premium position — long before either shows up in a quarterly report.
We approached Fly By Jing's storefront the way we approach any brand monitoring engagement: as a structured, repeatable collection problem with a verification layer on top. The deliverable was never a pile of HTML — it was a clean baseline a strategist could trust and then watch over time.
We enumerated every live listing tied to the brand, capturing ASIN, title, category, listing price, star rating, and review count for each. We then resolved the parent-child relationships so a bundle or size variation was never mistaken for a standalone product and pooled reviews were flagged rather than double-counted — the difference between a real trend and a phantom one. Prices were captured with timestamps so each snapshot is a defensible point-in-time view that can be compared like-for-like in the next capture.
Every record passed through validation: empty fields were re-fetched instead of accepted as zeros, outliers were checked against the live page, and duplicates were collapsed. Only then did we analyze — review concentration, rating consistency, the price ladder, category spread, and the premium-floor pattern that closes this report. A trend line is only as honest as the captures beneath it.
Across its 29 listings, Fly By Jing has accumulated more than 27,000 customer reviews at a blended 4.27-star rating. For a brand that started with one product and is still relatively young in most of its categories, that combination of volume and quality is a meaningful loyalty signal. On a marketplace where social proof drives both conversion and rank, a 4.27 average across thousands of reviews tells a shopper the brand reliably delivers.
For tracking purposes, the value is not the headline number but the trajectory beneath it. A review base growing steadily while the rating holds is the clearest sign that expansion is working without straining quality. The moment review growth slows or the rating dips, a consistent capture catches it early — which is why the structure of that 27,000 matters more than the total, as the next finding shows.
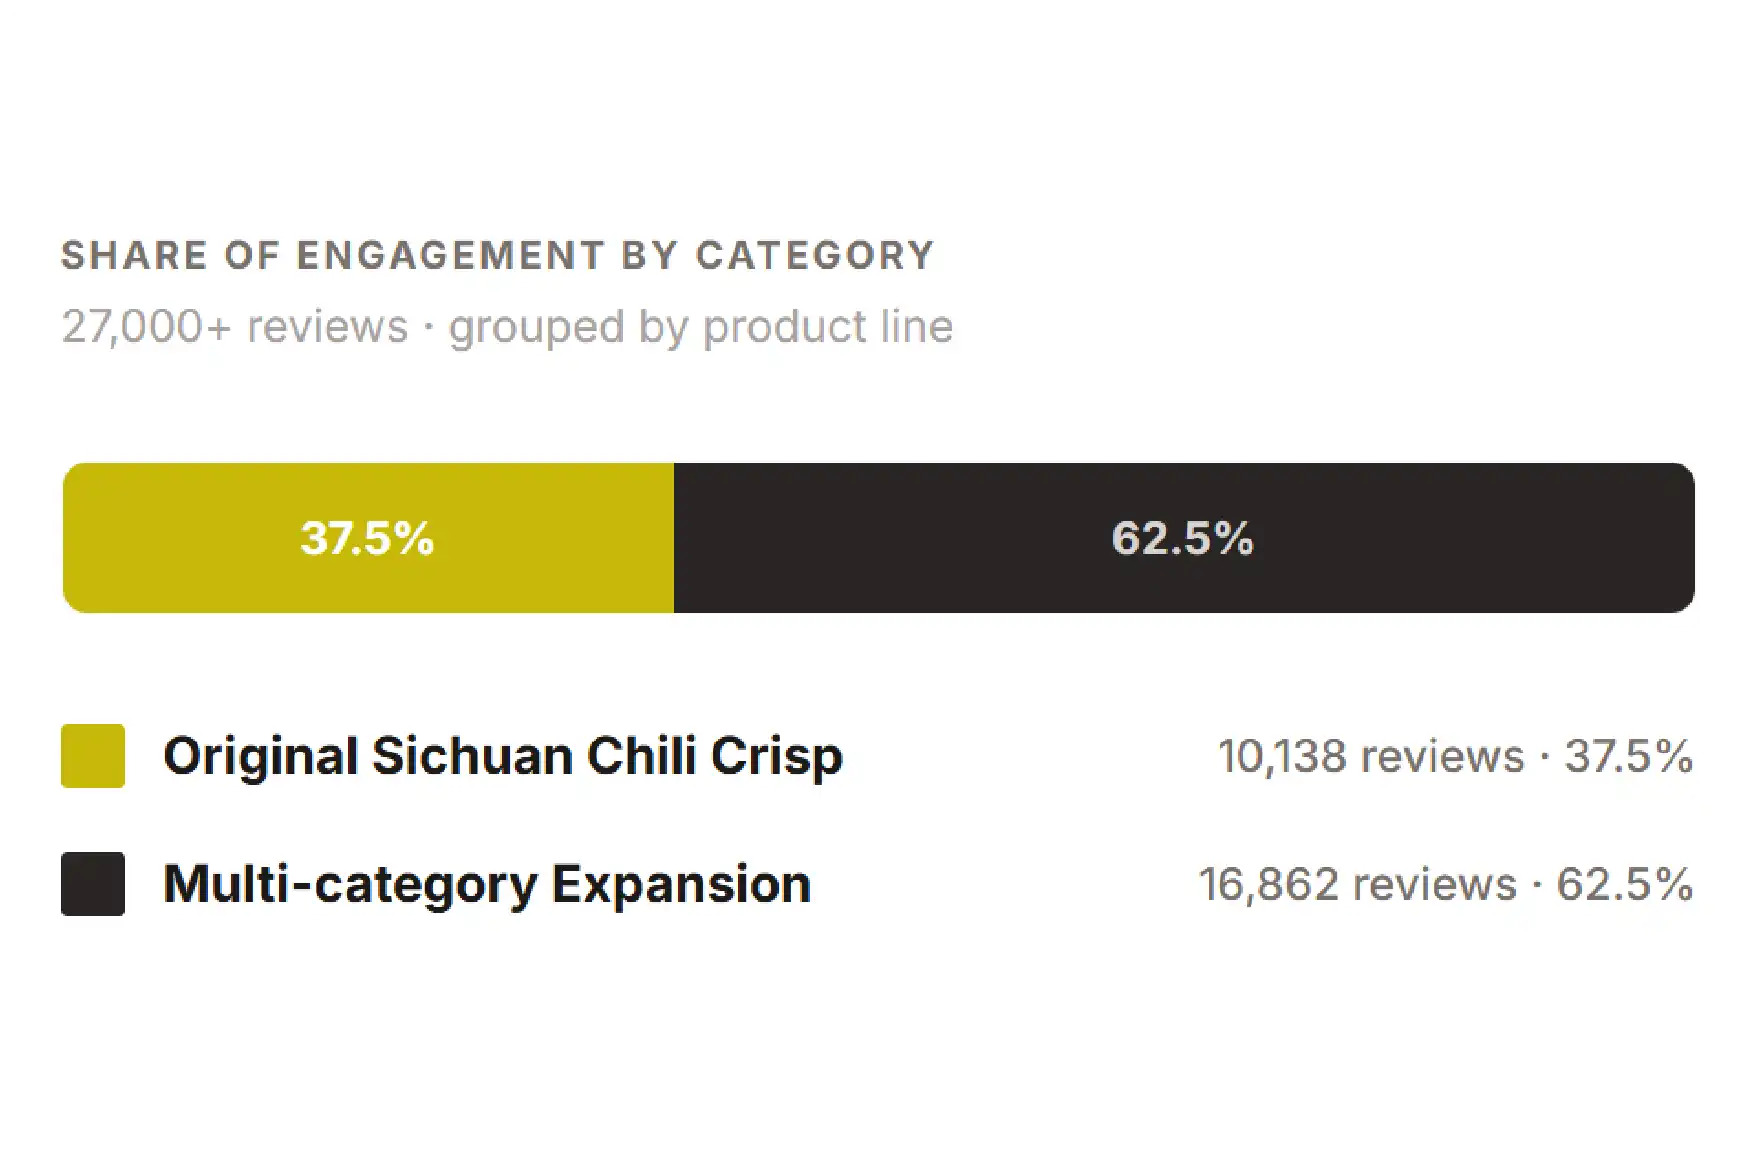
The single most revealing signal in the dataset is how much of the brand's social proof still flows from its original product. The Original Sichuan Chili Crisp holds 10,138 reviews — well over a third of the brand's entire 27,000-plus total, concentrated in one listing. Years into a multi-category expansion, the founding hero is still the gravitational center of the catalog.
For ongoing tracking, this concentration is a double-edged signal. On one hand, it confirms the hero remains a powerful, trusted anchor that lends credibility to everything launched around it. On the other, it means the brand's reputation is still heavily dependent on a single product, so any disruption to that listing would ripple across the whole storefront. Tracking the share of total reviews held by the hero over time is one of the cleanest ways to measure whether the expansion is genuinely building independent demand or simply borrowing the hero's halo.
MONITOR YOUR OWN BRAND THIS CLOSELY
Picture this same review-share and pricing view for your brand, refreshed every week. iWeb Data Scraping can deliver continuous Amazon brand monitoring across your full catalog. Email info@iwebdatascraping.com to scope it.
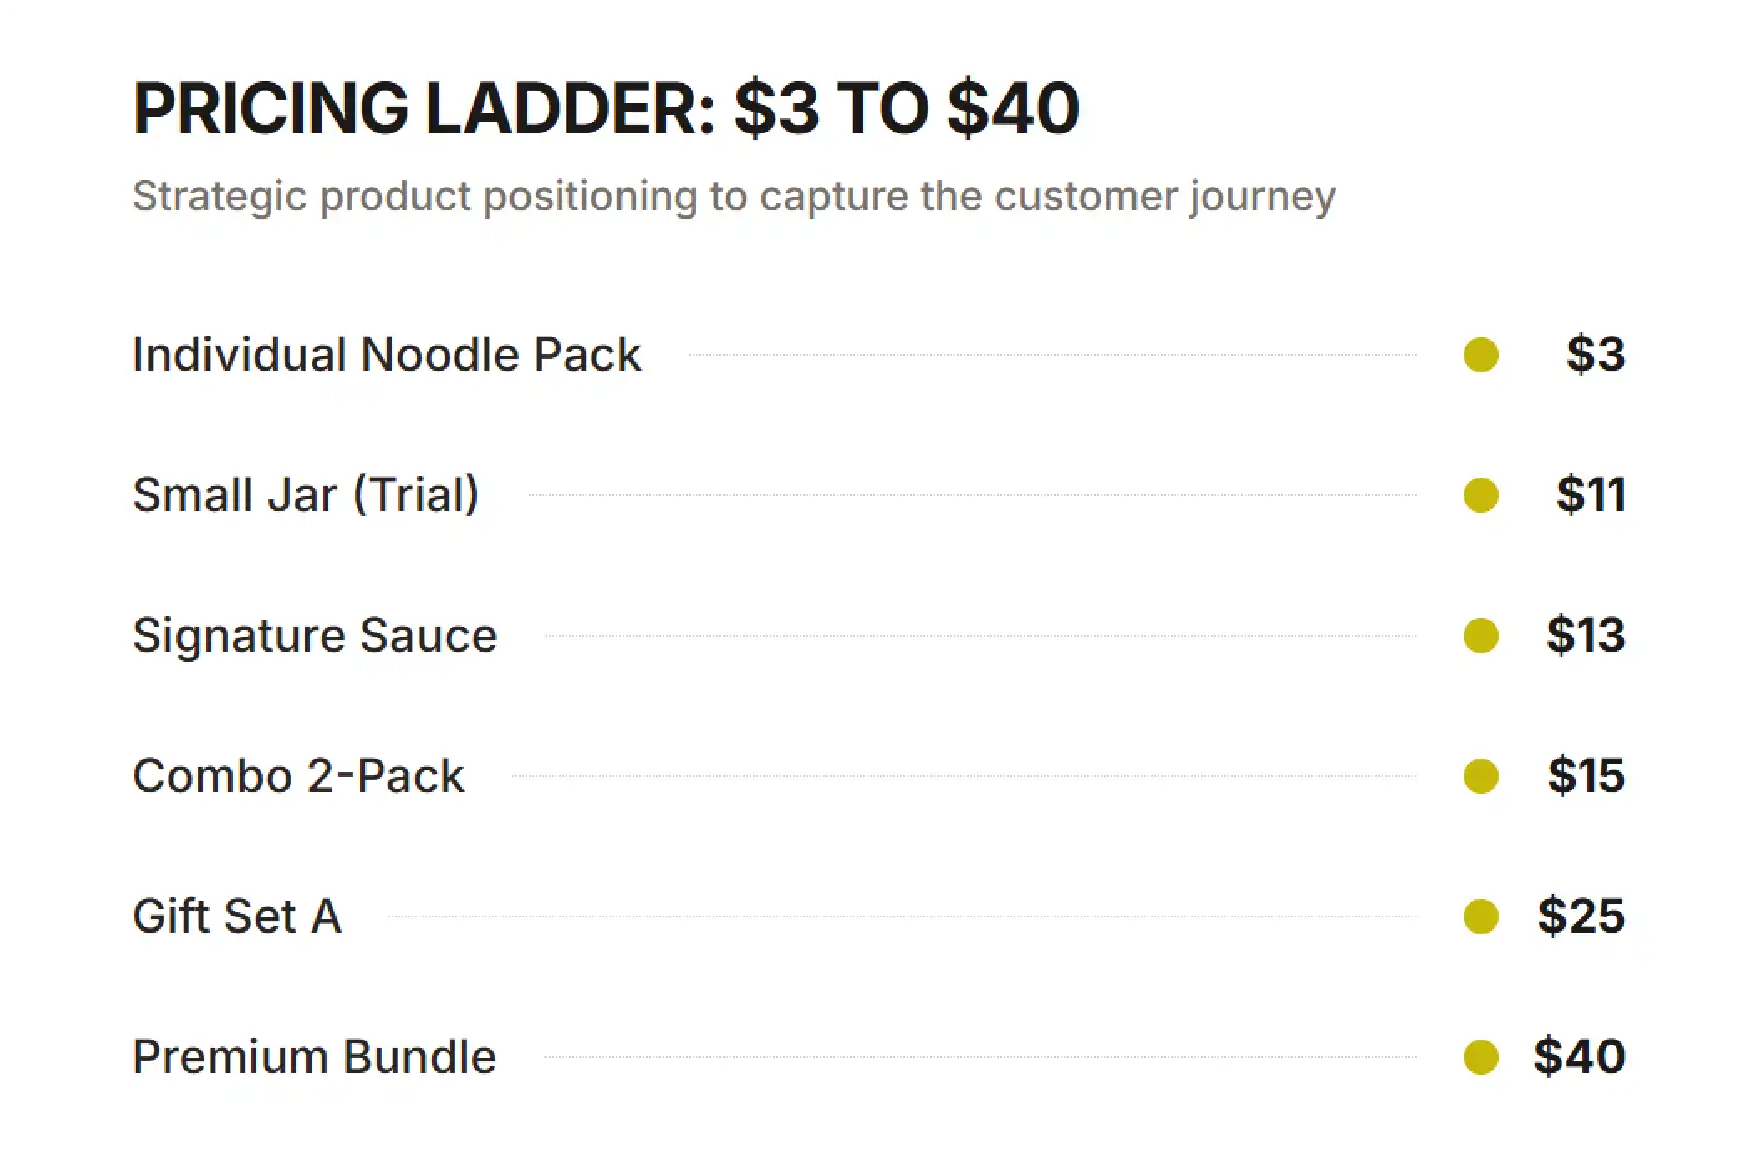
Fly By Jing's pricing is not a scatter of numbers; it is a deliberate ladder. It runs from a $3 entry item — an individual noodle pack — up to $40 premium bundles, with a blended catalog average of $18.55. The center of gravity sits in the middle: ten products are priced in the $10 to $20 bucket, the everyday sweet spot where most repeat purchases happen.
What gives the ladder away as engineered rather than accidental is the repetition. Seven different products are priced at exactly $11, $13, or $15 — clean, deliberate price points chosen to occupy specific rungs rather than land wherever cost-plus math happened to fall. That is the fingerprint of a brand thinking in terms of a customer journey: a $3 trial to lower the barrier, a cluster of mid-teens products to capture the converted buyer, and $40 bundles to reward the loyalist. The blended $18.55 is the number to watch — if it drifts downward over time, the brand is sliding toward commodity pricing whether it intends to or not.
The most visible part of Fly By Jing's strategy is the breadth of its expansion. The catalog now spans eight distinct categories, reaching far past its chili-oil roots. Eleven listings remain in chili sauces — the brand's stronghold — while the rest stake claims in adjacent aisles.
| Category | Role | Avg Price | Strategic Read |
|---|---|---|---|
| Hot Sauces | Core stronghold (11 listings) | ~$31 | Premium identity, high floor |
| Noodles | Volume driver | ~$23 | Accessible entry into meals |
| Rice / Udon | Pantry expansion | from $3 | Reach and basket size |
| Ground Pepper | Adjacent flavor play | mid-range | Extends the flavor brand |
| Salad Dressings | New occasion | ~$11 | Everyday-use foothold |
Reading the categories together reveals the logic: rather than spreading thin, Fly By Jing extended outward from its core flavor identity into related products a chili-crisp fan would plausibly buy. Each new aisle is a chance to win more of the same customer's pantry — and the category map is the scorecard for that strategy, showing at a glance which aisles the brand has genuinely entered and how each is priced relative to home turf.
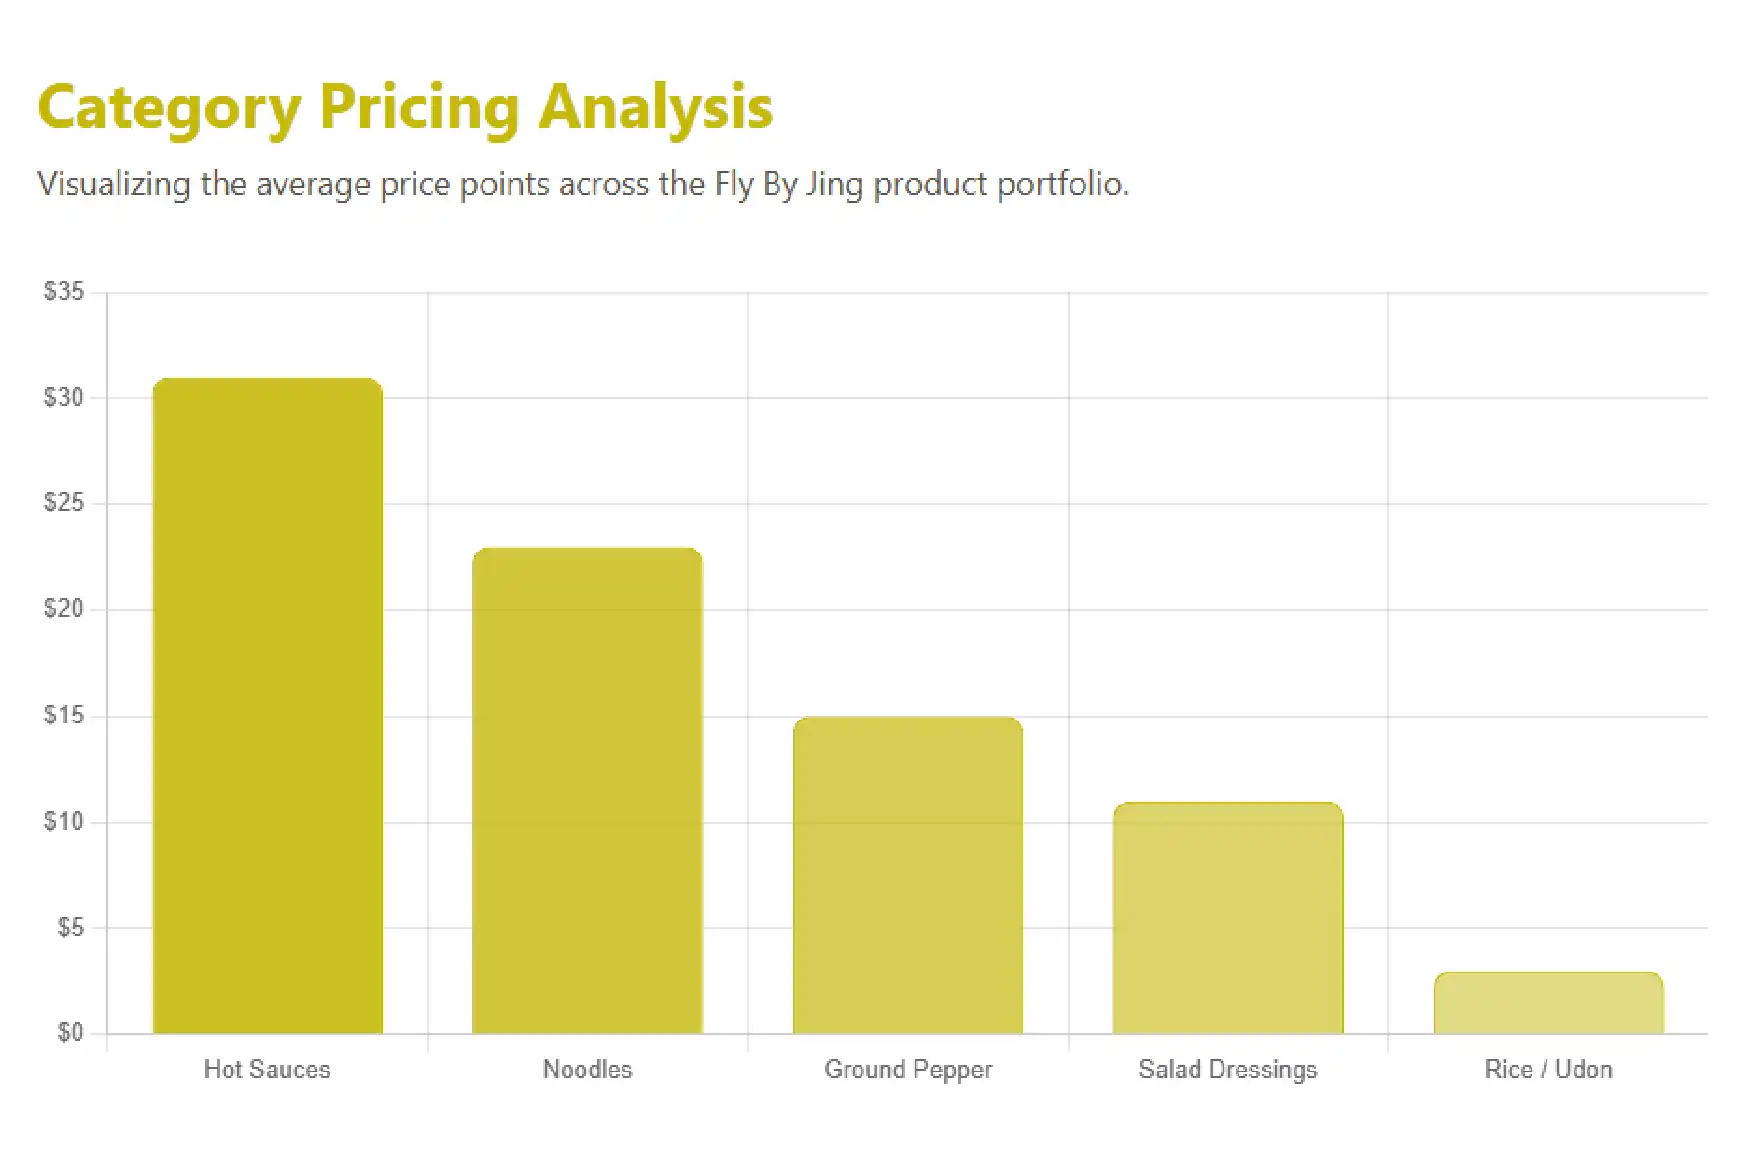
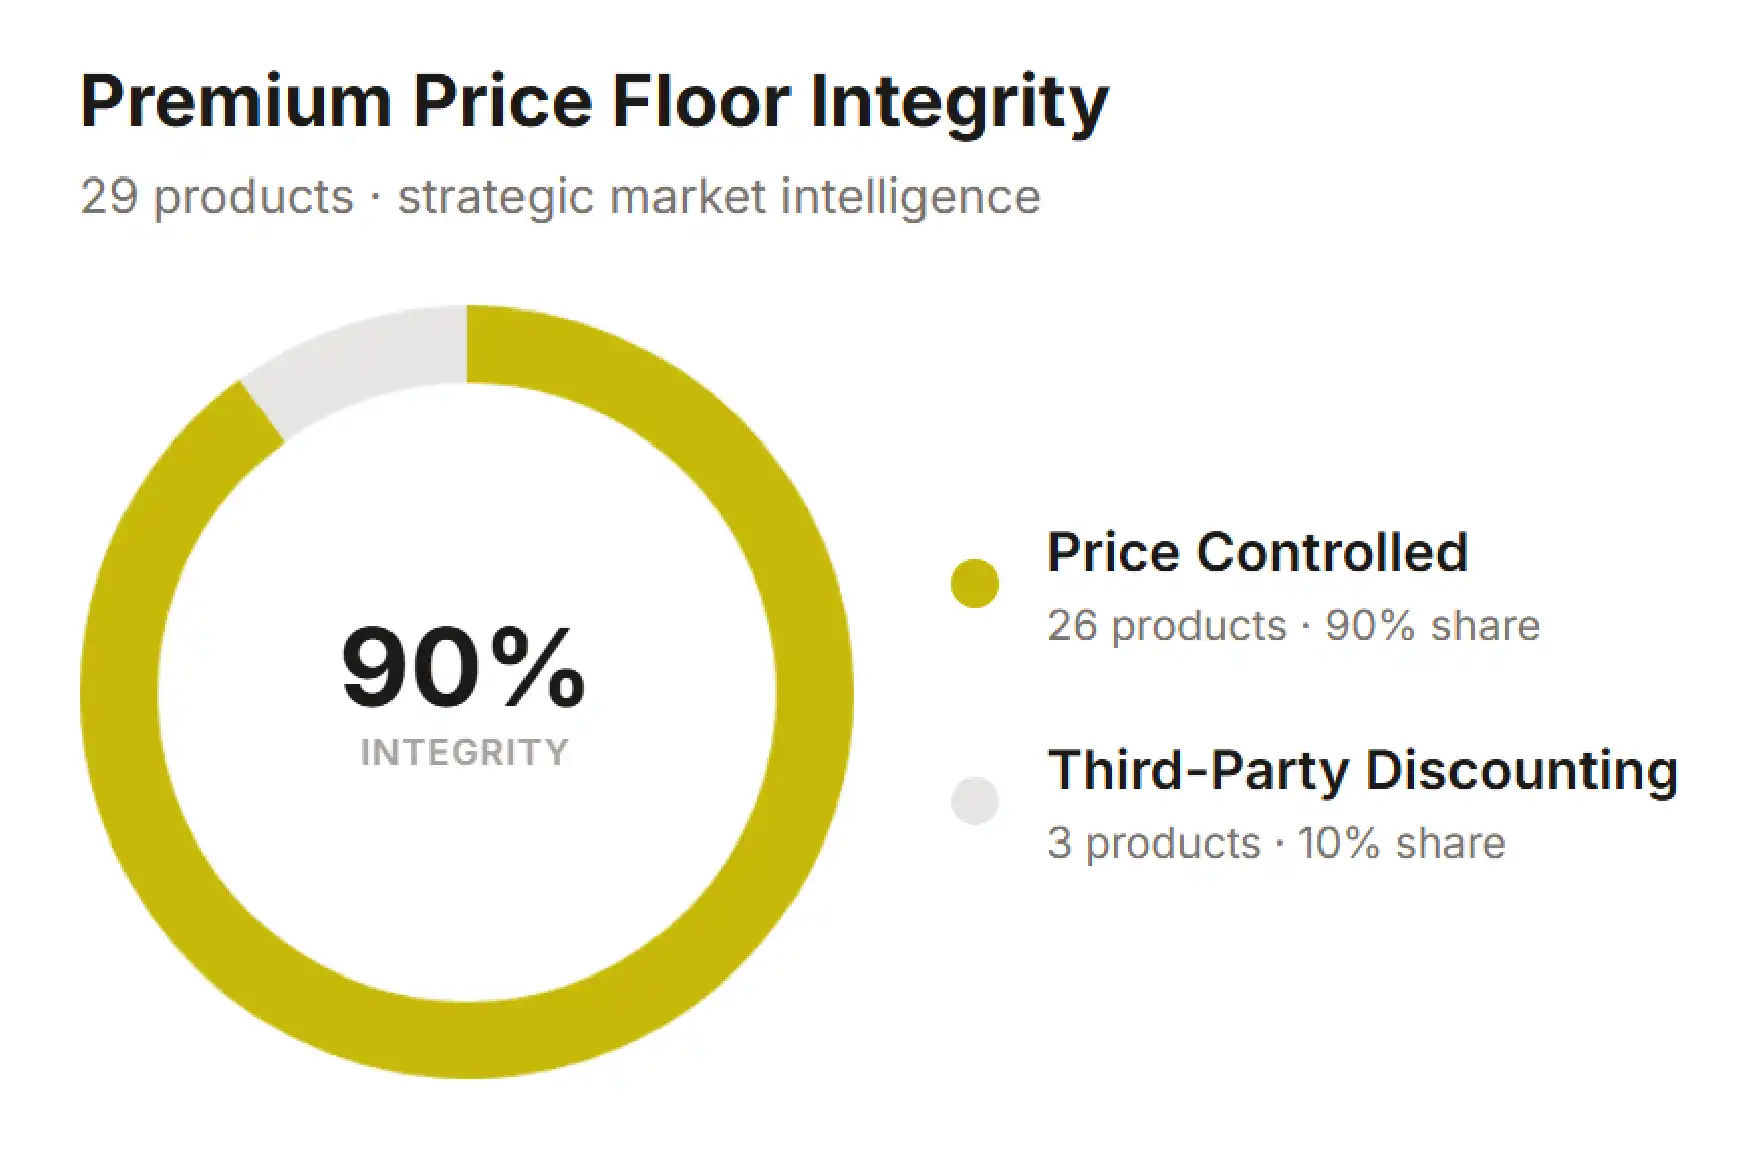
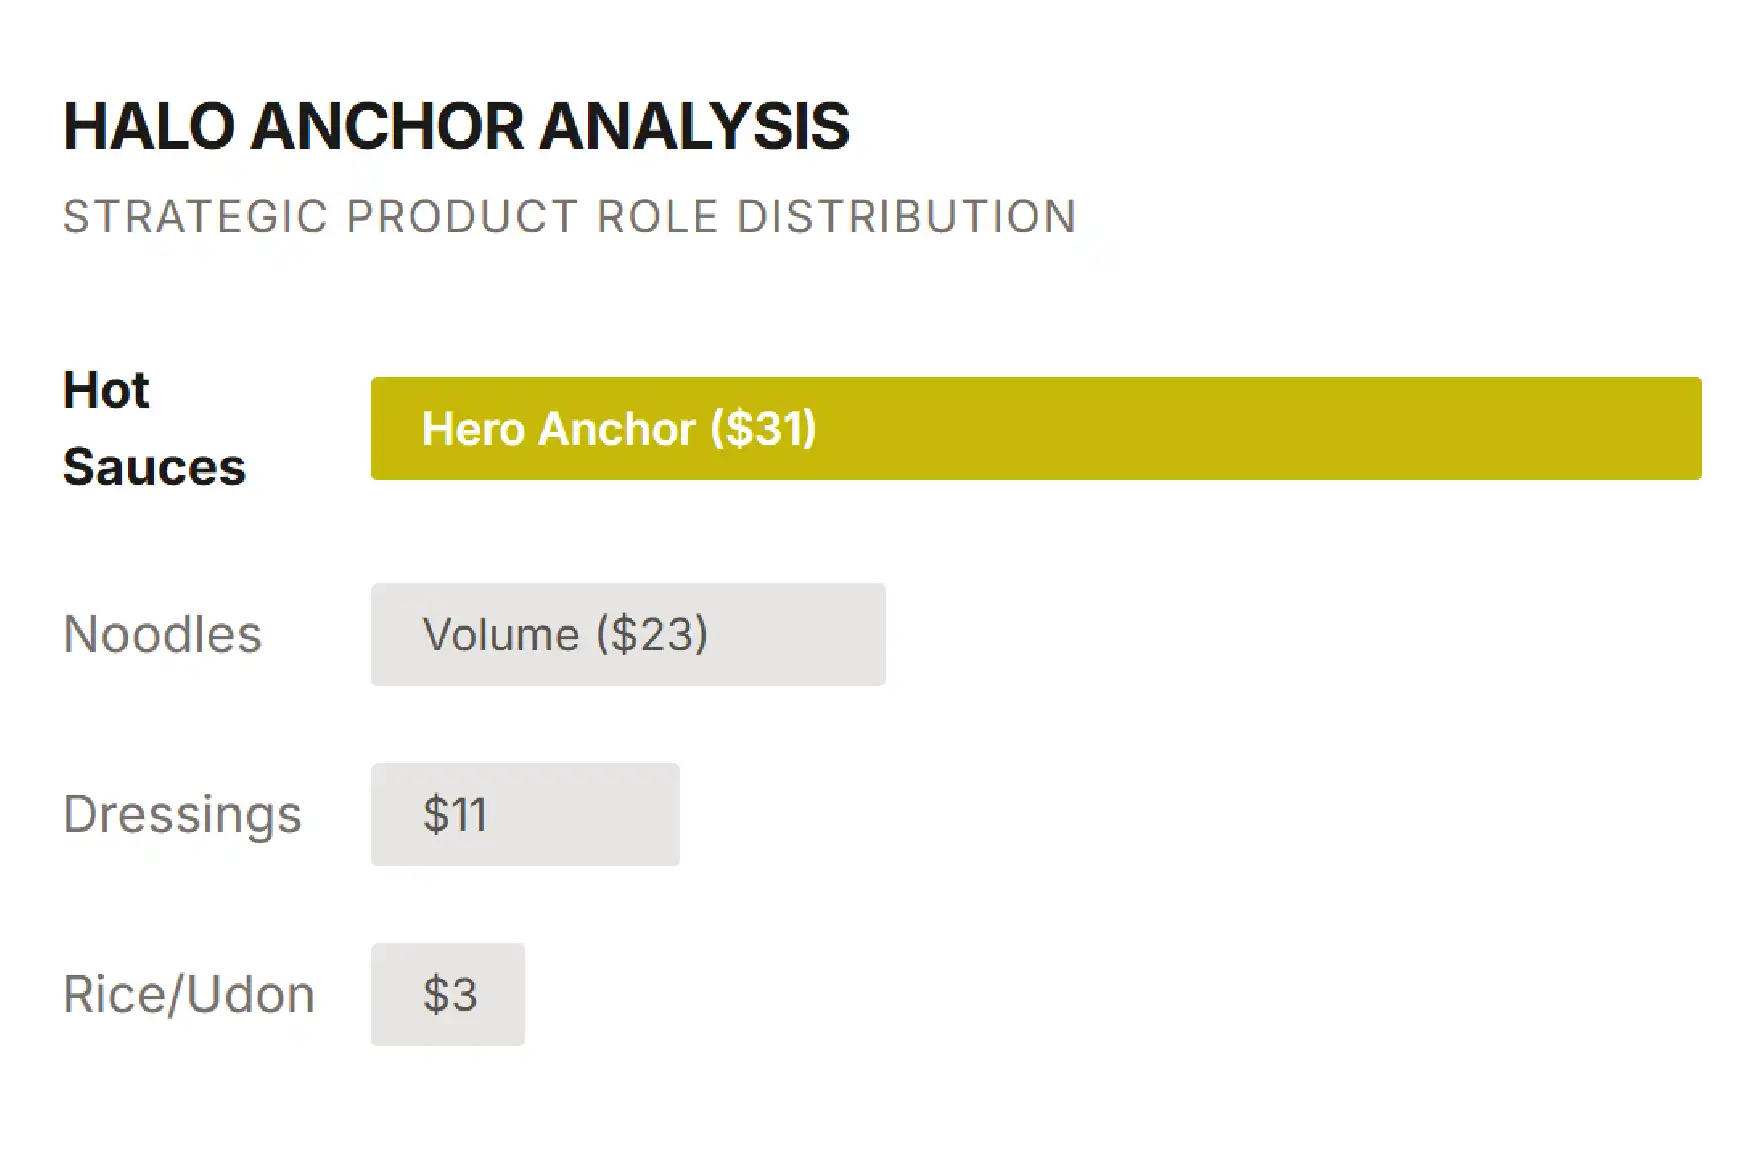
The pricing across categories is where the brand's discipline shows most clearly. Hot sauces lead at roughly $31 per unit, noodles command around $23, while rice sits near $3 and salad dressings near $11. The hot-sauce price is nearly triple the rice and more than double the dressings — a spread that is deliberate, not accidental.
What makes this notable is the resilience behind it. Across 29 listings sold by six specialized retailers, Fly By Jing holds that high ~$31 average in hot sauce rather than discounting to fend off competition. Many brands, faced with multiple third-party sellers, drift into a race to the bottom that quietly destroys margin and perception alike. This brand does the opposite: it maintains a firm price floor on its core category and lets the cheaper pantry items do the volume work. Tracking that floor over time is the single best gauge of whether the premium positioning is intact or eroding.
THE COMPETITIVE REALITY
A price floor erodes quietly. By the time discounting shows up in revenue, the premium perception is already damaged. Continuous monitoring catches the first crack — the week without a structured view is the week the slide begins unnoticed.
Here is the angle the surface-level breakdown never reaches. The obvious reading of the $31 hot-sauce floor is that sauces simply carry good margins. We read it as something more strategic: the premium hero category is not just earning money, it is doing brand work for every other product on the shelf. It is a halo anchor.
Consider how a shopper experiences the catalog. They meet Fly By Jing through a $31 artisan chili sauce that signals craft and premium quality. When that same shopper then sees a $3 noodle pack or an $11 dressing under the identical brand, they do not read those items as cheap — they read them as accessible value from a premium brand. The high floor reframes the budget items as a deal rather than a discount. Drop the sauce price to compete, and you do not just lose sauce margin; you quietly collapse the premium frame that makes the entire pantry line feel worth buying. The cross-subsidy runs through perception, not just the income statement.
This is precisely why the pattern shows up only in a tracked series of captures, not a one-time snapshot. A single capture shows the prices; a series shows whether the relationship between them holds or breaks. If the hot-sauce floor starts slipping while the cheap items stay flat, that is an early warning that the brand is trading premium identity for short-term volume — a decision made one small discount at a time, invisible until you watch the floor as a deliberate metric. The lesson for any expanding brand: identify which product anchors your premium perception, then watch its price as if your whole catalog depends on it, because it quietly does.
Below is a representative slice of the structured dataset behind this brand monitoring report. Each record is the kind of clean, comparable row our pipeline delivers — and reading the Category and Price columns together is what makes the halo-anchor pattern in Finding 6 visible.
| ASIN | Product | Category | Price | Rating | Reviews | Tier |
|---|---|---|---|---|---|---|
| B07CHIxxxx | Original Sichuan Chili Crisp | Hot Sauce | $31.00 | 4.5 | 10,138 | Hero |
| B08SAUxxxx | Zhong Sauce — Dumpling Sauce | Hot Sauce | $29.50 | 4.4 | 2,140 | Core |
| B09NOOxxxx | Sichuan Noodles — Classic (Single) | Noodles | $3.00 | 4.2 | 1,860 | Entry |
| B08NDLxxxx | Sichuan Noodles — Multipack | Noodles | $23.00 | 4.3 | 3,275 | Mid |
| B0ARICxxxx | Triple Threat Rice | Rice / Udon | $11.00 | 4.1 | 742 | New |
| B0DRESxxxx | Sichuan Salad Dressing | Salad Dressing | $13.00 | 4.2 | 508 | New |
| B0BNDLxxxx | Pantry Essentials Bundle | Bundle | $40.00 | 4.6 | 1,190 | Premium |
ASINs shown are illustrative placeholders; values reflect the structure and scale captured during analysis.
The point of brand monitoring is never the spreadsheet — it is the moves the spreadsheet makes possible. The six findings translate directly into actions a brand or an analyst can take this quarter.
None of these moves require insider information — only the discipline to collect public signals consistently and read them honestly. That is the difference between managing a brand on evidence and managing it on hope.
We exist to remove the hardest part of brand monitoring: the pipeline. Our clients do not maintain scrapers, fight CAPTCHAs, or wonder whether a blank cell is a real zero or a silent failure. They receive clean, validated, decision-ready intelligence on a schedule that fits their planning cycle — captured consistently enough to trust the trend, not just the snapshot.
That means resolved parent-child variation mapping so review counts are never over- or under-stated, timestamped pricing so your snapshots compare like-for-like, and quality assurance on every record so the analysis rests on data you can act on. Whether you need a one-time teardown like this one or continuous Amazon brand monitoring across an entire catalog, the infrastructure headache is ours, and the decisions are yours.
Want to see what this looks like for your category? We will pull a structured 50-product dataset at no cost.
Email info@iwebdatascraping.com with the subject line “Sample Dataset” and tell us the brand or category to analyze.
Start a projectCollecting publicly available product information — prices, ratings, review counts, and listing details — is a widely used practice for competitive and market research. We focus exclusively on public data, follow responsible collection practices, and never touch private or personal information. We are happy to discuss the specifics of your use case.
As often as your decisions require. Because prices and availability shift constantly, we schedule collection at the cadence that fits you — daily, weekly, or on demand — and timestamp every record so your trend line compares like-for-like across captures.
This is one of the most common places DIY monitoring goes wrong. We resolve parent-child listing relationships explicitly, so a bundle or size variation is never counted as an independent product and pooled reviews are flagged rather than double-counted. That is what keeps a trend honest over time.
Yes. While this case study focuses on Amazon, the same approach applies to Target, Walmart, and other major retailers, as well as cross-retailer comparisons. If your category lives across multiple storefronts, we can give you one unified view.
Clean, structured files ready for analysis — typically spreadsheets or a feed into your existing tools. The deliverable is built so a strategist can use it immediately, without a data-engineering step in between.
It depends on the number of products, the refresh frequency, and the retailers involved. We scope each engagement to your needs and pricing is predictable — no hidden engineering hours. Reach out for a quote tailored to your category.