
12
PRODUCTS · 6 CATEGORIES

Amazon product data scraping case study — inside Art of Sport’s focused 12-SKU strategy: the pricing ladder, ingredient anchor, and ad playbook.
If you make decisions about pricing, assortment, distribution, or competitive positioning on Amazon, this case study is written for you. It is built specifically for:
If your role touches any of the above, the rest of this page shows exactly how iWeb Data Scraping delivers the numbers behind those decisions — and how you can request a working sample to evaluate the output yourself.
When a personal care brand like Art of Sport competes on Amazon, success is rarely about catalog size. It is about the discipline to launch only the products that genuinely belong, price them where real shoppers will pick them up, and reinforce them with a tight ingredient story and smart ad spend. The challenge for competing brands and category managers is simple: that discipline is almost invisible from the outside. Reviews, prices, sellers, and ad placements are scattered across dozens of pages and change by the minute.
This Amazon data scraping case study shows how iWeb Data Scraping converted Art of Sport’s fragmented Amazon listings into one clean, structured dataset — and how that dataset revealed exactly how the brand built athlete trust with just 12 products. The analysis surfaced the brand’s focus-first catalog strategy, its accessible price ladder, its anchor ingredient, its seller mix, and its deliberate use of sponsored ads. More importantly, it produced a repeatable model: any brand can use the same web scraping approach to benchmark competitors, refine pricing, and protect market share with evidence instead of guesswork.
Most brands already suspect what they need to know about a competitor. They rarely have the evidence to act on it. Amazon product pages publicly display price, reviews, ratings, sellers, and ad indicators, but that information is fragmented across thousands of URLs, refreshes by the minute, and is actively defended against automated collection.
Anyone who has tried to build a competitor dataset by hand knows the friction. Prices shift across regions and thousands of zip codes. Listings appear, sell out, and disappear without notice. Raw HTML is messy and inconsistent from one page template to the next. A scraper that worked perfectly yesterday can break overnight after a quiet layout change, and nobody notices until the numbers are already wrong.
The cost of this is not only wasted time. Decisions built on stale or incomplete numbers — a price change, a distribution audit, a new product launch, an investor pitch — carry real financial risk. Reliable Amazon data scraping exists precisely to remove that risk. It replaces best guesses with a verified ground truth that refreshes on a schedule the business controls, so the picture is never out of date when a decision has to be made.
Most teams attempt some version of retail data collection in-house before partnering with a specialist. The comparison below sets out where the practical differences land:
| Capability | Building it In-House | iWeb Data Scraping |
|---|---|---|
| Setup time | 4–12 weeks of engineering | 48–72 hours to first dataset |
| Anti-bot handling | Frequent blocks, IP bans, CAPTCHAs | Managed proxy & rotation infrastructure |
| Layout-change breakage | Silent failures, stale data | Monitored pipelines with auto-alerts |
| Data validation | Manual spot-checks, inconsistent | Automated dedup & validation rules |
| Refresh cadence | Whatever the team can keep up with | Hourly, daily, or custom — client-defined |
| Output format | Raw HTML or messy exports | Analysis-ready CSV, JSON, API, or DB |
| Total ownership cost | Engineering salaries + infrastructure | Predictable per-project pricing |
The cost calculation is almost never about scraper code. It is about the months of engineering time, the silent failures nobody catches, and the decisions made on stale data because the in-house pipeline broke last Thursday.
Art of Sport built its reputation on a single clear idea — personal care designed specifically for athletes’ bodies. While most personal care brands chase volume by flooding Amazon with dozens of variants and bundles, Art of Sport went the other way. The brand kept its catalog small, intentional, and built around products an athlete would genuinely reach for after a workout.
For this case study, iWeb Data Scraping treated Art of Sport as a live example of a focus-over-volume DTC strategy operating in one of Amazon’s most crowded aisles and asked one straightforward question: if a competitor wanted to understand exactly how Art of Sport wins with just 12 products, what would the data have to show them? Answering that required far more than a product list. It required structured eCommerce data covering pricing, review depth, ingredient repetition across the lineup, seller distribution, and sponsored ad placement — the same signals a strategy team studies before entering or defending a category.
iWeb Data Scraping approached the project the way it approaches every retail intelligence engagement — define the questions first, then build the dataset to answer them. The team began by identifying every active Art of Sport listing on Amazon, then extracted a consistent set of fields from each one.
For every product, the Amazon data scraping pipeline captured the product title, ASIN, category, key ingredient, current price, star rating, total review count, seller name, fulfilment indicator, and whether the placement was organic or sponsored. Because Amazon prices, sellers, and ad placements move continuously, collection was scheduled to refresh on a fixed cadence rather than captured once — a single snapshot would have been outdated within hours.
Every record then passed through validation rules that flagged missing fields, impossible values, and duplicate listings before anything reached the final dataset. This is the step that separates dependable retail data from a noisy export. The output was not raw HTML or a pile of screenshots. It was a clean, analysis-ready table — the kind of product data extraction result a pricing analyst or category manager can open and use the same day it lands.
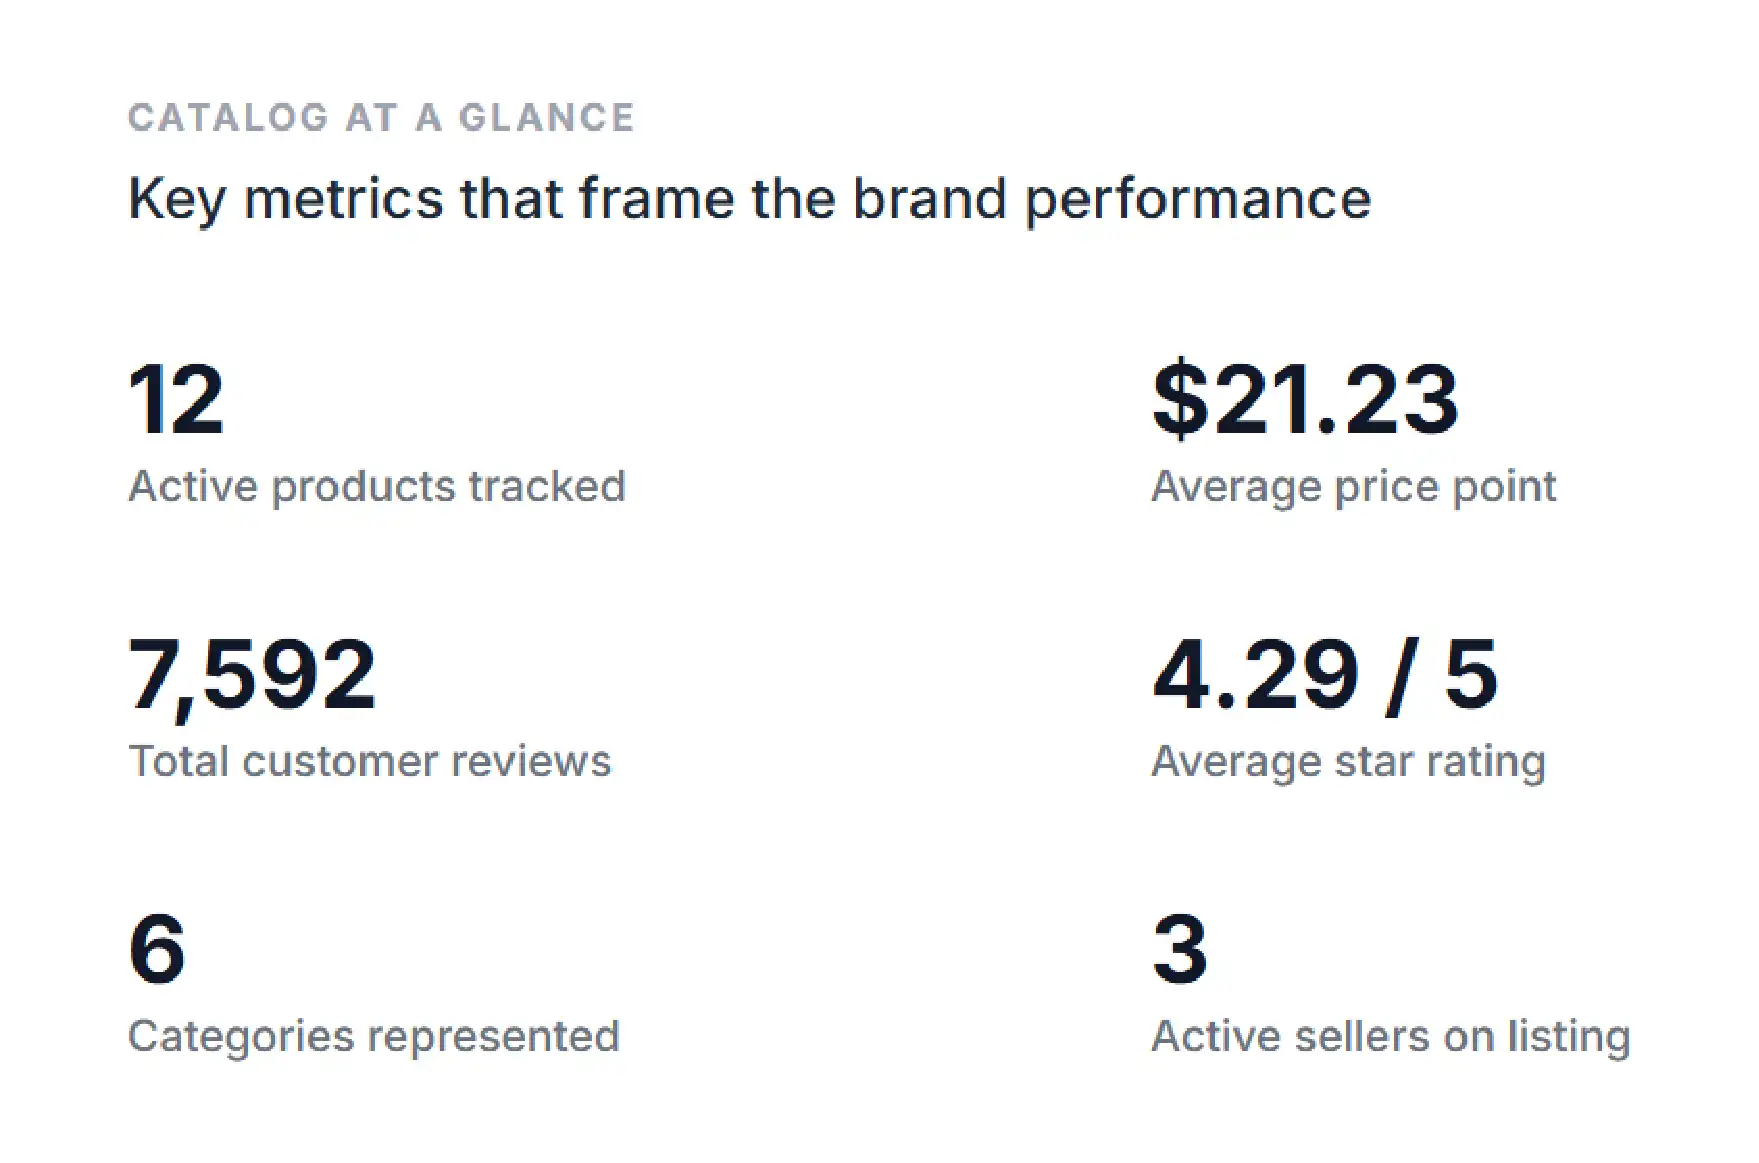
The first thing the data made clear is that Art of Sport competes on focus, not volume. The brand maintains a deliberately tight catalog of just 12 products spread across 6 categories on Amazon, at an average price point of $21.23. That is the antithesis of the sprawling-catalog playbook most personal care brands follow.
Across that small range sat 7,592 customer reviews and an average rating of 4.29 out of 5 — strong social proof concentrated on a curated lineup. This is the kind of focused product-market fit that only becomes visible when Amazon product data is collected catalog-wide and read together. It also explains why the brand can run lean: every SKU pulls real weight, none are dead inventory.
| Core Metric | Value |
|---|---|
| Active products tracked | 12 |
| Categories represented | 6 |
| Total customer reviews | 7,592 |
| Average star rating | 4.29 / 5 |
| Average price point | $21.23 |
| Active sellers on the listing | 3 |
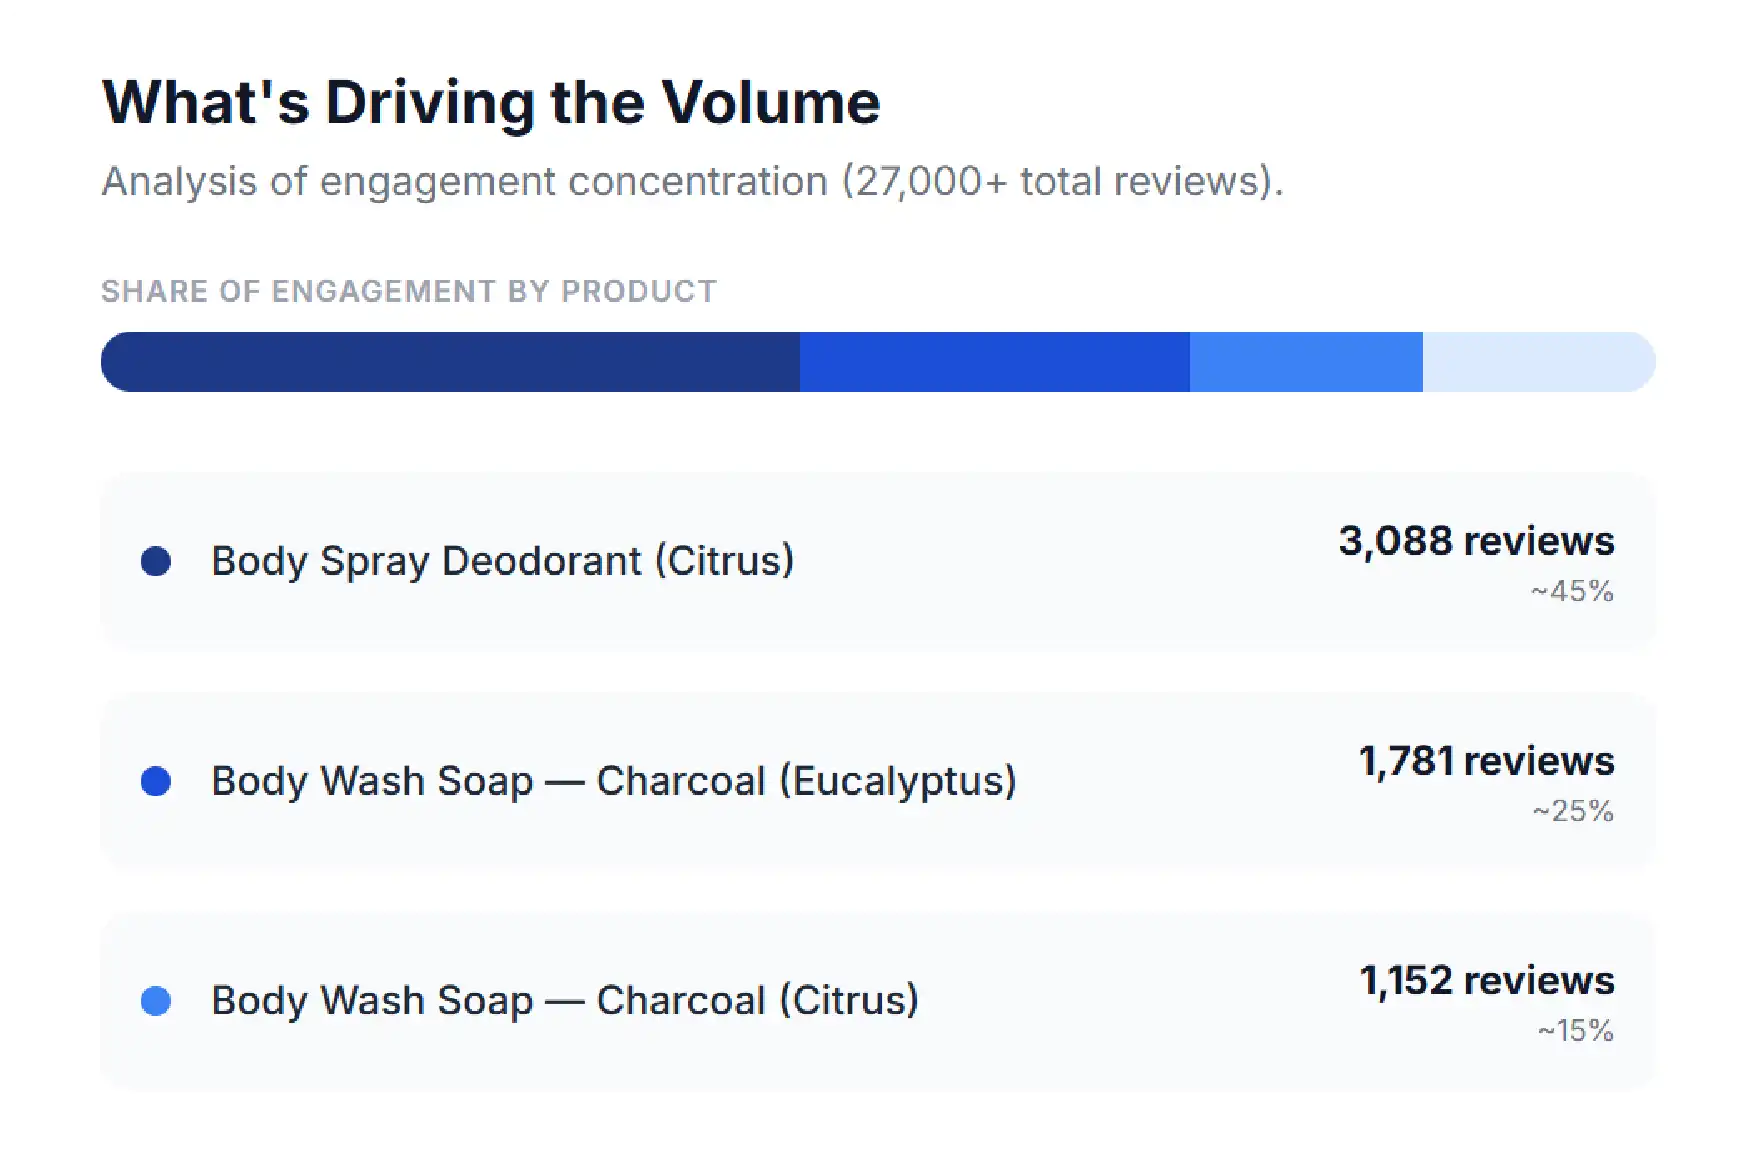
The second finding came from looking at where the catalog’s review weight actually sits. A small handful of SKUs drive the bulk of social proof, and they are all everyday-use items rather than premium niche products.
| Top Reviewed Product | Reviews | Rating |
|---|---|---|
| Body Spray Deodorant (Citrus) | 3,088 | 4.0 ★ |
| Body Wash Soap — Charcoal (Eucalyptus) | 1,781 | 4.4 ★ |
| Body Wash Soap — Charcoal (Citrus) | 1,152 | 4.4 ★ |
These three SKUs together carry roughly 80% of the brand’s total review volume. For a competitor, this is decisive intelligence. It shows exactly where Art of Sport’s defensive moat is strongest and which categories deliver the engagement that funds everything else. Review scraping at the individual SKU level surfaces exactly this kind of pattern; without product-level data extraction, three category-defining heroes like these stay hidden inside a flat catalog list.
WANT TO SEE WHAT THIS LOOKS LIKE FOR YOUR CATEGORY?
Tell iWeb Data Scraping which brand or category you want benchmarked. We will scope it and send a short sample within 48 hours — visit iwebdatascraping.com or email info@iwebdatascraping.com.
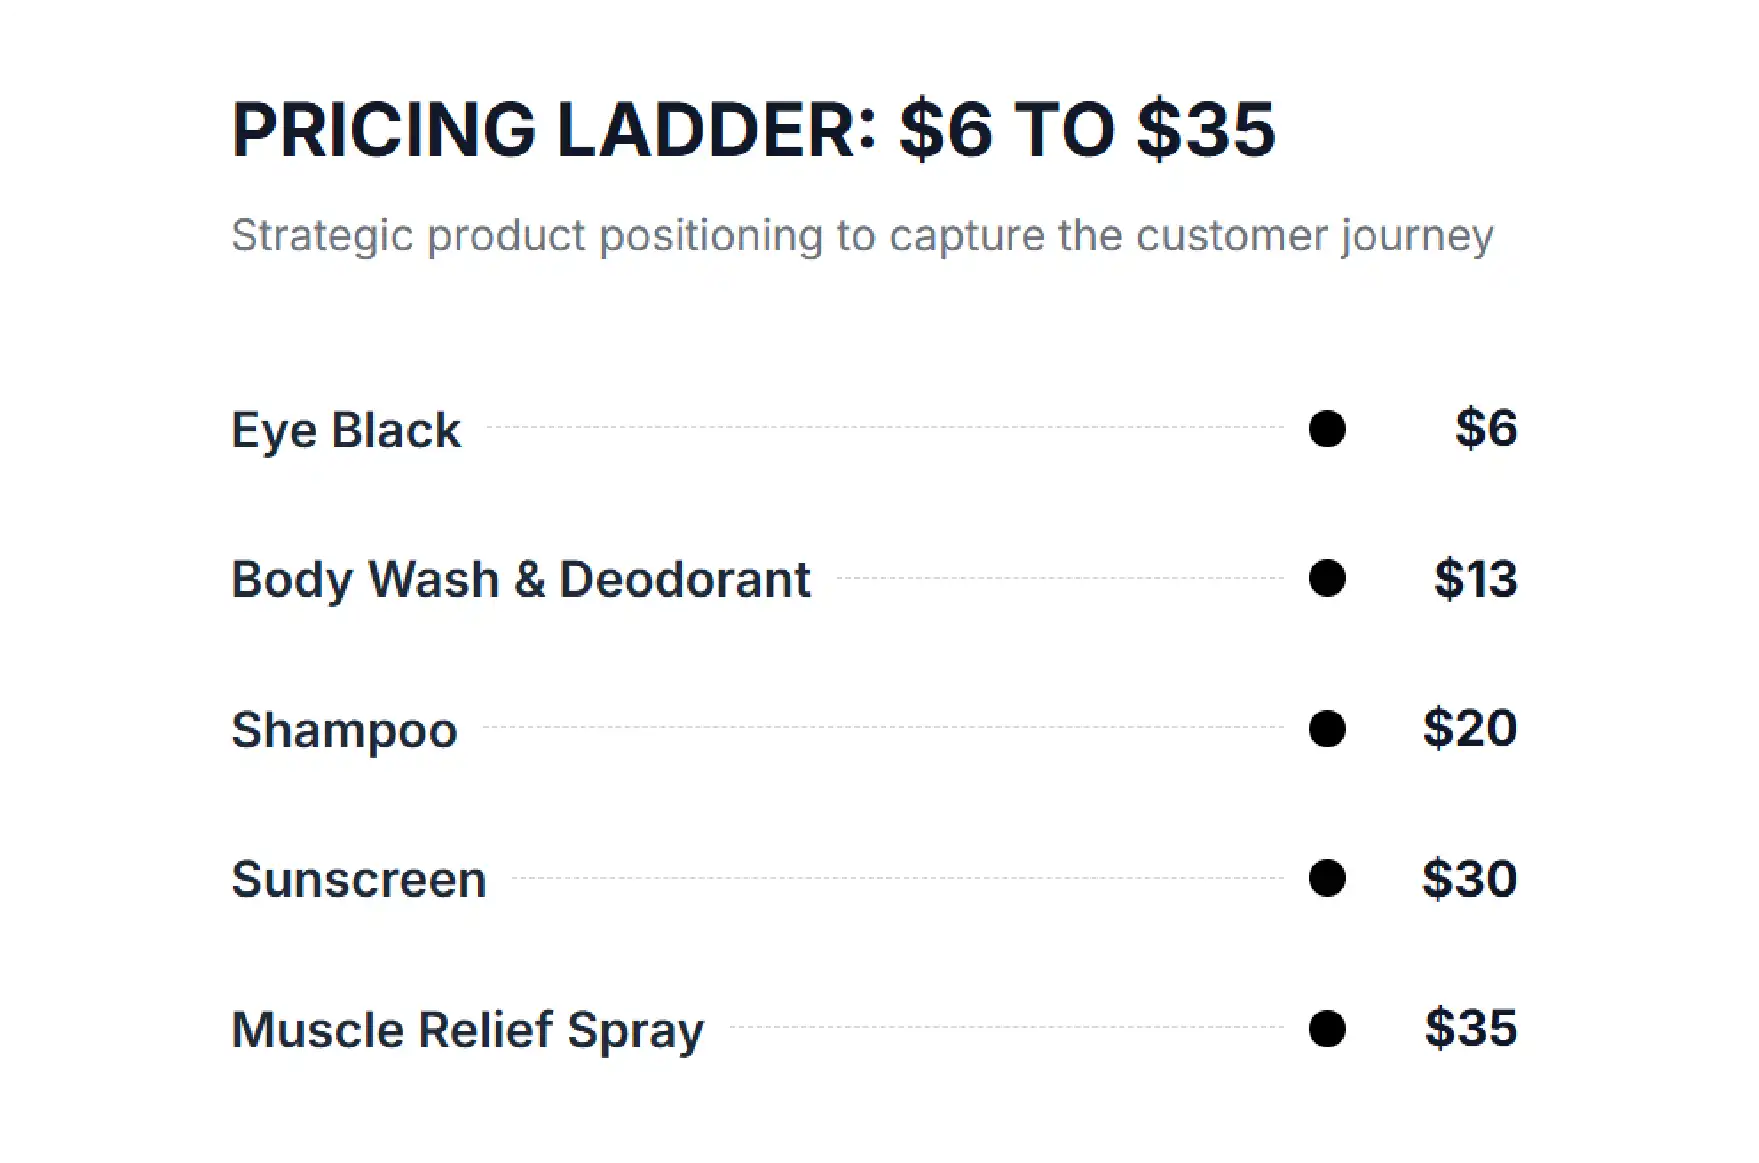
The third finding explained how Art of Sport prices for the gym bag, not the luxury shelf. The catalog spans a deliberate accessible-premium ladder, each tier playing a distinct strategic role in the funnel.
| Tier | Price | Role |
|---|---|---|
| Acquisition | $6 | Eye Black — lowest-friction entry product that introduces the brand to first-time shoppers. |
| Core | $13 – $20 | Body washes, deodorants, shampoo — the everyday revenue engine and the accessible-premium sweet spot. |
| Premium | $30 – $35 | Sunscreen ($30) and Muscle Relief Spray ($35) — higher-margin specialty SKUs. |
Read alongside the product mix, the spread reveals a clear strategy. Art of Sport is not chasing luxury positioning. It is positioning itself for every gym bag in the country, with everyday-use items in the $13–$20 sweet spot and a small set of higher-margin specialty products to lift average order value. Competitor price monitoring through Amazon data scraping is what makes this kind of pattern visible at a glance — and repeatable for any brand willing to study it.
STRATEGIC TAKEAWAY
Art of Sport is not chasing the luxury shelf. It is targeting every gym bag in America — priced to be reached for after every workout.
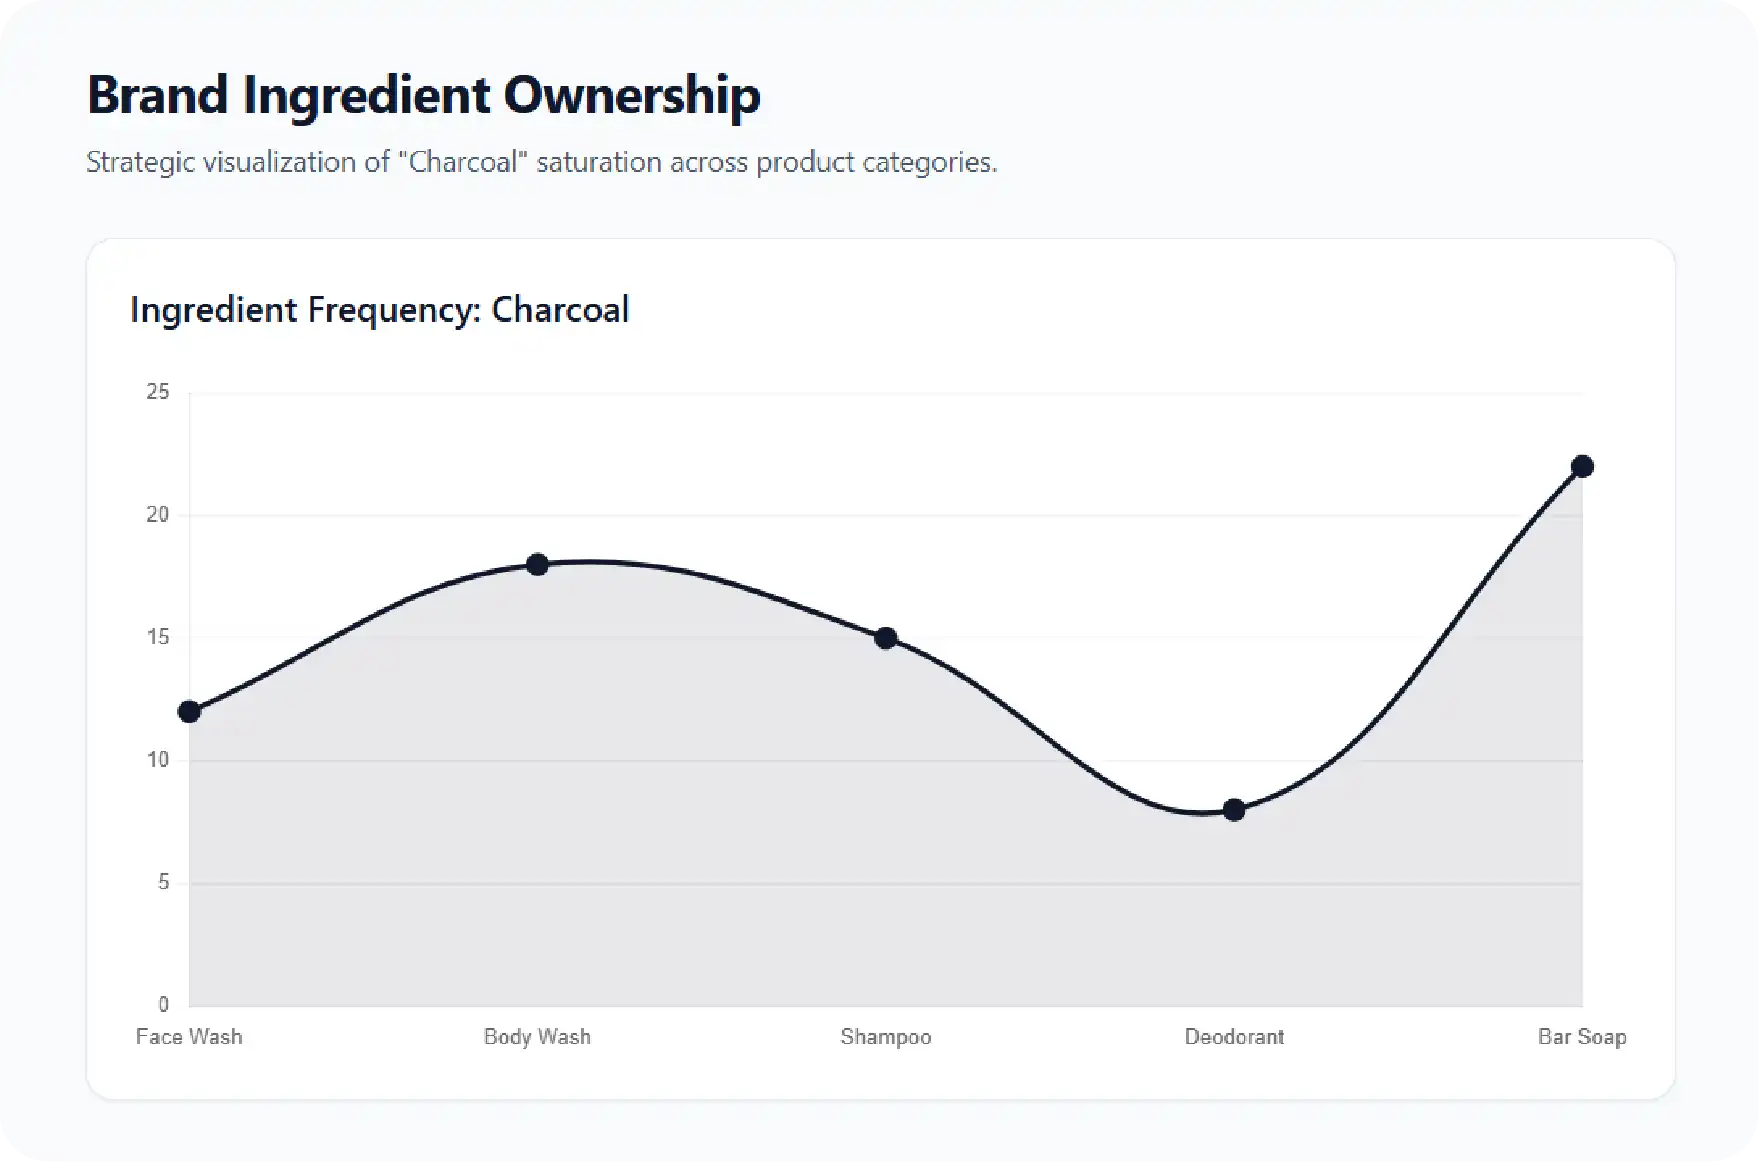
Looking past pricing, the fourth finding revealed something more strategic still. Charcoal appears across multiple categories in the catalog — body wash, shampoo, and face wash. It is not simply a formula choice. It is a deliberate brand signal.
By anchoring multiple SKUs to the same ingredient, Art of Sport teaches the customer to associate charcoal with the brand itself — and, more powerfully, with the idea of a deep, post-workout clean. Repeat the ingredient across the lineup, and the brand becomes the category in the shopper’s mind. Without scraping product titles, descriptions, and ingredient mentions across an entire catalog, an ingredient-ownership pattern like this is impossible to see. A spreadsheet of prices and ratings will never reveal it; a structured Amazon data scraping deliverable will.
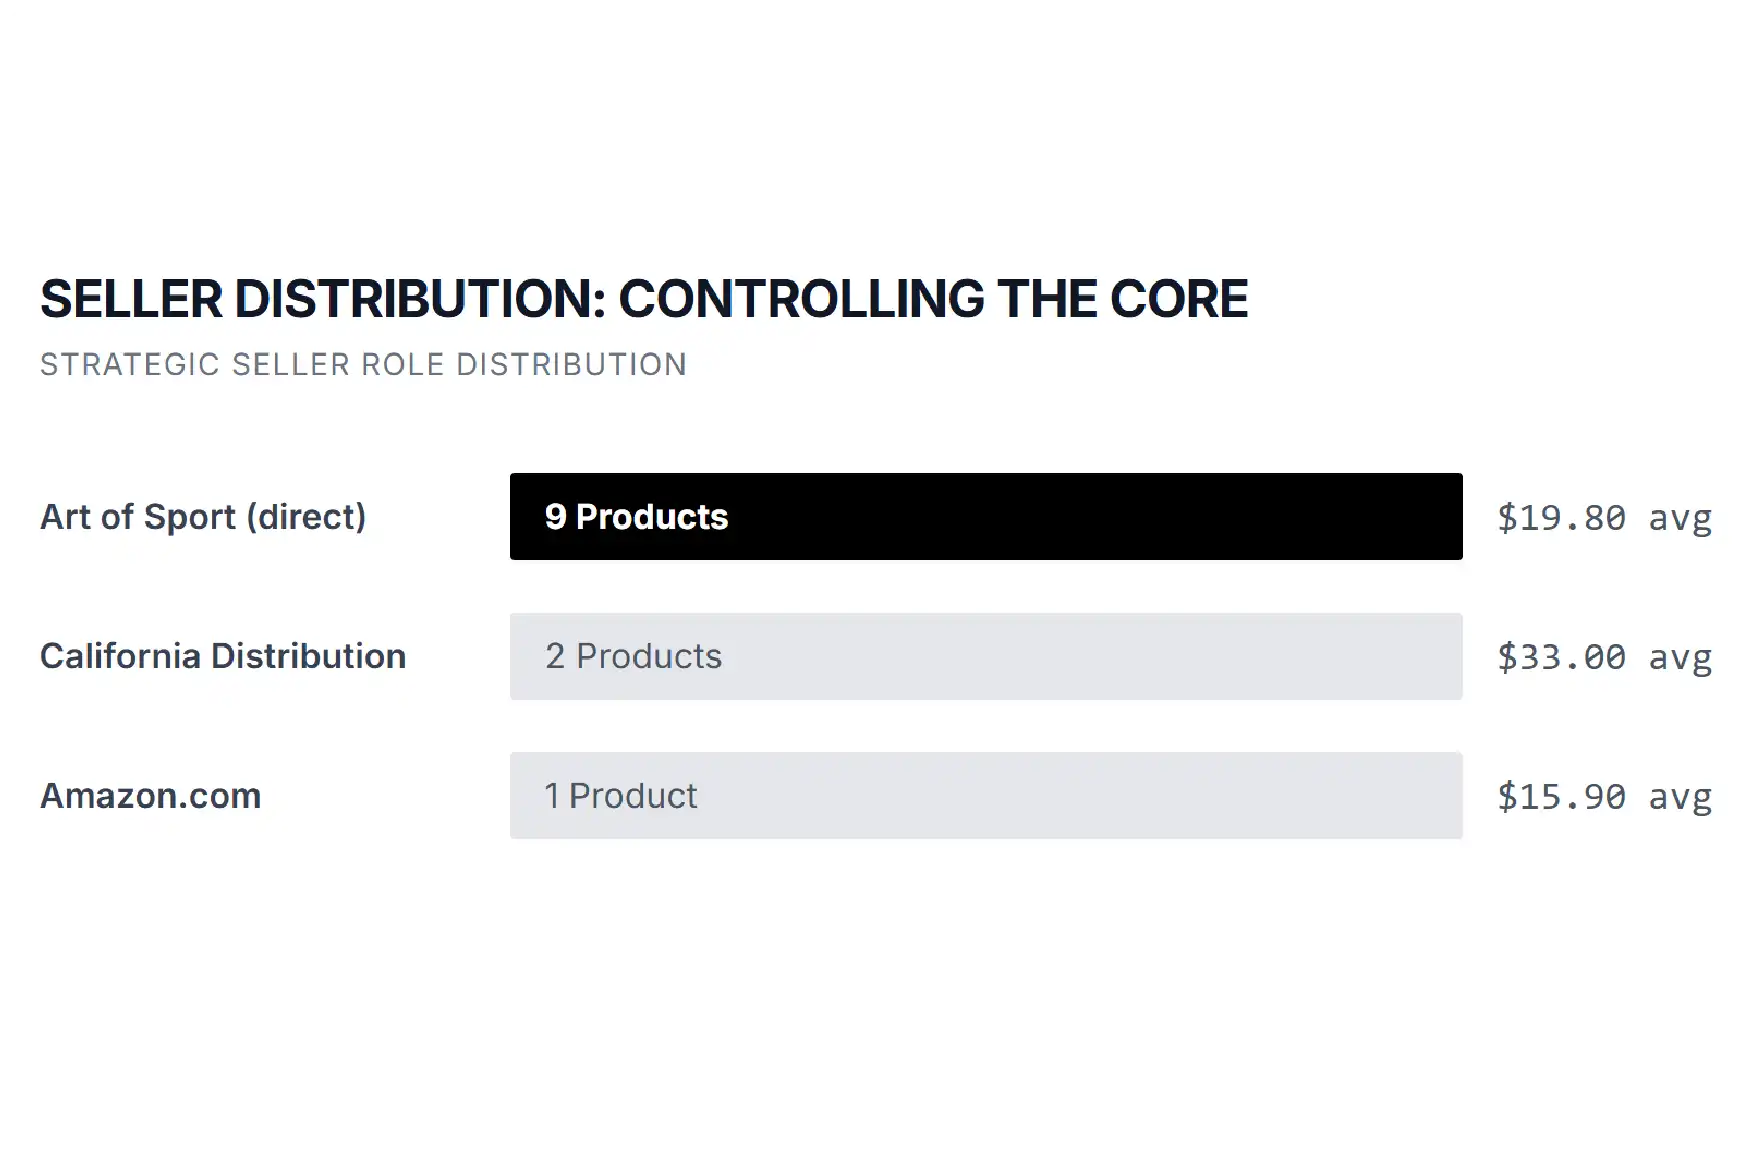
The fifth finding looked at who is actually selling Art of Sport on Amazon. Only 3 sellers appear on the brand’s listings — a deliberately controlled distribution model that protects pricing consistency and brand presentation.
| Seller | Products | Average Price |
|---|---|---|
| Art of Sport (direct) | 9 | $19.80 |
| California Distribution Inc. | 2 | $33.00 |
| Amazon.com | 1 | $15.90 |
The pattern is disciplined. Art of Sport directly manages 9 of the 12 SKUs at an average price near $19.80 — right inside the accessible-premium sweet spot. A specialist distributor handles 2 premium SKUs at a higher $33 average, and Amazon itself sells a single entry-price item. There is no race to the bottom from rogue third-party sellers, no Buy-Box war, no inconsistent pricing eroding margin. Without seller-level data extraction, this kind of distribution control is completely invisible from outside the Amazon ecosystem.
THE COMPETITIVE REALITY
Your competitors are very likely already pulling these signals weekly. Every week you wait is another week they price, stock, and launch with better information than you do.
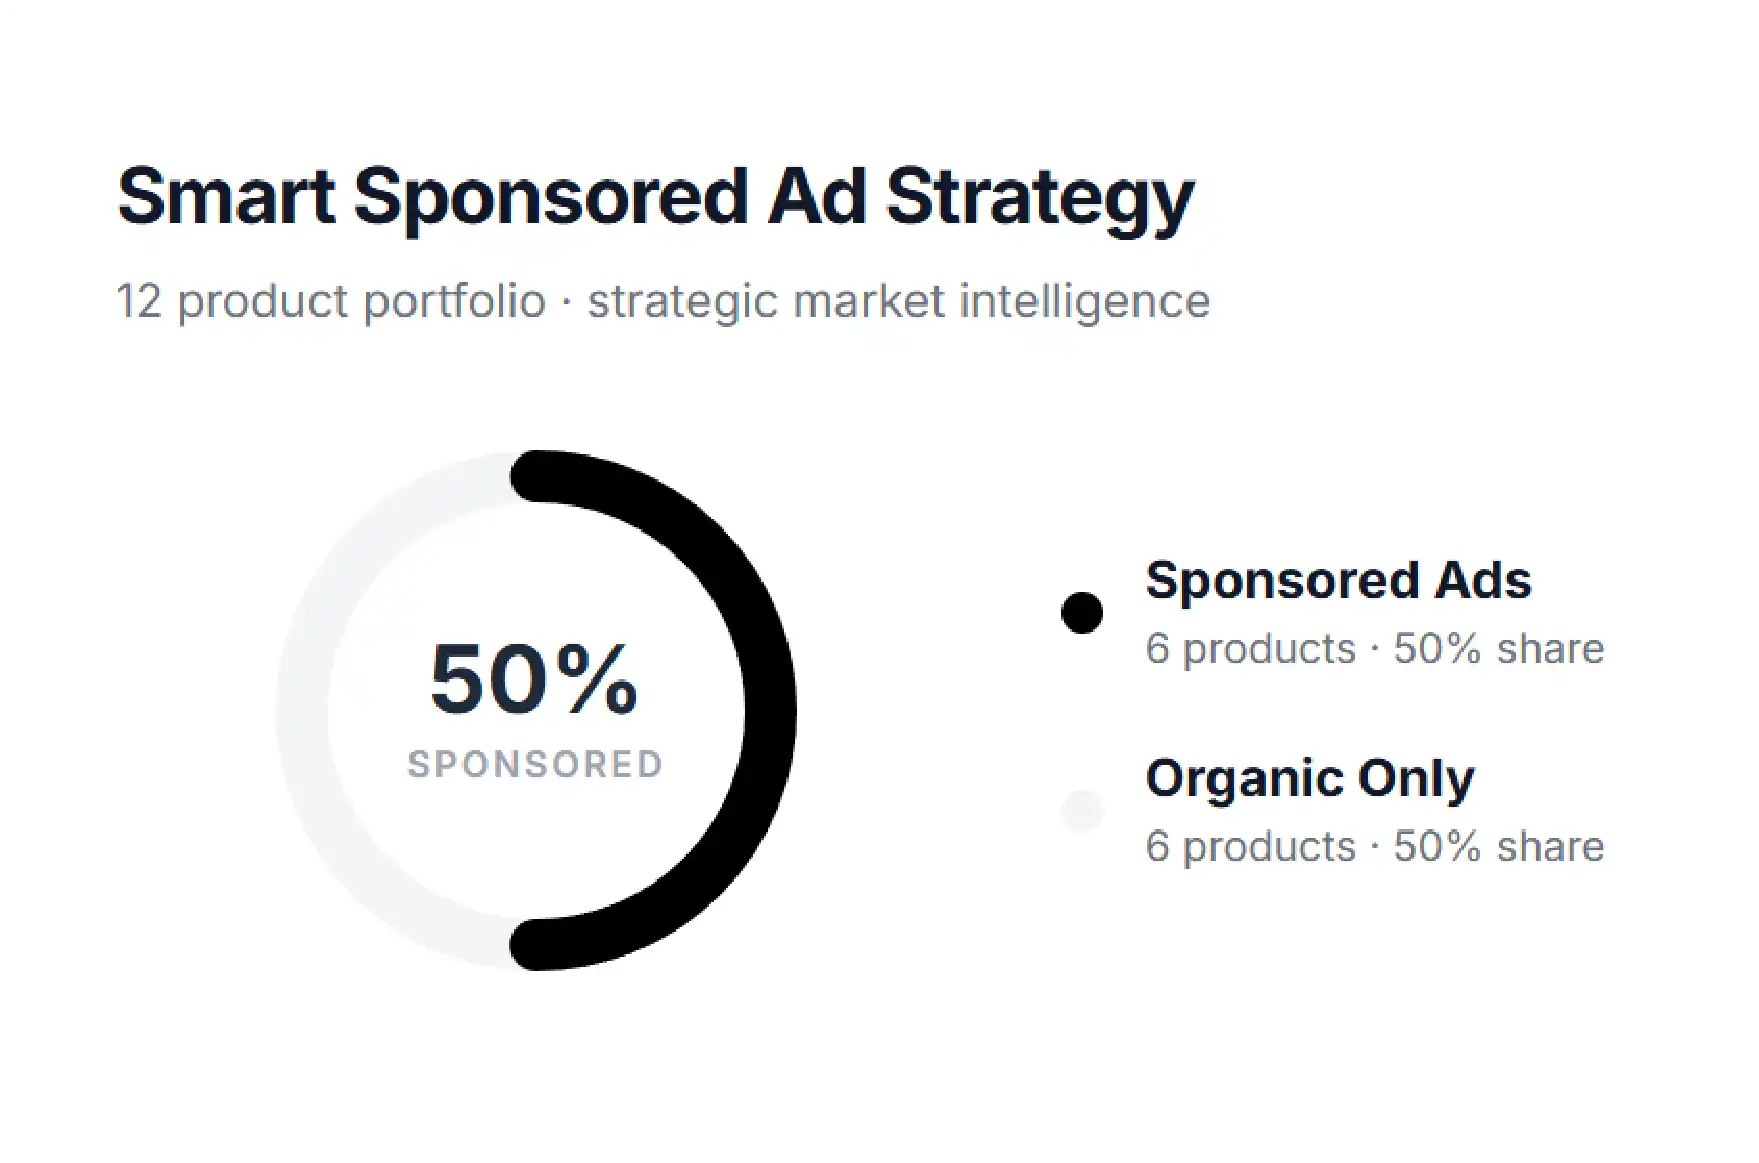
The sixth finding tested how Art of Sport uses paid placement on top of its organic strength. Roughly half of the 12 products were running Amazon Sponsored Ads — a high promotion ratio, but the spend was deployed with clear intent.
Instead of amplifying bestsellers that already convert, Art of Sport directs paid placement toward newer, higher-margin specialty items: Muscle Relief Spray at $35 and Sunscreen at $30. The brand uses its organic engines (body wash, deodorant) for trust and uses ads to accelerate the discovery of the SKUs that pay back fastest per click. That is a more sophisticated playbook than the usual “spend on the best seller” approach — and a pattern only structured Amazon data scraping can reveal at a glance.
To make the deliverable concrete, the extract below illustrates the kind of structured dataset an Amazon data scraping engagement produces. Each row is one product record, and every field is analysis-ready the moment it is exported.
| ASIN | Product Name | Category | Ingredient | Price | Rating | Reviews | Placement |
|---|---|---|---|---|---|---|---|
| B0XXAOS01 | Body Spray Deodorant (Citrus) | Deodorant | — | $13.00 | 4.0 | 3,088 | Organic |
| B0XXAOS02 | Body Wash (Eucalyptus) | Body Wash | Charcoal | $13.99 | 4.4 | 1,781 | Organic |
| B0XXAOS03 | Body Wash (Citrus) | Body Wash | Charcoal | $13.99 | 4.4 | 1,152 | Organic |
| B0XXAOS04 | Shampoo | Hair Care | Charcoal | $16.50 | 4.2 | 680 | Sponsored |
| B0XXAOS05 | Face Wash | Skin Care | Charcoal | $15.99 | 4.1 | 412 | Sponsored |
| B0XXAOS06 | Eye Black | Accessories | — | $6.00 | 4.5 | 245 | Organic |
| B0XXAOS07 | Muscle Relief Spray | Recovery | — | $35.00 | 4.3 | 118 | Sponsored |
| B0XXAOS08 | Sunscreen | Skin Care | — | $30.00 | 4.2 | 96 | Sponsored |
In a live engagement, this table refreshes on a defined schedule, includes historical price, seller, and ad-status columns for trend analysis, and feeds directly into dashboards, pricing models, or automated alerts when a new seller enters the listing or an ad is paused. The point is simple: the deliverable is never a screenshot or a messy export — it is clean, validated eCommerce data a team can act on immediately. (Values shown here are illustrative samples; a live project reflects current marketplace data.)
A dataset only matters if it changes a decision, and the Art of Sport analysis shows precisely how. A competing personal care brand could use the same Amazon data scraping output to benchmark its own pricing against Art of Sport’s $21.23 average and reposition with confidence. A category manager could see that three SKUs carry roughly 80% of the brand’s social proof and concentrate product development where engagement is actually achievable.
A marketing team could replicate the brand’s sponsored-ad pattern — organic traffic on proven SKUs, paid push on higher-margin newer ones — instead of spending blindly. A distribution lead could see that just 3 controlled sellers manage the entire catalog and apply the same brand-protection model to their own. An investor running due diligence could verify — with evidence rather than assumption — that Art of Sport’s growth rests on disciplined focus and ingredient ownership rather than catalog inflation. In every case the value is identical: replacing opinion with a defensible number.
iWeb Data Scraping specializes in turning fragmented retail pages into reliable, structured datasets. The company’s Amazon data scraping services cover product data extraction, competitor price monitoring, review and sentiment analysis, seller and Buy-Box tracking, and sponsored-ad monitoring across thousands of listings and multiple marketplaces.
Every dataset is validated, deduplicated, and delivered in the format a client’s systems already use — CSV, JSON, a database load, or a direct API feed. Collection runs on a schedule the client controls, so the data never goes stale, and every pipeline is monitored so that a layout change on the retailer’s side does not quietly corrupt the feed. The brands that win on Amazon are not guessing. They are reading the shelf with better data than their competitors — and that is exactly what iWeb Data Scraping delivers.
See exactly what an iWeb Data Scraping deliverable looks like before you commit. CSV format. Live fields. No call required.
Email info@iwebdatascraping.com with the subject line “Sample Dataset” and tell us the brand or category to analyze.
Start a projectAmazon data scraping is the automated collection of public product information from Amazon — including prices, reviews, ratings, sellers, availability, and ad placements — and its conversion into a clean, structured dataset that businesses can analyze. iWeb Data Scraping delivers this data validated and ready to use.
Yes — arguably more so. As the Art of Sport analysis shows, brands with tight, intentional catalogs hide more strategic signal per SKU. Structured scraping makes ingredient repetition, seller control, and ad targeting visible across even a small lineup.
Most engagements deliver an initial dataset within 48 to 72 hours of scope confirmation, followed by scheduled refreshes at a cadence the client controls.
Yes. iWeb Data Scraping can extract structured ingredient and feature fields from product titles, descriptions, and bullet copy, which is what makes ingredient-ownership patterns like Art of Sport’s charcoal play visible across the lineup.
Yes. Sponsored versus organic placement is captured for every listing, so competitor ad strategy is visible in the same dataset as pricing and reviews.
Share the brands, categories, or marketplaces you want to track. iWeb Data Scraping scopes the required fields and refresh cadence, then delivers a validated dataset you can act on immediately. The fastest path to evaluate the output is to request the free sample dataset linked above.