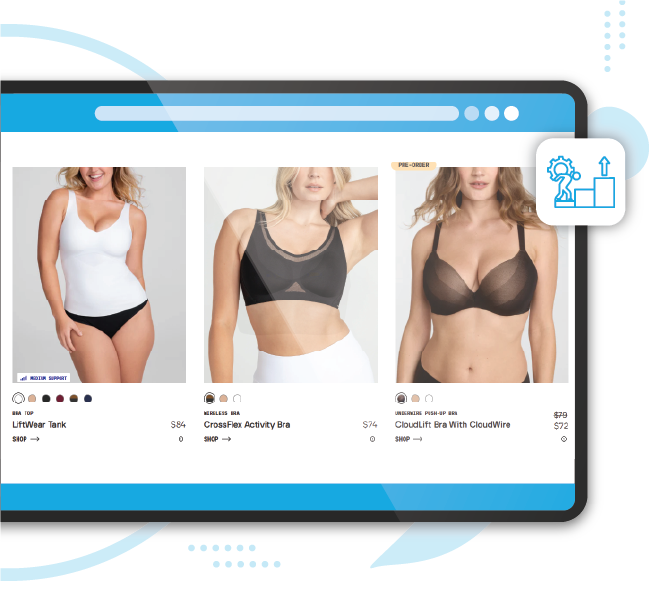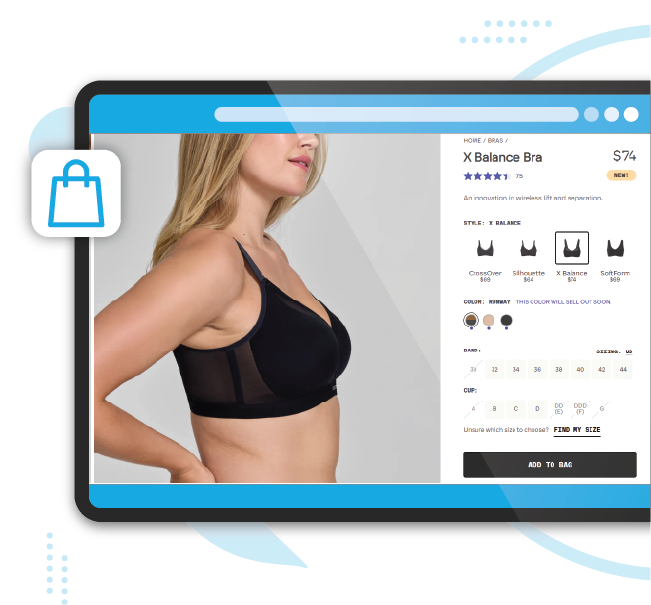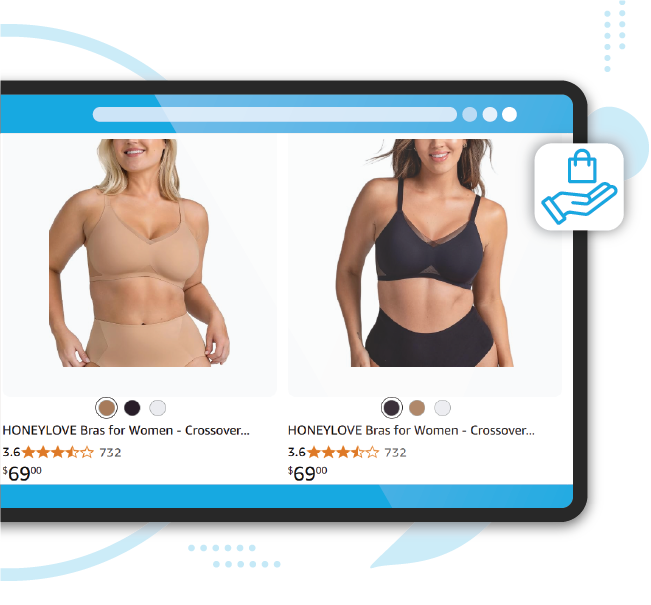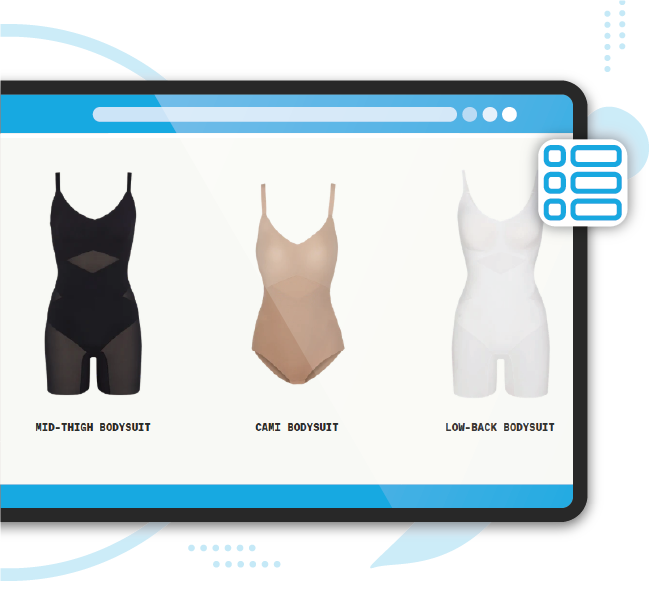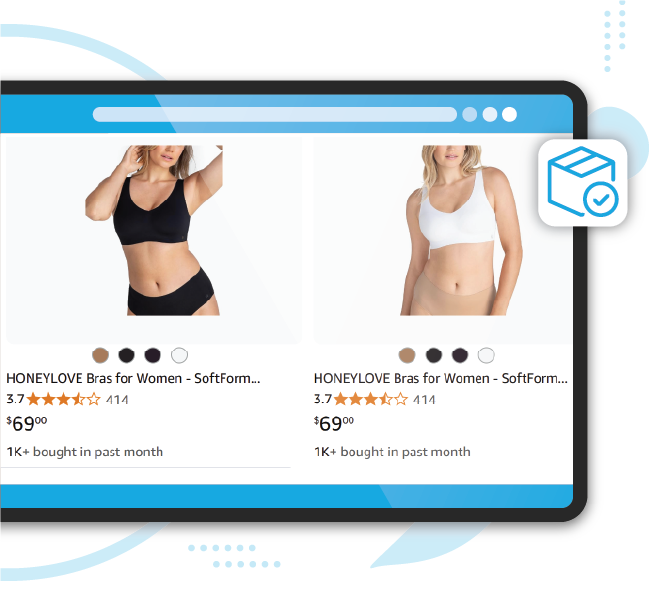
When a direct-to-consumer brand like Honeylove competes on Amazon, success is never the result of a single product going viral. It is the outcome of an entire catalog working as a coordinated system — priced, positioned, and reviewed with intent. The challenge for competing brands, investors, and category managers is simple: that system is almost invisible from the outside. Prices, reviews, and rankings are scattered across hundreds of pages and change constantly.
This Amazon data scraping case study shows how iWeb Data Scraping converted thousands of fragmented Amazon listings into one clean, structured dataset — and how that dataset revealed exactly how Honeylove scaled its shapewear business. The analysis surfaced the brand’s pricing ladder, its category concentration, its hero product, and the balance between organic and paid visibility. More importantly, it produced a repeatable model: any brand can use the same web scraping approach to benchmark competitors, refine pricing, and protect market share with evidence instead of guesswork.
Most brands already suspect what they need to know about a competitor. They rarely have the evidence to act on it. Amazon product pages publicly display price, reviews, ratings, and availability, but that information is fragmented across hundreds of URLs, refreshes by the minute, and is actively defended against automated collection.
Anyone who has tried to build a competitor dataset by hand knows the friction. Prices shift across regions and thousands of zip codes. Listings appear, sell out, and disappear without notice. Raw HTML is messy and inconsistent from one page template to the next. A scraper that worked perfectly yesterday can break overnight after a quiet layout change, and nobody notices until the numbers are already wrong.
The cost of this is not only wasted time. Decisions built on stale or incomplete numbers — a price change, an inventory bet, a new product launch, an acquisition valuation — carry real financial risk. Reliable Amazon data scraping exists precisely to remove that risk. It replaces best guesses with a verified ground truth that refreshes on a schedule the business controls, so the picture is never out of date when a decision has to be made.
Honeylove built its reputation by engineering shapewear for performance and comfort rather than compression alone. On Amazon, that positioning shows up as a focused, premium catalog rather than a sprawling one — a smaller range of products that each carry real demand.
For this case study, iWeb Data Scraping treated Honeylove as a live example of a category leader and asked one straightforward question: if a competitor wanted to understand exactly how Honeylove wins on Amazon, what would the data have to show them? Answering that required far more than a product list. It required structured eCommerce data covering pricing, review depth, category mix, rating distribution, and the split between organic and sponsored visibility — the same signals a strategy team studies before entering or defending a category.
iWeb Data Scraping approached the project the way it approaches every retail intelligence engagement — define the questions first, then build the dataset to answer them. The team began by identifying every active Honeylove listing on Amazon, then extracted a consistent set of fields from each one.
For every product, the Amazon data scraping pipeline captured the product title, ASIN, category, current price, star rating, total review count, seller, availability, and whether the placement was organic or sponsored. Because Amazon prices and stock levels move continuously, collection was scheduled to refresh on a fixed cadence rather than captured once — a single snapshot would have been outdated within hours.
Every record then passed through validation rules that flagged missing fields, impossible values, and duplicate listings before anything reached the final dataset. This is the step that separates dependable retail data from a noisy export. The output was not raw HTML or a pile of screenshots. It was a clean, analysis-ready table — the kind of product data extraction result a pricing analyst or category manager can open and use the same day it lands.
The first thing the data made clear is that Honeylove competes on focus, not volume. The brand maintained a compact catalog of 45 active products on Amazon at an average price point of $87.22 — a genuinely premium position for the shapewear category.
Across that small catalog sat 6,330 customer reviews and an average rating of 3.92 out of 5. For a competing brand, this combination is the headline insight. Honeylove is not trying to flood the category with options and win on choice. It is sustaining real review volume and premium pricing on a deliberately narrow range — one of the clearest signals of genuine product-market fit that Amazon product data can reveal.
| Core Metric | Value |
|---|---|
| Active products tracked | 45 |
| Average price point | $87.22 |
| Total customer reviews | 6,330 |
| Average star rating | 3.92 / 5 |
The second finding came from grouping reviews by category. Customer engagement was not spread evenly across the catalog — it was heavily concentrated in two areas. Shapewear and Bras together drove more than 96% of all customer reviews, while panties, shorts, and accessories made up only a thin remaining slice.
For anyone using Amazon data scraping to plan a category entry or defend an existing position, this is decisive intelligence. It shows a competitor exactly where Honeylove’s demand actually lives, where its defensive moat is strongest, and — just as importantly — where the catalog is thin enough to be challenged with a focused product launch.
| Category | Reviews | Share of Engagement |
|---|---|---|
| Shapewear | 3,578 | ~57% |
| Bras | 2,512 | ~40% |
| Panties, Shorts & Accessories | 240 | ~3% |
Within the catalog, one product stood out from the rest. The Honeylove Crossover Bra carried 578 reviews, making it the single most-reviewed item in the entire range. Its role is strategic rather than accidental. Priced as an accessible entry product, the Crossover Bra introduces new shoppers to the brand and steadily accumulates the social proof that later persuades those same shoppers to buy higher-priced pieces.
Review scraping at the individual SKU level surfaces exactly this kind of hero product — the listing a competitor would need to study, target, or out-position first. Without product-level data extraction, a hero SKU like this stays hidden inside a category average.
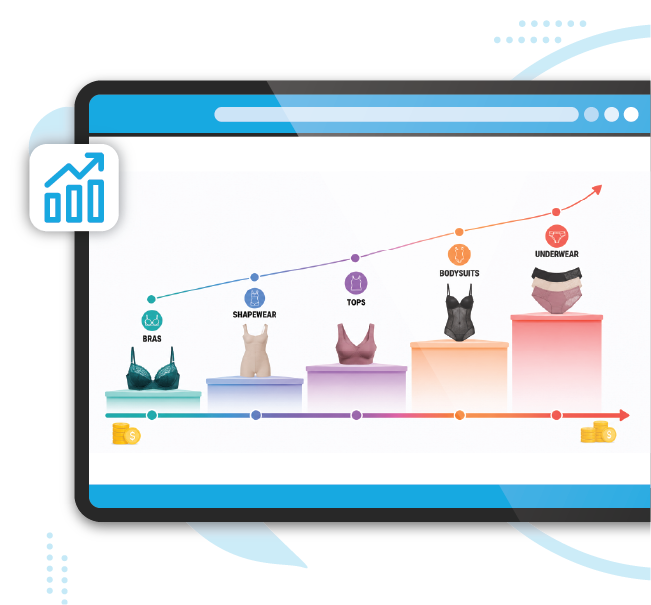
The fourth finding explained how Honeylove turns a first purchase into a larger one. Even within a focused catalog, prices are laddered with clear intent. Average selling prices climbed steadily from shorts at the entry end to high-compression shapewear at the premium end.
Read alongside the product mix, that spread reveals a deliberate three-tier strategy. Entry-tier bras priced around $64–$69 lower the barrier to a first purchase. Core high-compression shapers near $92 form the technical heart of the brand and its main revenue engine. A premium tier of technical bodysuits priced between $109 and $129 then maximizes average order value once trust is established. Competitor price monitoring through Amazon data scraping is what makes a pattern like this visible — and, crucially, repeatable for any brand willing to study it.
| Category | Average Selling Price |
|---|---|
| Shorts | $66.86 |
| Panties | $79.00 |
| Bras | $84.00 |
| Shapewear (High-Compression) | $92.48 |
The fifth finding tested how much of Honeylove’s visibility was earned rather than paid for. Of the 45 tracked products, 35 — roughly 78% — won their visibility through organic ranking, while only 10, around 22%, relied on sponsored placement.
That ratio matters more than it first appears. A catalog that ranks mostly on organic strength is signaling real product-market fit rather than demand propped up by advertising spend. For a competitor, it also sets a realistic expectation: displacing Honeylove will take more than a bigger ad budget, because the brand’s position rests on organic relevance that Amazon data scraping can measure but money alone cannot quickly buy.
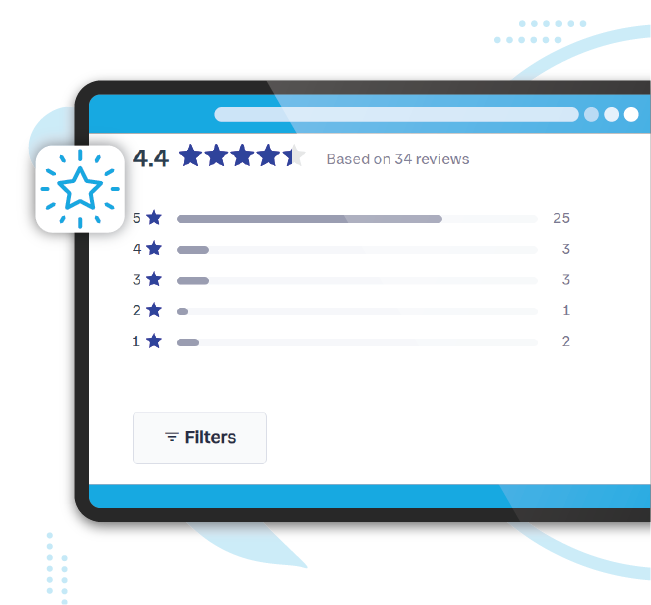
The final finding looked at consistency. Scaling a catalog often causes quality to drift, but Honeylove’s rating distribution showed the opposite pattern. Of 45 products, 43 held a 4-star rating and 2 reached a full 5-star rating — almost nothing in the catalog underperformed.
For a brand built on engineering and fit, that level of consistency is a competitive asset in its own right. It is also a signal that only becomes visible when rating data is collected across the entire catalog through systematic web scraping, rather than sampled from a handful of bestsellers.
To make the deliverable concrete, the extract below illustrates the kind of structured dataset an Amazon data scraping engagement produces. Each row is one product record, and every field is analysis-ready the moment it is exported.
In a live engagement, this table would refresh on a defined schedule, include historical price and stock columns for trend analysis, and feed directly into dashboards, pricing models, or automated alerts. The point is simple: the deliverable is never a screenshot or a messy export — it is clean, validated eCommerce data a team can act on immediately. (Values shown here are illustrative samples; a live project reflects current marketplace data.)
| ASIN | Product Name | Category | Price | Rating | Reviews | Placement |
|---|---|---|---|---|---|---|
| B0XXLOVE01 | Crossover Bra | Bras | $66.86 | 4.1 | 578 | Organic |
| B0XXLOVE02 | Silhouette Bra | Bras | $68.00 | 4.0 | 431 | Organic |
| B0XXLOVE03 | SuperPower Short | Shapewear | $92.48 | 4.2 | 962 | Sponsored |
| B0XXLOVE04 | Thigh Shaping Bodysuit | Shapewear | $129.00 | 3.9 | 805 | Organic |
| B0XXLOVE05 | V-Neck Bodysuit | Shapewear | $109.00 | 4.0 | 540 | Sponsored |
| B0XXLOVE06 | Sculpting Brief | Panties | $79.00 | 4.1 | 148 | Organic |
A dataset only matters if it changes a decision, and the Honeylove analysis shows precisely how. A competing shapewear brand could use the same Amazon data scraping output to benchmark its own pricing against Honeylove’s $87.22 average and reposition with confidence. A category manager could see that Shapewear and Bras carry more than 96% of engagement and concentrate product development where demand is already proven.
A pricing team could track the $66–$92 ladder over time and detect the exact moment Honeylove discounts a line or launches a new product. An investor running due diligence could verify — with evidence rather than assumption — that the brand’s growth rests on organic strength and consistent quality rather than heavy ad spend. In every case the value is identical: replacing opinion with a defensible number.
That is also what makes a case study like this a genuine high-inquiry lead-generation asset. It does not simply claim capability; it demonstrates it. Decision-makers who read structured, evidence-led analysis arrive at the contact form already convinced of the value — which is exactly the kind of qualified, high-intent inquiry a data partner wants to attract.
iWeb Data Scraping specializes in turning fragmented retail pages into reliable, structured datasets. The company’s Amazon data scraping services cover product data extraction, competitor price monitoring, review and sentiment analysis, and stock and availability tracking across thousands of listings and multiple marketplaces.
Every dataset is validated, deduplicated, and delivered in the format a client’s systems already use — CSV, JSON, a database load, or a direct API feed. Collection runs on a schedule the client controls, so the data never goes stale, and every pipeline is monitored so that a layout change on the retailer’s side does not quietly corrupt the feed. The brands that win on Amazon are not guessing. They are reading the shelf with better data than their competitors — and that is exactly what iWeb Data Scraping delivers.
The Honeylove analysis is a single brand, but the method behind it is universal. With disciplined Amazon data scraping, any catalog on any marketplace can be decoded into the signals that genuinely drive decisions: pricing strategy, category concentration, hero products, organic strength, and quality consistency.
Your competitors are very likely already studying these numbers. The only real question is whether you are seeing what they see. iWeb Data Scraping makes sure you do.
Amazon data scraping is the automated collection of public product information from Amazon — including prices, reviews, ratings, availability, and rankings — and its conversion into a clean, structured dataset that businesses can analyze. iWeb Data Scraping delivers this data validated and ready to use.
Yes. As this case study demonstrates, structured Amazon data reveals a competitor’s pricing ladder, category concentration, hero products, and organic-versus-sponsored mix — the exact signals a brand needs to benchmark and respond effectively.
Because Amazon prices and stock change constantly, iWeb Data Scraping runs collection on a schedule the client controls — daily, hourly, or a custom cadence — so the insights stay current.
Datasets are delivered analysis-ready in the format your systems use, including CSV, JSON, direct database loads, or an API feed that integrates with existing dashboards.
Share the brands, categories, or marketplaces you want to track. iWeb Data Scraping scopes the required fields and refresh cadence, then delivers a validated dataset you can act on immediately.
We start by signing a Non-Disclosure Agreement (NDA) to protect your ideas.
Our team will analyze your needs to understand what you want.
You'll get a clear and detailed project outline showing how we'll work together.
We'll take care of the project, allowing you to focus on growing your business.