
920K+
TOTAL REVIEWS

See how Amazon product data scraping exposes review concentration, the pricing ladder, and hero-SKU risk behind a top hydration brand on Amazon.
If your decisions depend on what is actually selling on Amazon — not what a brand claims in its press release — this breakdown was written for you. We reverse-engineered a hydration leader using only public marketplace data to show what disciplined retail intelligence reveals. It speaks directly to:
Liquid I.V. is one of the clearest examples on Amazon of a brand that grew on evidence rather than instinct. Founded in 2012 by Brandin Cohen, the hydration company was acquired by Unilever in 2020 and, under CEO Mike Keech, quadrupled in size to become the number-one powdered hydration brand in the United States. On the surface, that looks like a marketing success story. Underneath, it is a data story.
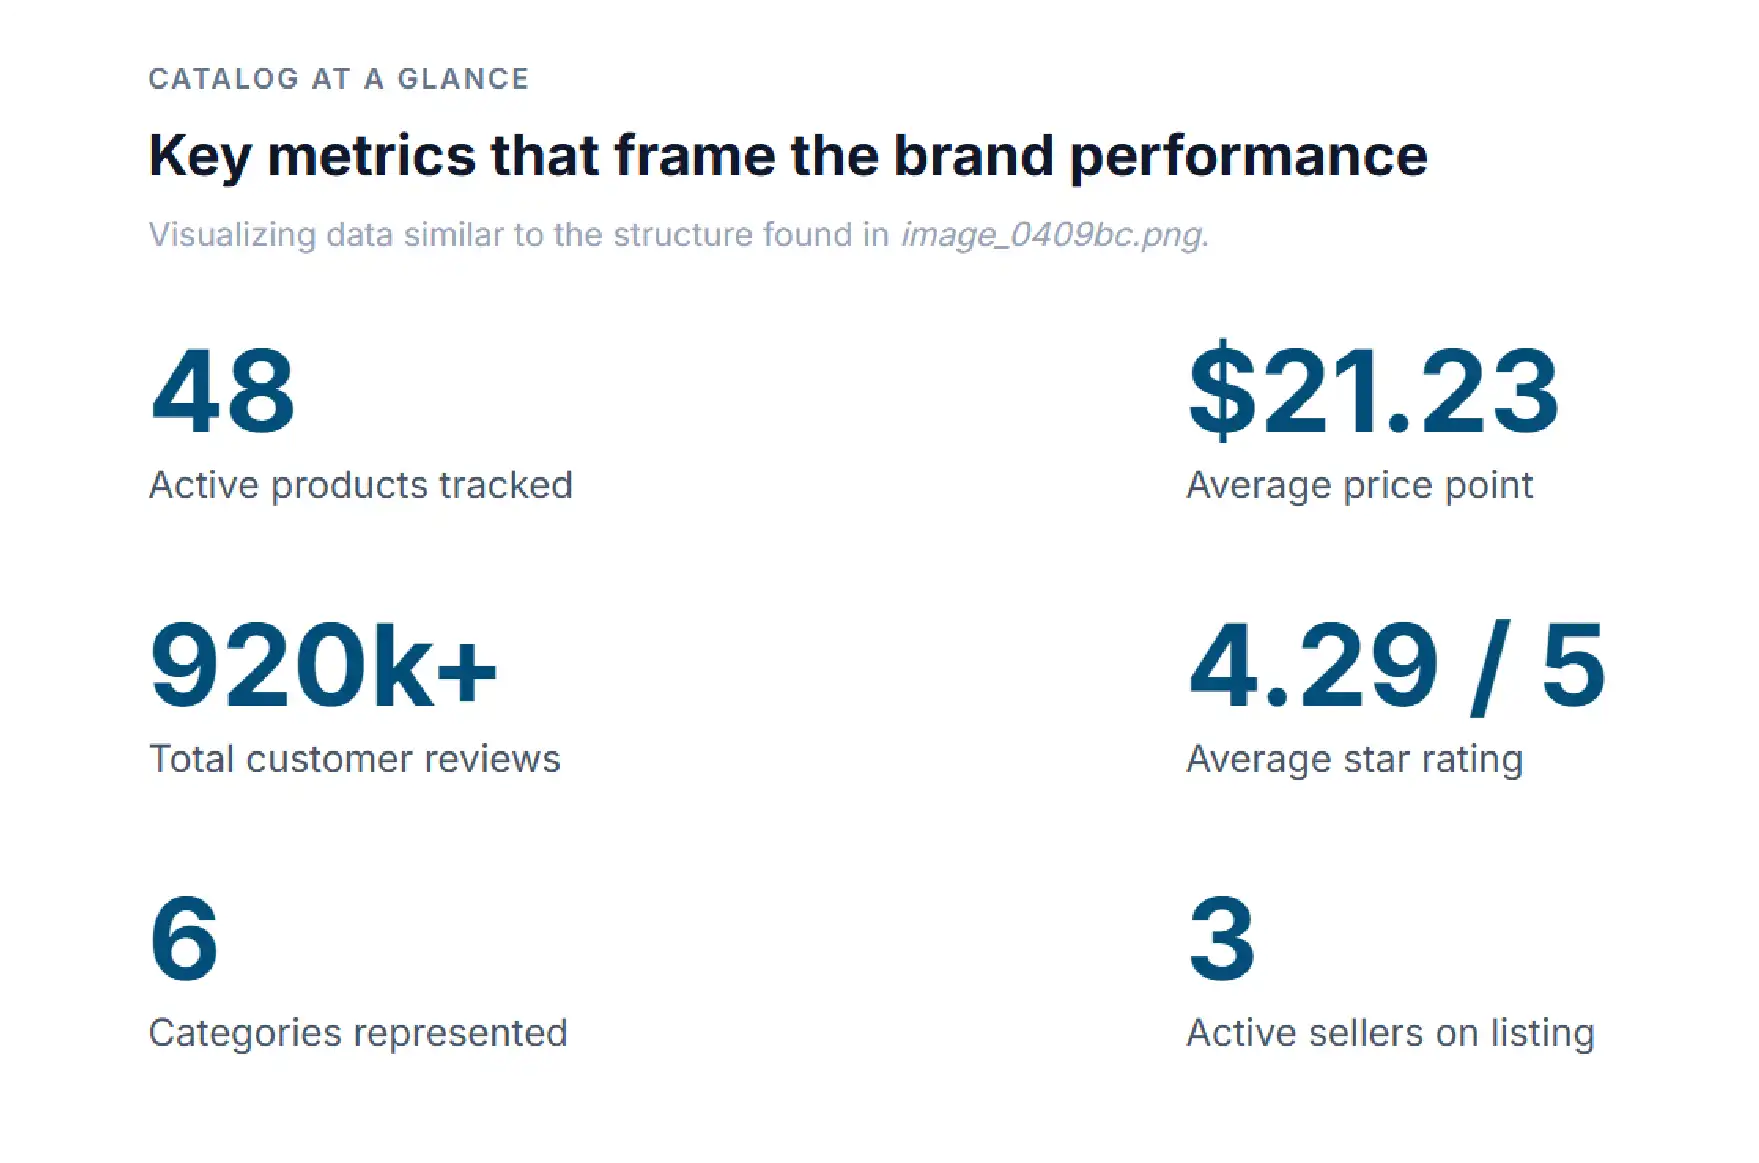
Using Amazon product data scraping, we assembled a structured snapshot of the brand's storefront: 48 live products, more than 920,000 cumulative reviews, and a blended rating of 4.51 stars. We then went further than a typical scoreboard. We measured how those reviews are distributed, how the price ladder is engineered to move a first-time buyer from a $3.59 trial packet to a $99.97 bundle, and where the brand's real demand is concentrated.
The headline finding is striking: a single flavor accounts for more than 283,000 reviews — over thirteen times the brand's second-most-reviewed product. That concentration is both the brand's biggest asset and, as our unique analysis shows, its most overlooked risk. This case study walks through six findings, the methodology behind them, and what the same approach can surface for any category you compete in.
Anyone can open a product page and read a review count. Turning thousands of those pages into a clean, comparable dataset is a different problem entirely — and it is where most internal projects stall. The marketplace is built to resist large-scale collection.
First, retailers actively defend against automated access. Rate limits, rotating layouts, bot detection, and CAPTCHAs are all designed to break naive scrapers. Second, pricing is not a single number; it shifts by the minute and varies across thousands of zip codes, Buy Box winners, coupons, and Subscribe & Save offers. A figure captured at 9 a.m. may be wrong by lunch. Third, the underlying HTML changes constantly. A selector that worked last week silently returns blanks this week, and the failure is invisible until someone audits the numbers.
Then there is the structural trap most teams never notice: Amazon groups color, size, and flavor options under a parent listing, and reviews are frequently pooled across that family. Read one page in isolation and you can dramatically misattribute demand. Getting trustworthy data is less about writing a script and more about maintaining a resilient pipeline — and that maintenance is exactly where in-house efforts burn time they meant to spend on strategy.
Before the findings, it is worth being honest about the build-versus-partner decision. Here is how a do-it-yourself stack typically compares with a managed service across the dimensions that actually determine whether the data is usable.
| Dimension | DIY Scraping | iWeb Data Scraping |
|---|---|---|
| Setup time | Weeks of engineering before first usable dataset | Live within days, scoped to your category |
| Anti-bot handling | Constant firefighting against blocks and CAPTCHAs | Managed proxy and detection layer, handled for you |
| Data accuracy | Silent failures; blanks pass as real values | Validated, deduplicated, QA-checked records |
| Variation logic | Reviews easily misattributed across SKUs | Parent-child mapping resolved explicitly |
| Price freshness | Stale snapshots between manual runs | Scheduled refresh at your chosen cadence |
| Maintenance | Breaks whenever the site layout changes | Pipeline upkeep included, zero overhead |
| Total cost | Hidden in engineering hours and rework | Predictable, decision-ready deliverable |
Liquid I.V. began with a simple observation about how poorly the body absorbs plain water under stress, and turned that idea into a powdered electrolyte drink mix sold in single-serve sticks. The promise — faster hydration than water alone — is easy to understand and easy to repeat, which matters enormously on a marketplace where a shopper decides in seconds.
Today the Amazon catalog spans 48 distinct products: flavor variations of the flagship Hydration Multiplier, immune-support and energy line extensions, and a wide range of pack sizes from single sticks to 50-count bundles. That assortment is not random. It is engineered so that a curious first-time buyer and a committed monthly subscriber both find a product priced for exactly where they are in their journey.
What makes the brand a perfect teaching case is that almost everything driving its growth is publicly observable. The reviews, ratings, prices, pack configurations, and flavor lineup all sit in plain sight on the storefront. The brands that win are simply the ones that read those signals systematically. The rest leave the same data on the table, unanalyzed.
We treated Liquid I.V.'s storefront the way we treat any client category: as a structured collection problem with a verification layer bolted on top. The goal was not a pile of HTML, but a spreadsheet a strategist could trust on a Monday morning.
We began by enumerating every live product associated with the brand, capturing ASIN, product title, category, listing price, star rating, and review count for each. Crucially, we resolved the parent-child relationships so that a flavor variation was never mistaken for an independent product, and so that pooled reviews could be flagged rather than double-counted. Prices were captured with timestamps to preserve a defensible point-in-time view rather than a moving target.
Every record then passed through validation: empty fields were re-fetched rather than accepted as zeros, outliers were checked against the live page, and duplicates were collapsed. Only after that cleaning did we move to analysis — review concentration, rating distribution, price-tier mapping, and the assortment math behind the blended selling price. The findings that follow all rest on that validated foundation, which is the entire point: the conclusions are only as good as the pipeline beneath them.
Across its 48 products, Liquid I.V. has accumulated more than 920,000 customer reviews. On a platform where social proof is the closest thing to currency, that volume is a moat. A shopper comparing hydration options sees a wall of feedback that a newer competitor cannot manufacture quickly, and that perception compounds: high review counts lift conversion, conversion lifts rank, and rank drives more reviews.
What makes the number actionable rather than merely impressive is the structure underneath it. Review volume at this scale is rarely spread evenly, and knowing the shape of the distribution tells you where the brand's defensibility actually lives — and where a challenger might find an opening. That is exactly what the next finding exposes.
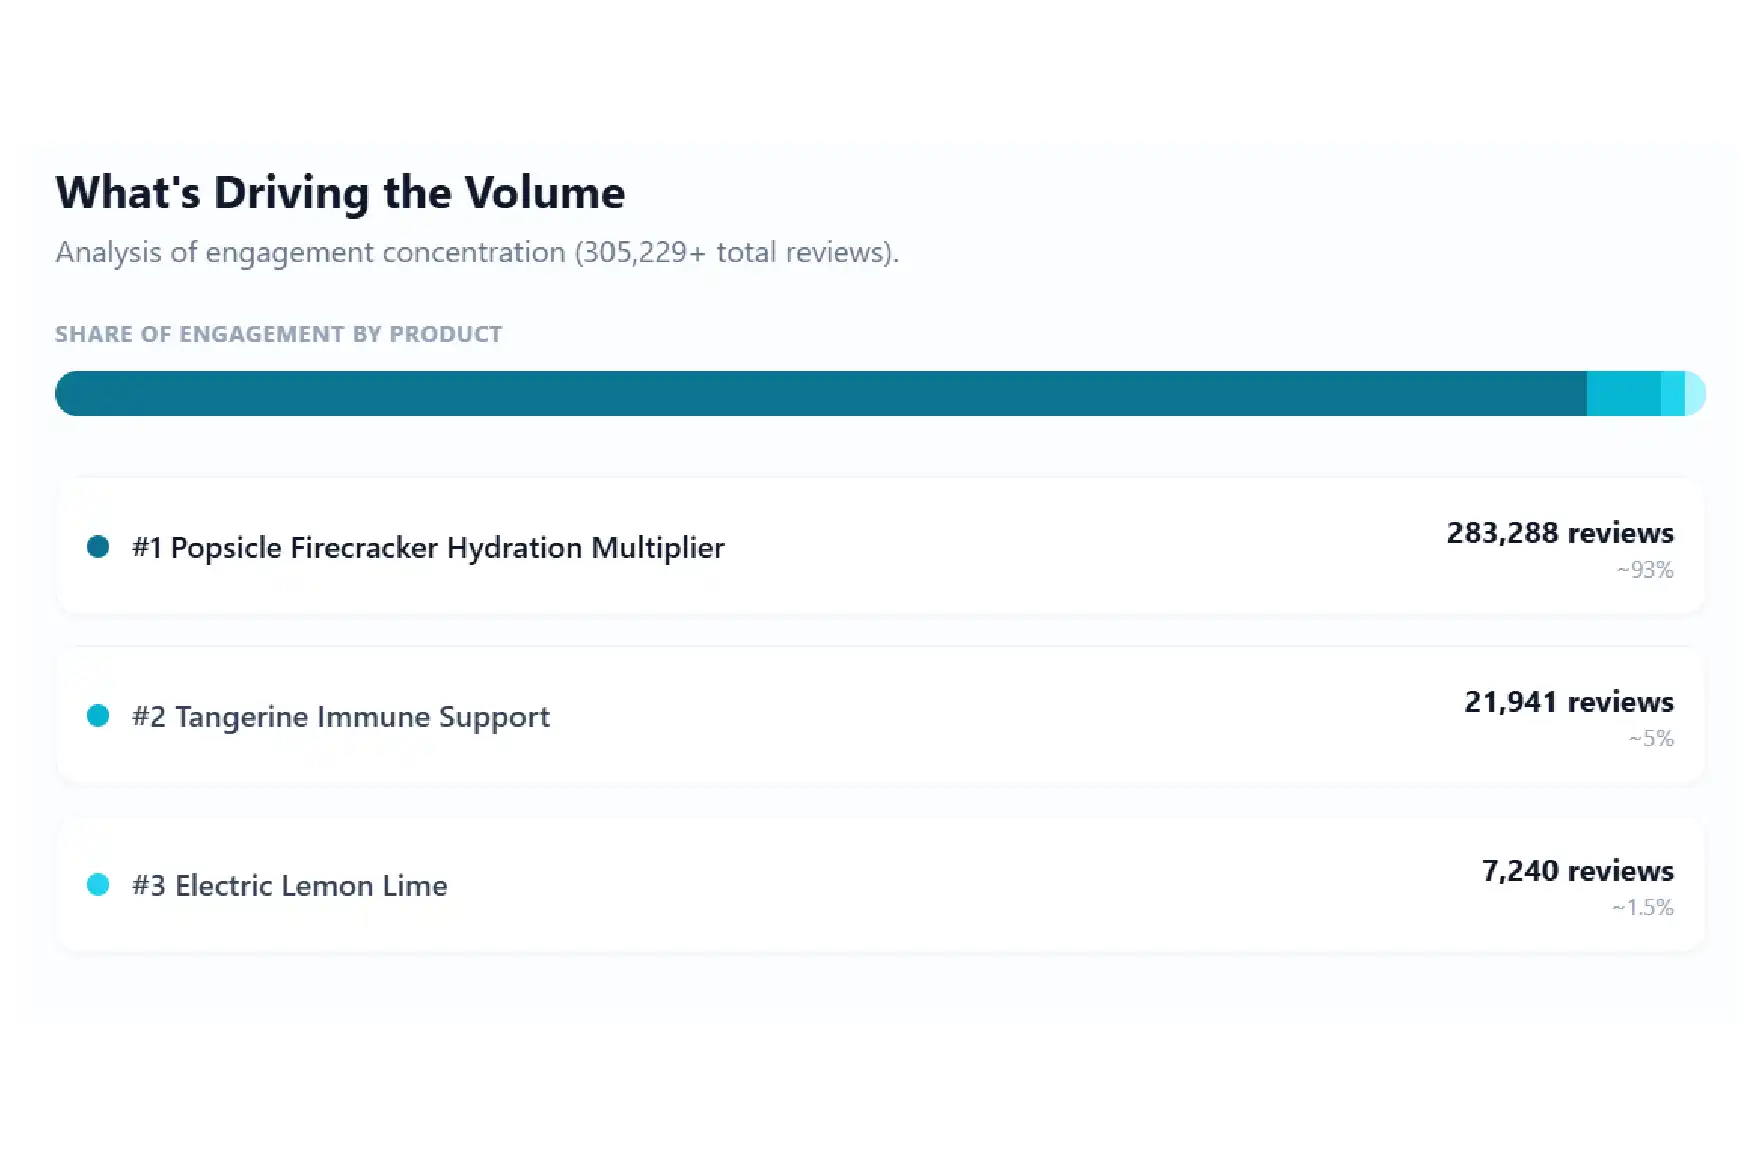
The single most revealing signal in the entire dataset is the gap between the brand's top product and everything else. The Popsicle Firecracker flavor of the Hydration Multiplier carries 283,288 reviews. The next-closest product, Tangerine Immune Support, sits at 21,941. That is a thirteen-to-one gap between first and second place.
A gap that large is not luck — it is a signal. It tells you that a small number of blockbuster SKUs generate the majority of the brand's momentum, visibility, and search dominance. For a competitor, that pinpoints exactly which listing to study and out-position. For the brand itself, it identifies the asset that must be protected at all costs. Either way, you cannot act on a concentration you have not measured, and you cannot measure it without clean, SKU-level data.
SEE YOUR OWN CATEGORY THIS CLEARLY
Imagine this same SKU-level view for your top three competitors. iWeb Data Scraping can map review concentration, pricing, and assortment across an entire category in days. Email info@iwebdatascraping.com to scope it.
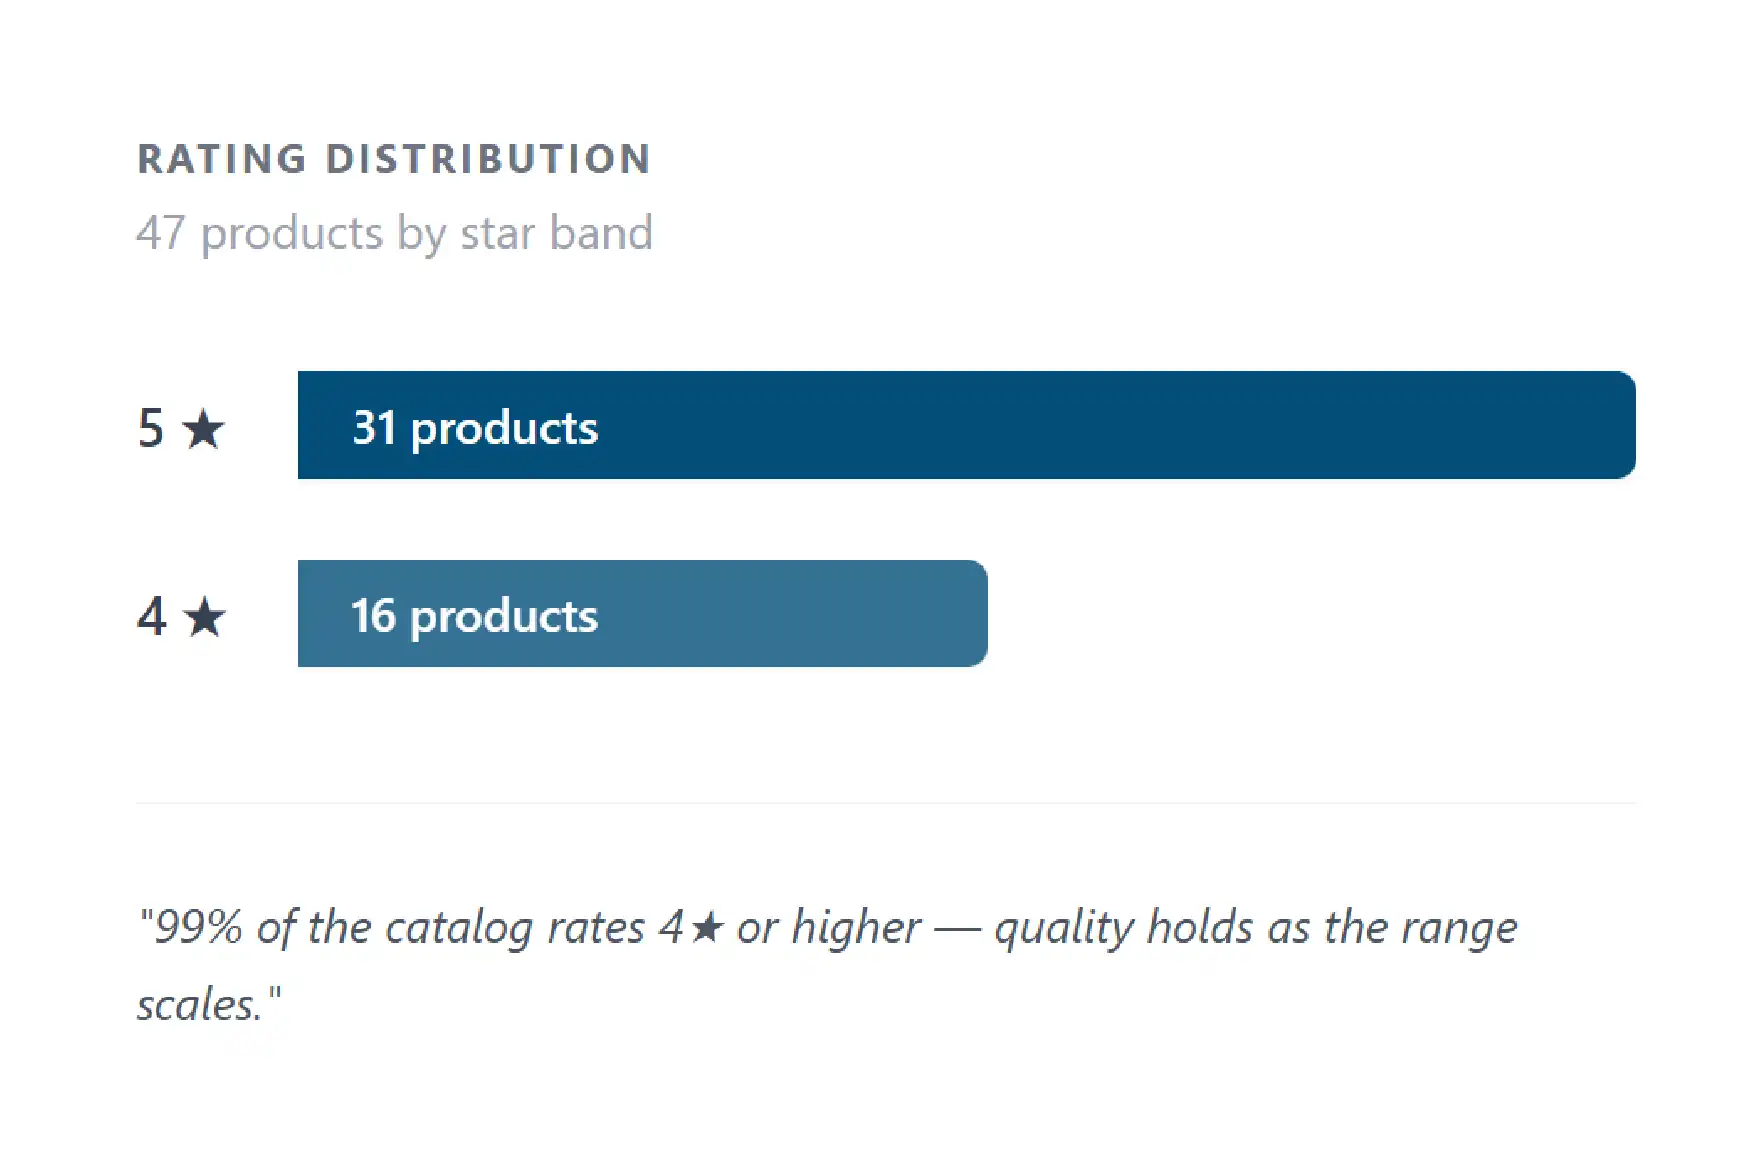
Volume without quality erodes a brand quickly, so the second half of the social-proof picture is the rating spread. Liquid I.V. carries a blended 4.51 stars across its catalog. Breaking that down, 31 products sit at a 5-star rating and 16 sit at 4 stars — a distribution heavily weighted toward the top of the scale.
High ratings at this consistency are not a vanity metric. They are evidence that the product reliably meets expectations, which is what turns a one-time trial into a repeat purchase and, eventually, a subscription. For analysts, the rating distribution is also a quality-control lens: a product slipping from 5 to 4 stars is an early warning of a formulation, packaging, or fulfillment problem long before it shows up in sales. Tracked over time, this single column becomes a leading indicator rather than a lagging one.
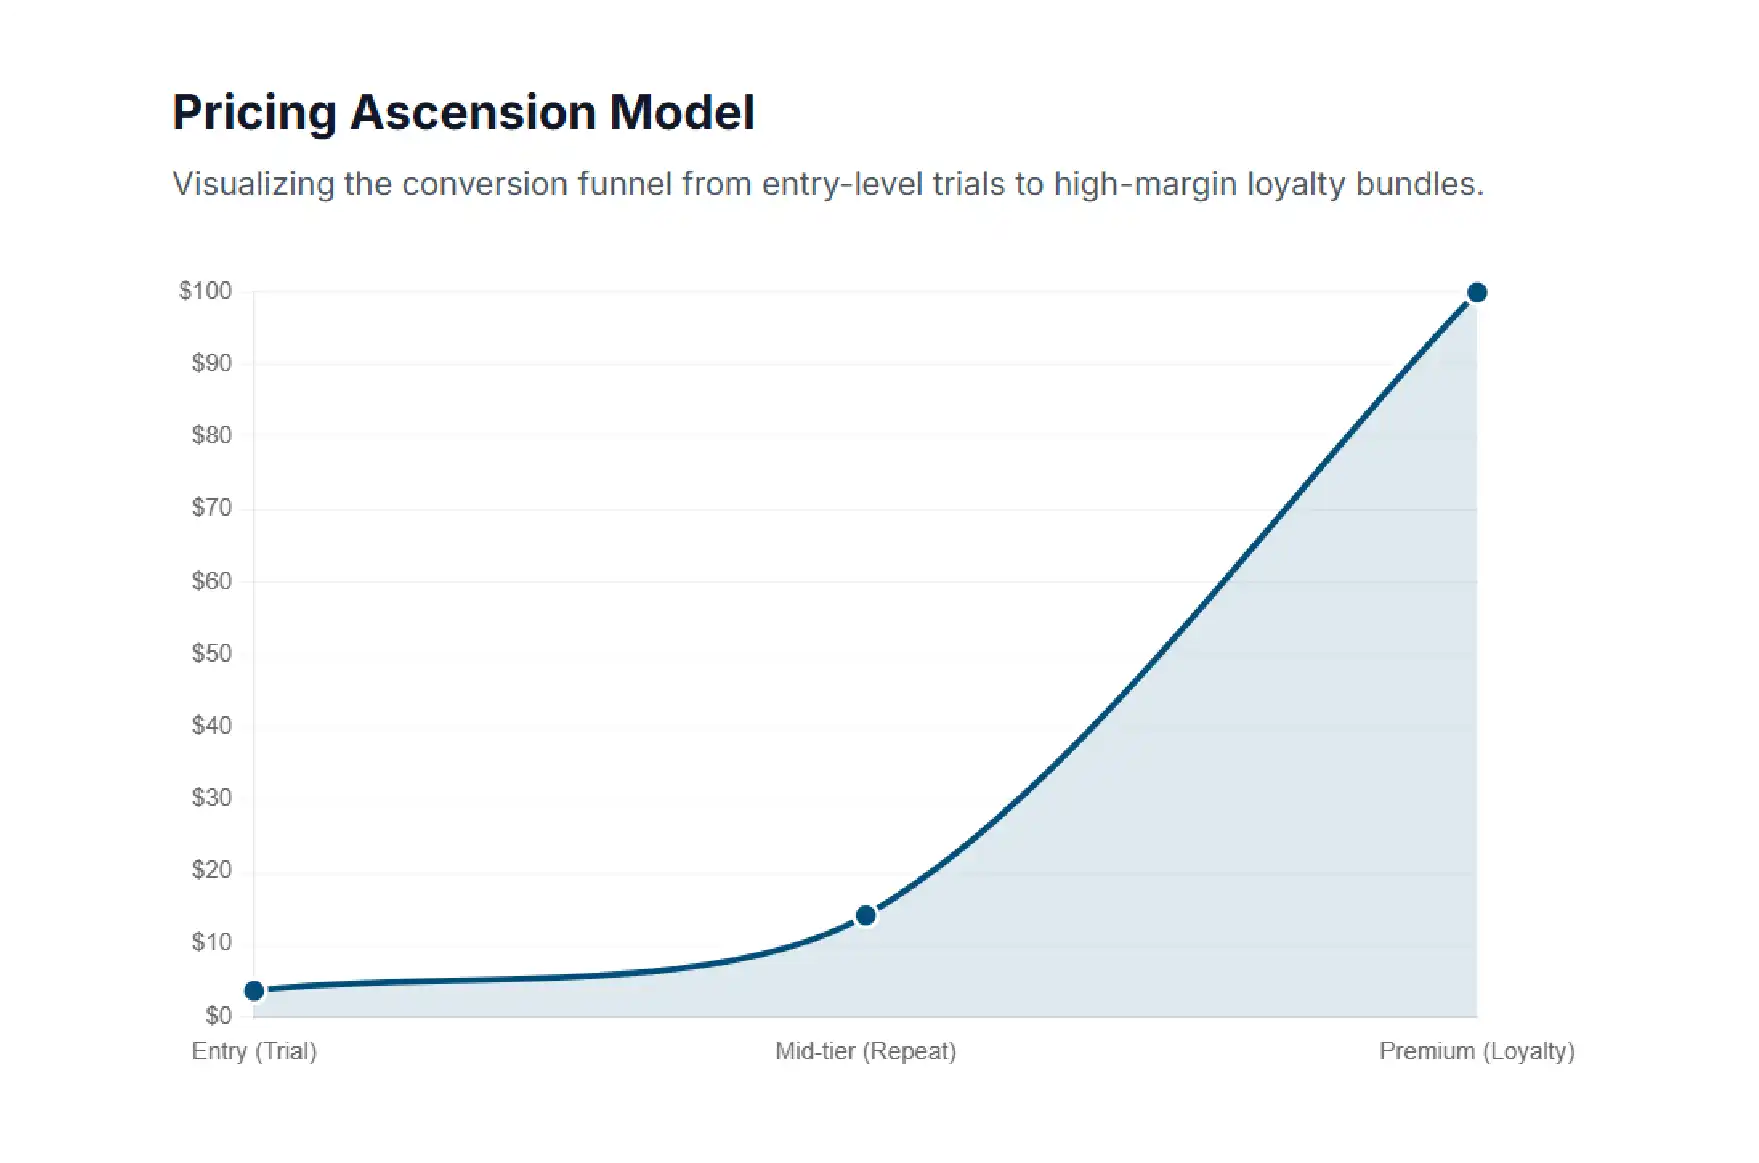
Liquid I.V.'s pricing is not a single sticker; it is a deliberate ladder that meets a shopper at every level of commitment. The structure breaks cleanly into three tiers, each doing a specific job in the funnel.
| Tier | Configuration | Price | Funnel Job |
|---|---|---|---|
| Entry | Single-serve packets | from $3.59 | Low-risk trial |
| Mid-tier | 14–16 serving packs | $8 – $20 | Everyday repeat buyer |
| Premium | 50-count bundles | up to $99.97 | High-margin loyalty |
The entry packet exists to remove friction: at well under five dollars, trying the brand is almost an impulse decision. The mid-tier packs capture the everyday buyer who has decided they like it. The premium bundles lock in the loyalist at the best per-serving value while delivering the brand its highest-margin order. Read top to bottom, this is a textbook ascension model — and it is fully visible to anyone who scrapes and organizes the price field across the catalog.
Individual price points are useful, but the blended average across the catalog is where the strategy becomes measurable. Across all 48 products, the average selling price lands at $33.46 — far closer to the mid and premium tiers than to the $3.59 entry packet.
That number is a quiet confession of confidence. A catalog whose blended price sits this high is not relying on cheap trials to survive; it is successfully moving customers up the value ladder and keeping them at the larger pack sizes. For a competitor, the $33.46 figure is a benchmark: it reveals the price altitude at which the category leader actually does business, which is the level you must either match on value or deliberately undercut. Without scraping the full assortment, you would never see this average — you would only see whichever single price the listing happened to show you.
THE COMPETITIVE REALITY
While you debate whether to invest in retail intelligence, your competitors are already pulling this data. Every week without a structured view of your category is a week of decisions made on guesswork instead of signal.
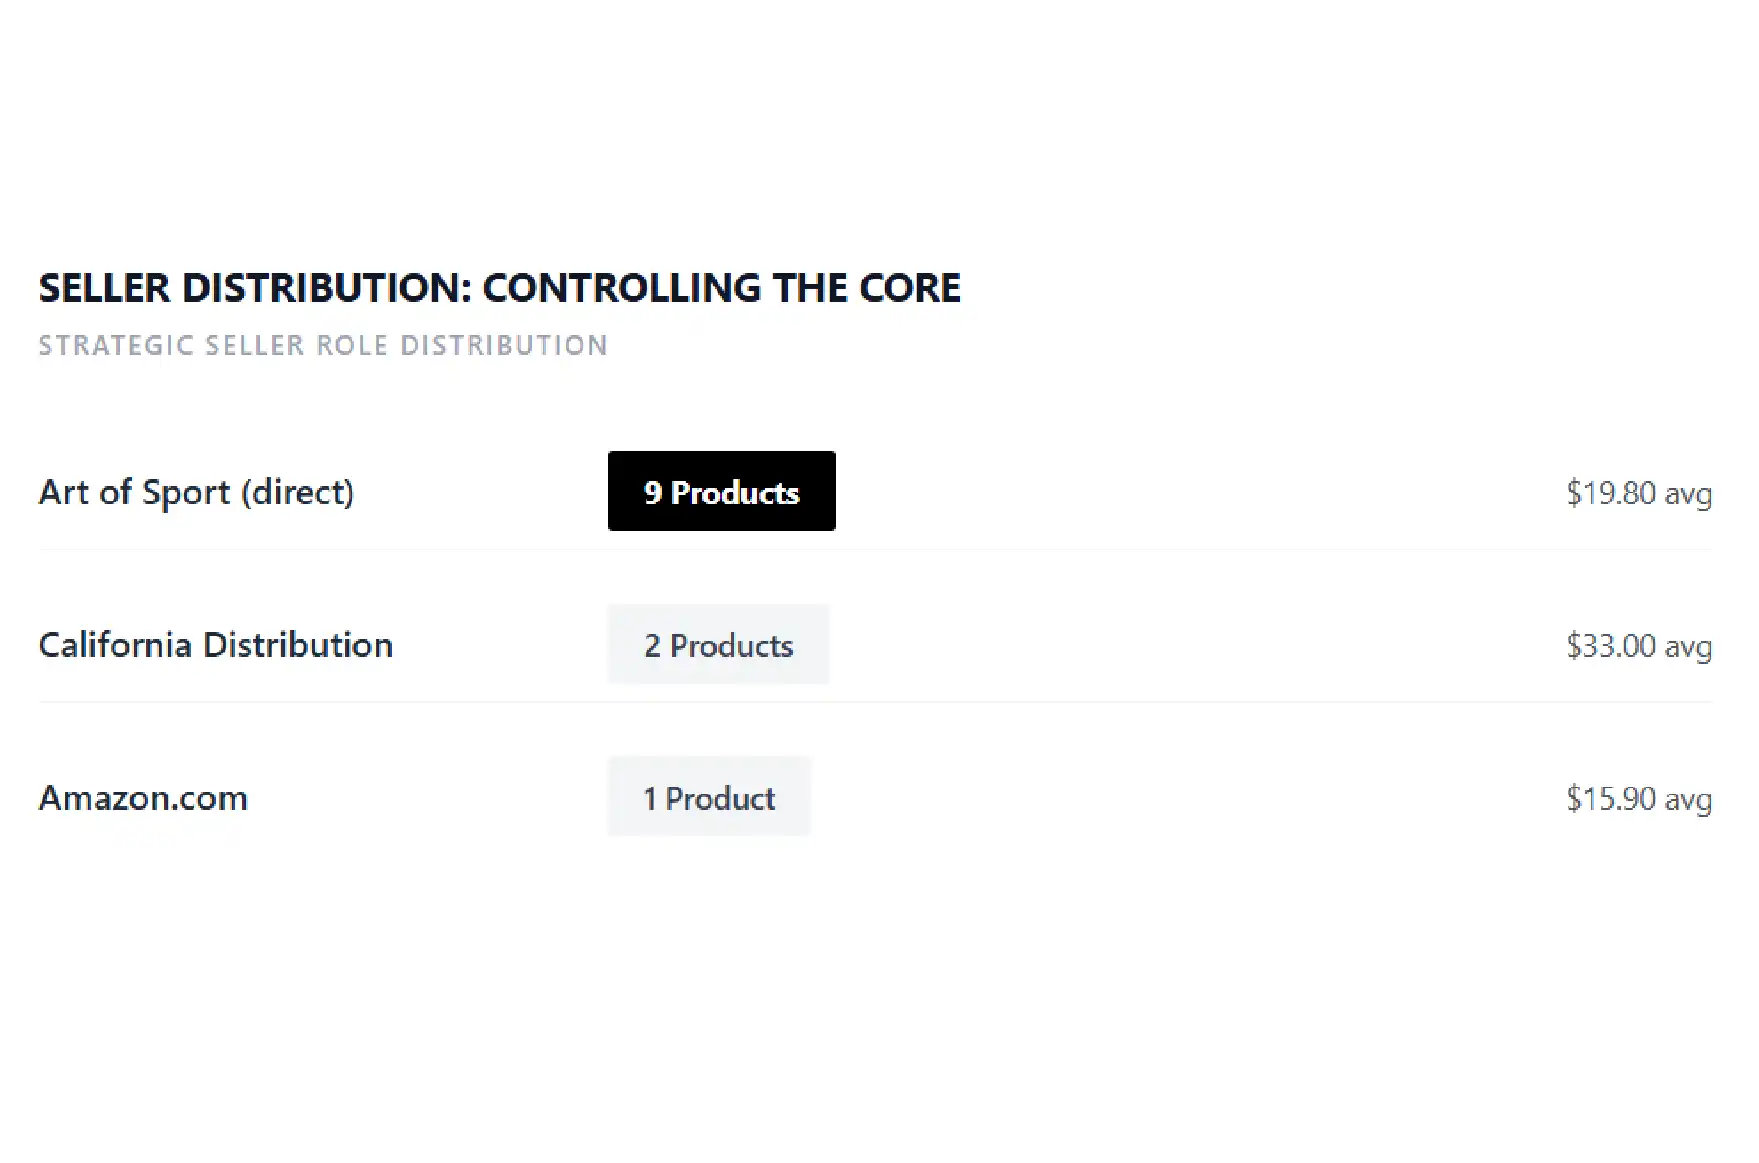
Most analyses stop at celebrating the 283,000-review flavor as proof of dominance. We read the same signal differently — and this is the angle the surface-level scoreboard misses entirely. When a single SKU accounts for the overwhelming majority of a brand's social proof and search visibility, that asset is not just a strength; it is a single point of failure.
Consider the exposure. If that one listing is suspended, hijacked by a counterfeit seller, hit with a wave of negative reviews, or loses its Buy Box, a disproportionate share of the brand's momentum evaporates overnight. A catalog that looks healthy in aggregate can be dangerously fragile at the SKU level. Concentration this extreme demands active monitoring, not a victory lap.
There is also a data-integrity twist that only proper scraping can resolve. Amazon frequently pools reviews across a parent listing's variations. A flavor that appears to have 283,000 reviews of its own may, in reality, be inheriting feedback from an entire variation family. That distinction completely changes the strategic read: a genuinely standalone hero product is a different bet than a number inflated by pooled variations. A dashboard that reads one page in isolation cannot tell the difference. A pipeline that resolves parent-child relationships explicitly — the way ours does — can. The lesson for any brand is the same: measure concentration, then stress-test what is really behind it, because the number that looks like your greatest strength may be the thing most worth protecting.
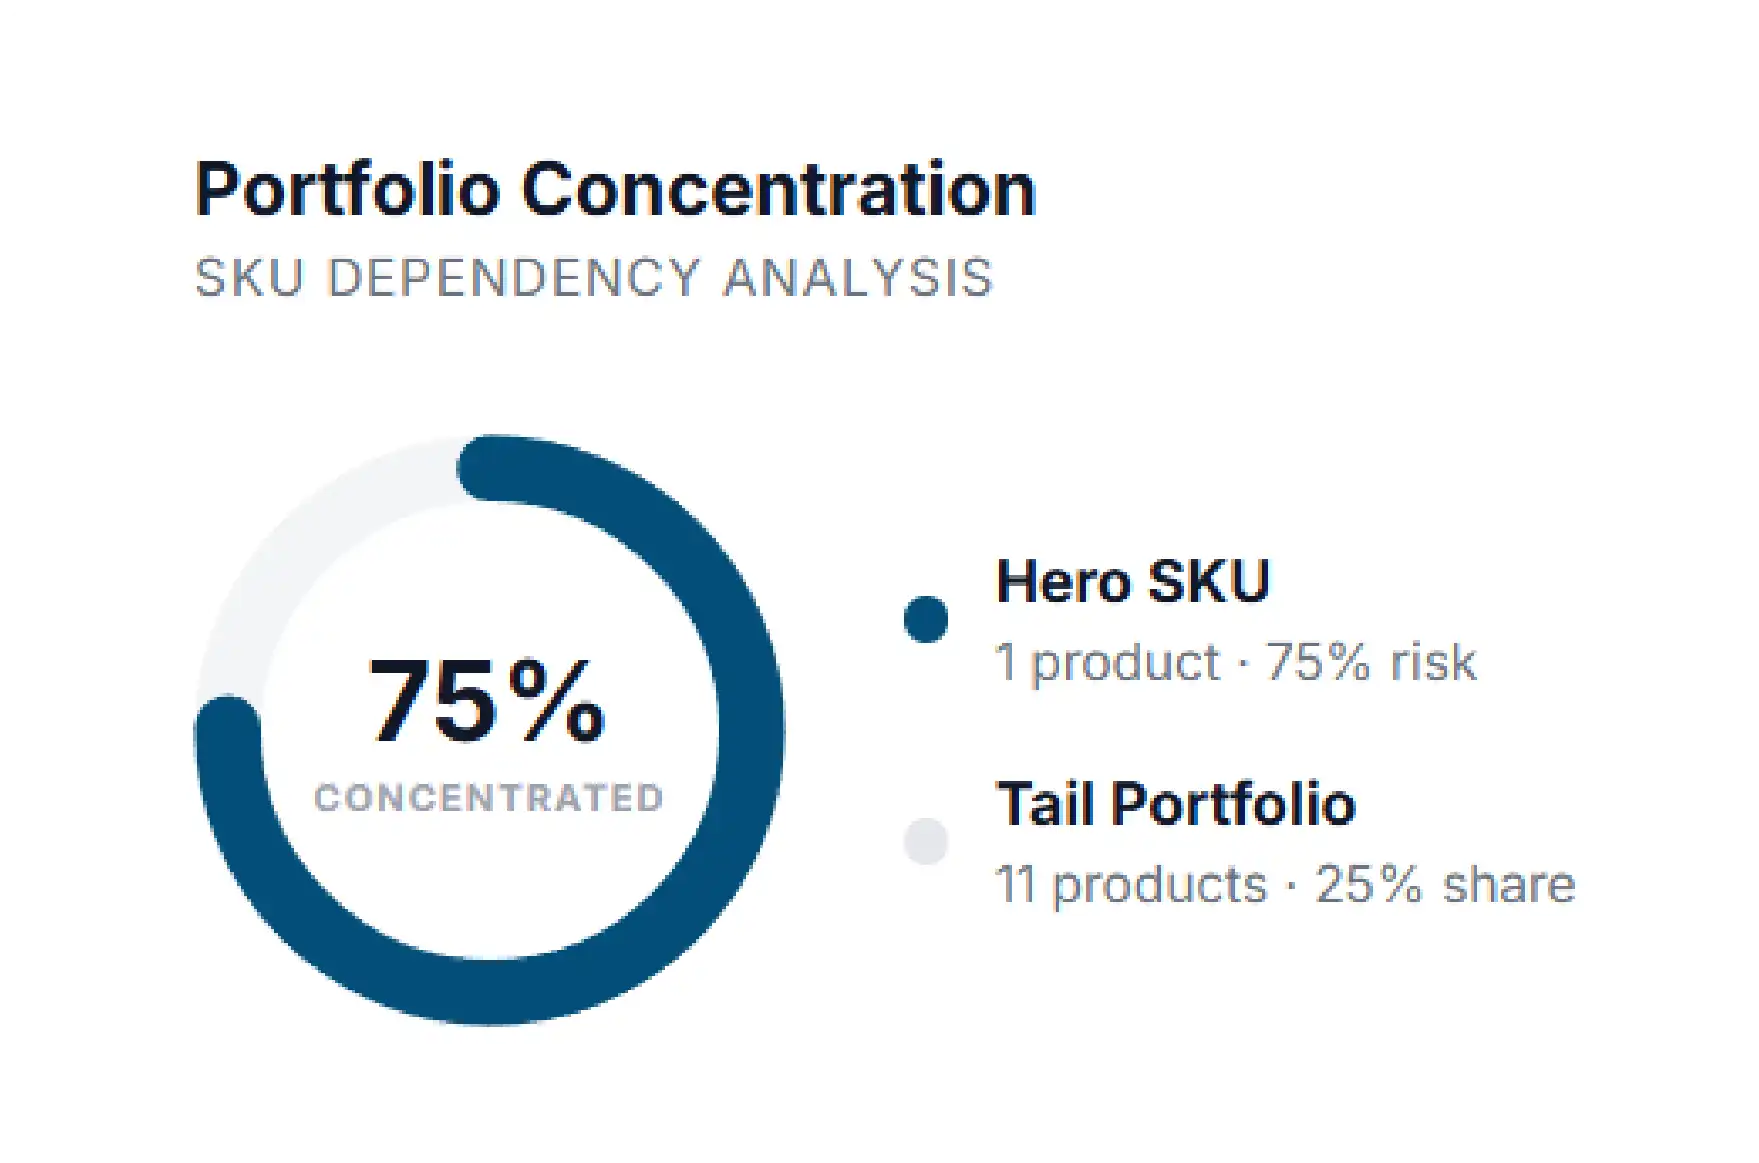
Below is a representative slice of the structured dataset this analysis was built on. Each record is the kind of clean, comparable row our pipeline delivers — the raw material behind every finding above.
| ASIN | Product | Category | Price | Rating | Reviews | Tier |
|---|---|---|---|---|---|---|
| B07XILxxxx | Hydration Multiplier — Popsicle Firecracker | Electrolyte Mix | $24.99 | 4.6 | 283,288 | Hero |
| B08TANxxxx | Hydration Multiplier + Immune — Tangerine | Immune Support | $19.74 | 4.5 | 21,941 | Mid |
| B09SNGxxxx | Hydration Multiplier — Single Stick | Electrolyte Mix | $3.59 | 4.4 | 9,612 | Entry |
| B08MIDxxxx | Hydration Multiplier — 16-Stick Pack | Electrolyte Mix | $17.49 | 4.6 | 48,205 | Mid |
| B09ENGxxxx | Energy Multiplier — Yuzu Pineapple | Energy | $22.49 | 4.4 | 6,338 | Mid |
| B0APRExxxx | Hydration Multiplier — 50-Count Bundle | Electrolyte Mix | $99.97 | 4.7 | 12,704 | Premium |
| B0BSLPxxxx | Hydration Multiplier — Sleep | Wellness | $26.99 | 4.3 | 4,517 | Mid |
ASINs shown are illustrative placeholders; values reflect the structure and scale captured during analysis.
The point of this exercise is never the spreadsheet — it is the decisions the spreadsheet makes possible. The same six findings translate directly into moves a brand or a challenger can act on this quarter.
None of these moves require insider information. They require the discipline to collect public signals reliably and read them honestly — which is the difference between a brand making decisions and a brand making guesses.
We exist to remove the hardest part of this work: the pipeline. Our clients do not maintain scrapers, fight CAPTCHAs, or wonder whether a blank cell is a real zero or a silent failure. They receive clean, validated, decision-ready retail intelligence on a schedule that fits their planning cycle.
That means resolved parent-child variation mapping so review counts are never misattributed, timestamped pricing so your snapshots are defensible, and quality assurance on every record so the analysis rests on data you can trust. Whether you need a one-time competitive teardown or continuous Amazon brand monitoring across a category, the infrastructure headache is ours, and the decisions are yours.
Want to see what this looks like for your category? We will pull a structured 50-product dataset at no cost.
Email info@iwebdatascraping.com with the subject line “Sample Dataset” and tell us the brand or category to analyze.
Start a projectCollecting publicly available product information — prices, ratings, review counts, and listing details — is a widely used practice for competitive and market research. We focus exclusively on public data, follow responsible collection practices, and never touch private or personal information. We are happy to discuss the specifics of your use case.
As fresh as you need it. Because marketplace prices and availability shift constantly, we schedule collection at the cadence that matches your decisions — daily, weekly, or on demand — and timestamp every record so you always know exactly when a value was captured.
This is one of the most common places DIY projects go wrong. We resolve parent-child listing relationships explicitly, so a flavor variation is never counted as an independent product and pooled reviews are flagged rather than double-counted. That is what makes a concentration metric trustworthy.
Yes. While this case study focuses on Amazon, the same approach applies to Target, Walmart, and other major retailers, as well as cross-retailer comparisons. If your category lives across multiple storefronts, we can give you one unified view.
Clean, structured files ready for analysis — typically spreadsheets or a feed into your existing tools. The deliverable is built so a strategist can use it immediately, without a data-engineering step in between.
It depends on the number of products, the refresh frequency, and the retailers involved. We scope each engagement to your needs and pricing is predictable — no hidden engineering hours. Reach out for a quote tailored to your category.