
42.8K+
RERA PROJECT RECORDS PROCESSED

Automated RERA Data Collection for Real Estate Risk and Lending Intelligence Through Project Monitoring and Developer Performance Analytics
This case study presents a real-world enterprise scenario where a lending and real estate intelligence organization implemented an automated data extraction framework to collect, normalize, monitor, and analyze regulatory real estate information for credit-risk assessment, project monitoring, and lending decisions.
The solution is designed for organizations that require continuous visibility into project registrations, construction progress, approvals, developer information, completion timelines, project status, regulatory disclosures, and other publicly available real estate signals.
Automated RERA Data Collection for Real Estate Risk enables lending organizations to transform fragmented regulatory information into structured intelligence that can support underwriting, portfolio monitoring, early-warning systems, and risk prioritization.
It is designed for:
Automate RERA data collection for lending risk helps lenders replace repetitive manual searches with an organized intelligence framework capable of continuously processing project-level information and delivering structured data for risk analysis.
The core objective of the initiative was to establish a reliable data layer that could help lending teams move beyond static property information and evaluate the broader factors influencing project and developer risk.
The real estate lending environment depends heavily on the quality, timeliness, and completeness of project information. Lenders frequently need to evaluate whether a project is progressing according to declared timelines, whether its registration remains active, how the developer has performed across projects, and whether regulatory information indicates potential risk.
The organization implemented RERA data scraping for real estate lenders to systematically collect project registrations, developer details, project locations, registration status, timelines, completion information, and other relevant regulatory fields from available RERA information sources.
The objective was not simply to collect records but to transform them into a structured intelligence layer that could support lending analytics, portfolio monitoring, and risk assessment.
The system processed thousands of project records and standardized information across different geographic markets. Data was categorized by project, developer, location, registration status, construction stage, expected completion date, and other risk-relevant attributes.
RERA project data for lending analytics provided the foundation for comparing projects, identifying delayed developments, evaluating developer-level patterns, and creating early-warning indicators for lending teams.
The client was a real estate lending intelligence organization responsible for evaluating and monitoring projects across multiple markets. Its risk teams depended on regulatory and project information to support underwriting, credit reviews, collateral assessment, and portfolio monitoring.
However, the available information was fragmented across project records and required significant manual effort to collect and interpret.
One of the most important requirements was to Automate real estate project risk monitoring so that analysts could continuously identify changes in project status, construction progress, registration information, and completion timelines without repeatedly reviewing individual records.
A second challenge involved developing Real estate risk analytics using RERA data because project records contained large quantities of information but were not always available in a standardized analytical format. Different projects could contain variations in terminology, field structures, dates, developer names, and location descriptions.
Another major requirement was to Track Project Delays and Builder Performance across a portfolio rather than evaluating every project independently. The client needed to determine whether delays were isolated incidents or recurring patterns associated with particular developers, locations, or project categories.
The client faced several additional challenges:
The client therefore required an automated architecture capable of collecting project information at scale, cleaning and normalizing the records, connecting projects with developers and locations, and generating structured outputs suitable for risk analytics.
The organization replaced fragmented research workflows with an automated data intelligence pipeline designed to continuously process regulatory project information.
The system established a structured flow covering data collection, normalization, validation, project matching, developer mapping, risk indicators, and analytical reporting.
| Dimension | Manual RERA Monitoring | Automated RERA Intelligence System |
|---|---|---|
| Data collection | Individual project searches | Automated multi-project data collection |
| Coverage | Limited by analyst capacity | Large-scale portfolio coverage |
| Data frequency | Periodic manual checks | Scheduled and continuous updates |
| Project status | Manually reviewed | Structured status monitoring |
| Developer mapping | Spreadsheet-based matching | Automated developer-project association |
| Delay identification | Analyst interpretation | Timeline comparison and risk indicators |
| Data cleaning | Manual formatting | Automated normalization and validation |
| Location analysis | Basic project address review | Structured geographic segmentation |
| Historical comparison | Difficult across spreadsheets | Centralized historical records |
The automated approach allowed the client to create a consistent project intelligence framework rather than treating each project as an isolated research exercise.
The brand in focus is a real estate lending and digital intelligence organization supporting institutions involved in property finance, project lending, investment evaluation, and real estate portfolio management.
The organization operates in a data-intensive environment where lending decisions require visibility into both individual projects and broader market patterns. Its teams monitor project registration information, developers, locations, project timelines, construction indicators, and regulatory disclosures to evaluate exposure and identify potential risks.
As the number of projects under consideration increased, the organization recognized that manual collection could not provide sufficient scale or consistency.
A single lending portfolio could contain hundreds or thousands of projects across different cities and development categories. Each project could also have changing information that required periodic review.
We delivered an end-to-end data intelligence framework designed to transform publicly available RERA project information into structured datasets for real estate lending and risk analytics.
The solution began with automated collection of project-level information, including project names, registration identifiers, developer details, locations, project categories, registration dates, expected completion dates, status indicators, and other relevant publicly available fields.
Real estate data scraping formed the foundation of the collection layer, allowing the system to process large volumes of project information and transfer records into a centralized analytical environment.
The system then performed data normalization to standardize project names, developer names, locations, dates, registration identifiers, and status classifications. Duplicate records were identified and consolidated to create cleaner project-level datasets.
A dedicated Real Estate Property data Scraper architecture was incorporated to organize property and project information into structured records suitable for downstream analytics, portfolio segmentation, and reporting.
The solution connected project information with developer profiles, locations, project timelines, and historical records. This created a multi-dimensional intelligence model that allowed risk teams to compare projects and identify recurring patterns.
The processing layer also included validation rules designed to identify incomplete records, inconsistent dates, duplicate project entries, abnormal timeline values, and other data-quality issues.
Risk-oriented indicators were subsequently generated from the structured dataset. These indicators could include project-age signals, timeline variance, status changes, developer-level project patterns, geographic exposure, and other portfolio monitoring attributes.
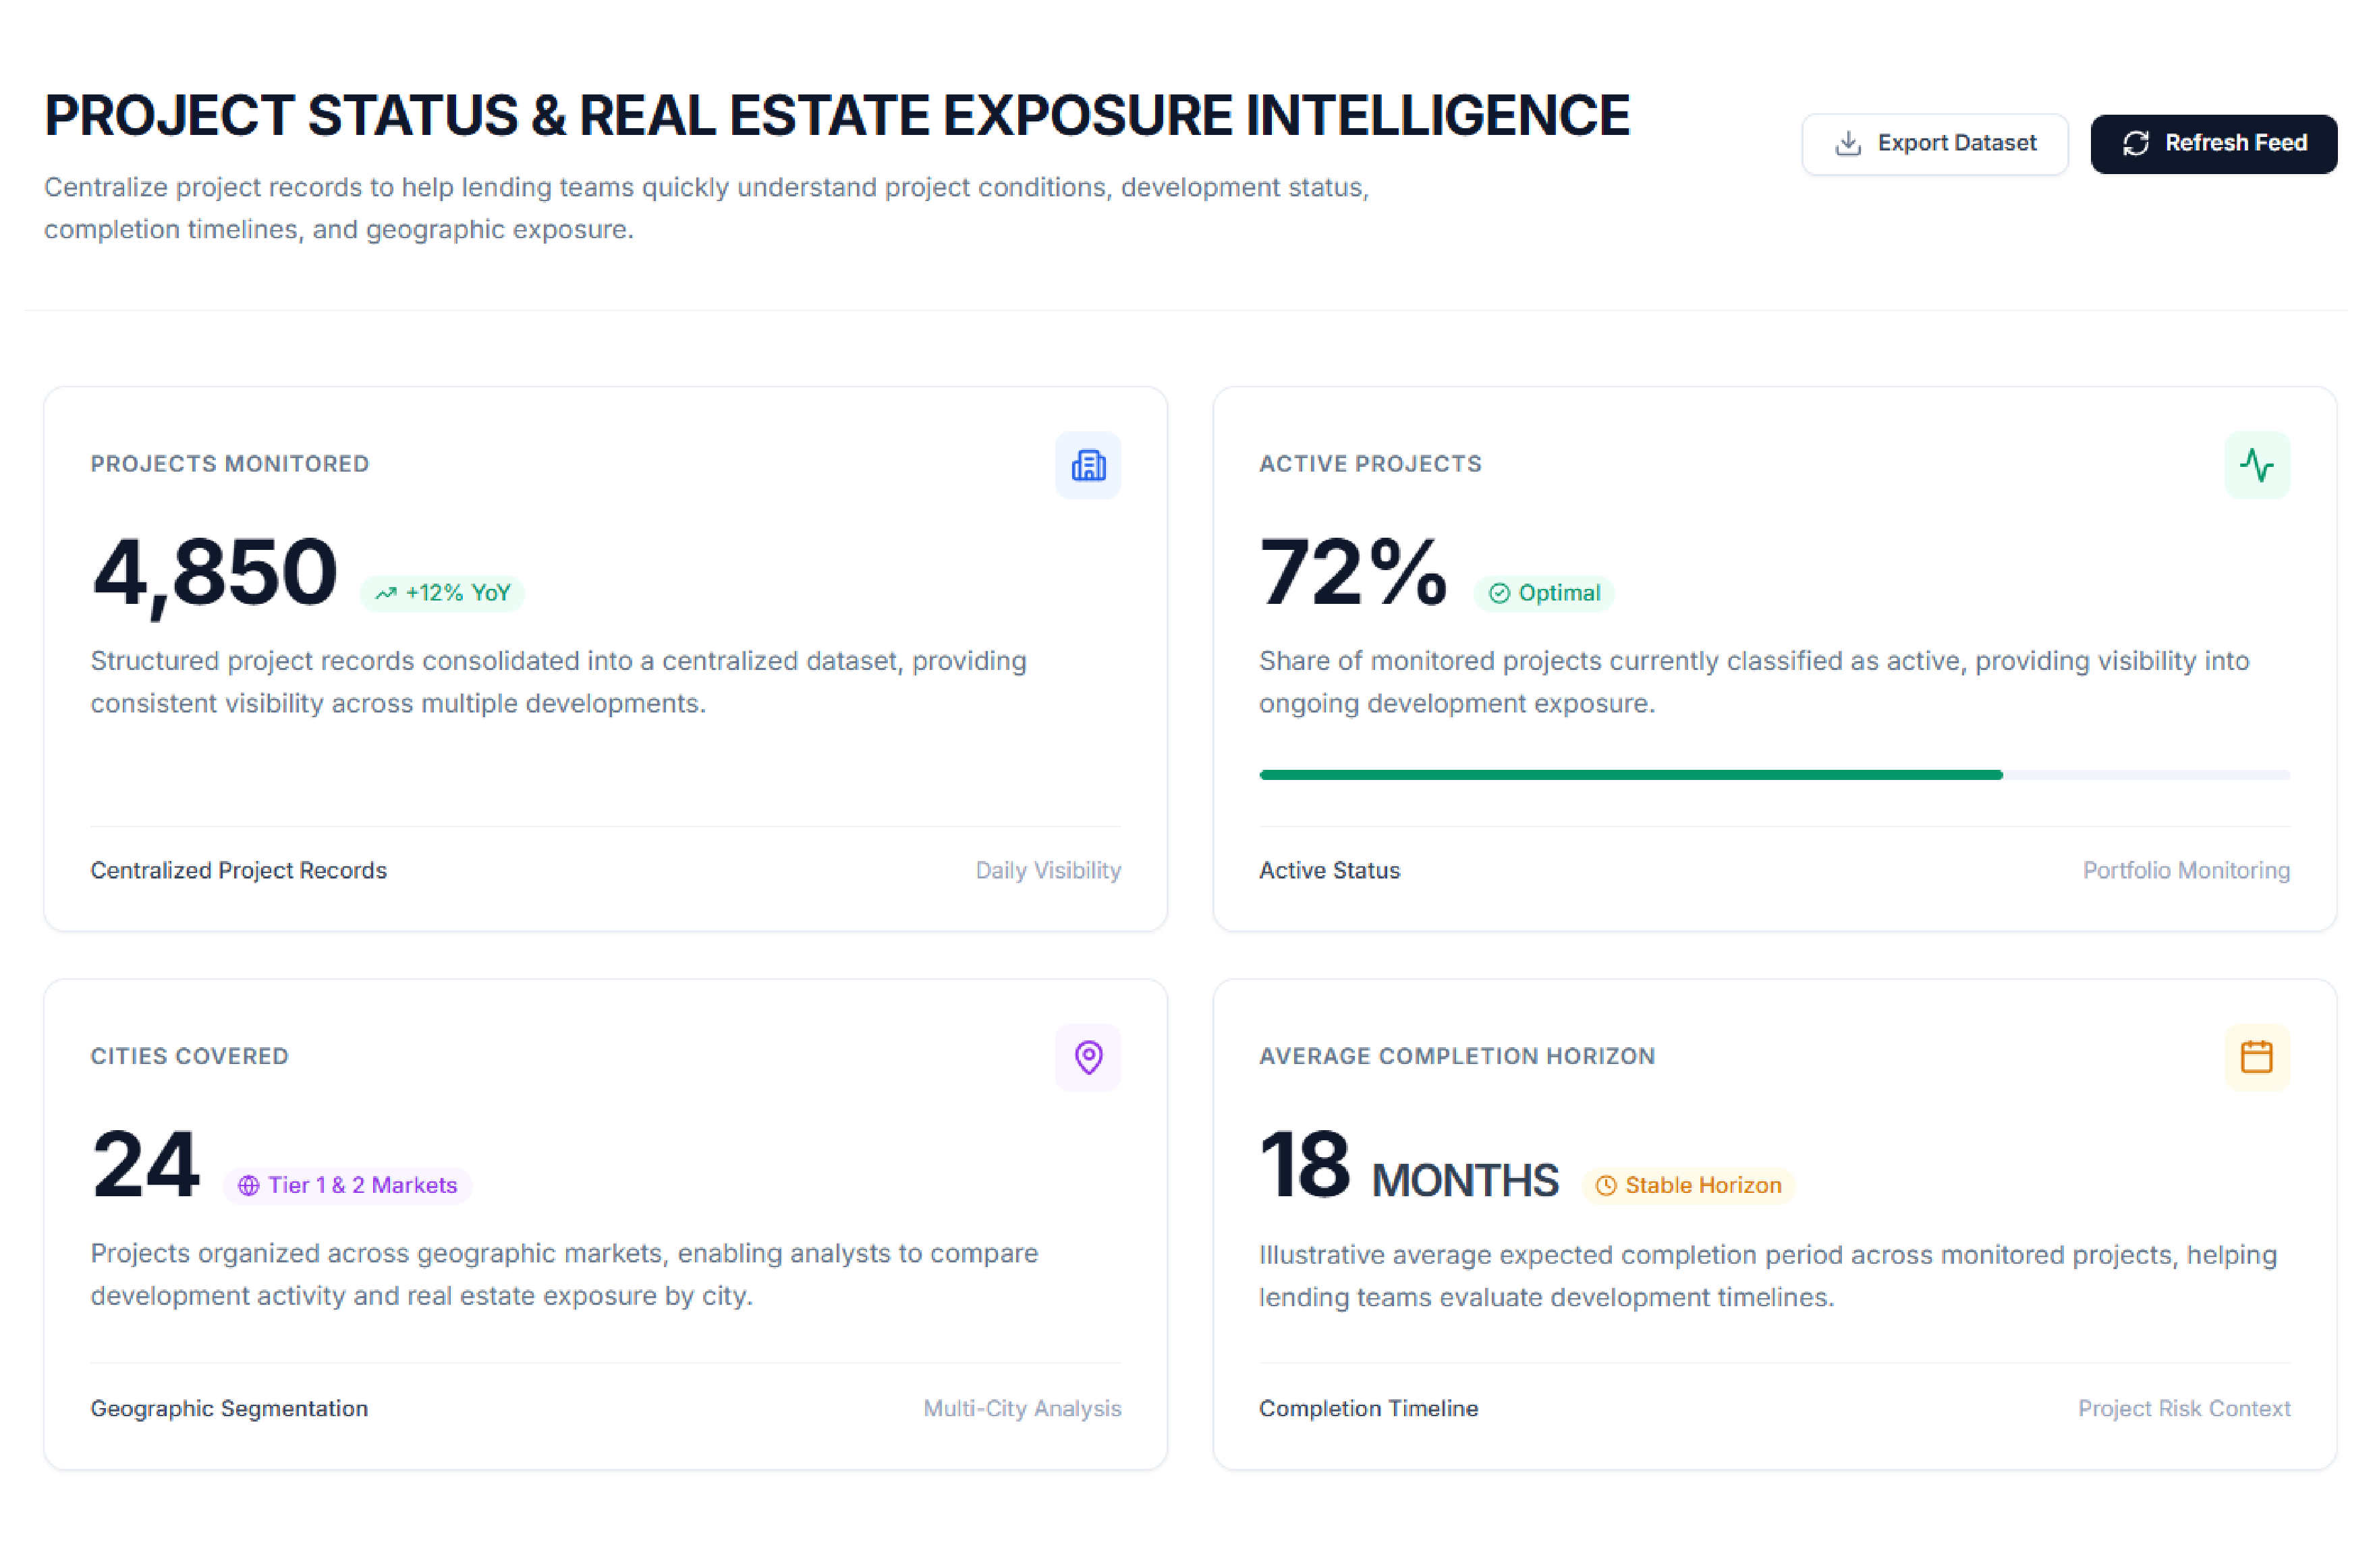
The automated collection framework significantly improved visibility into project-level information.
Instead of relying on individual searches, analysts could access structured project records through a centralized dataset. Project registration details, locations, developer information, completion timelines, and status indicators were organized consistently.
This improved the speed at which lending teams could understand project conditions before making decisions.
The structured approach also made it easier to compare projects across cities and development categories.
For example, analysts could segment projects according to active status, expected completion period, developer, geographic market, and project age.
This created a more comprehensive view of real estate exposure.
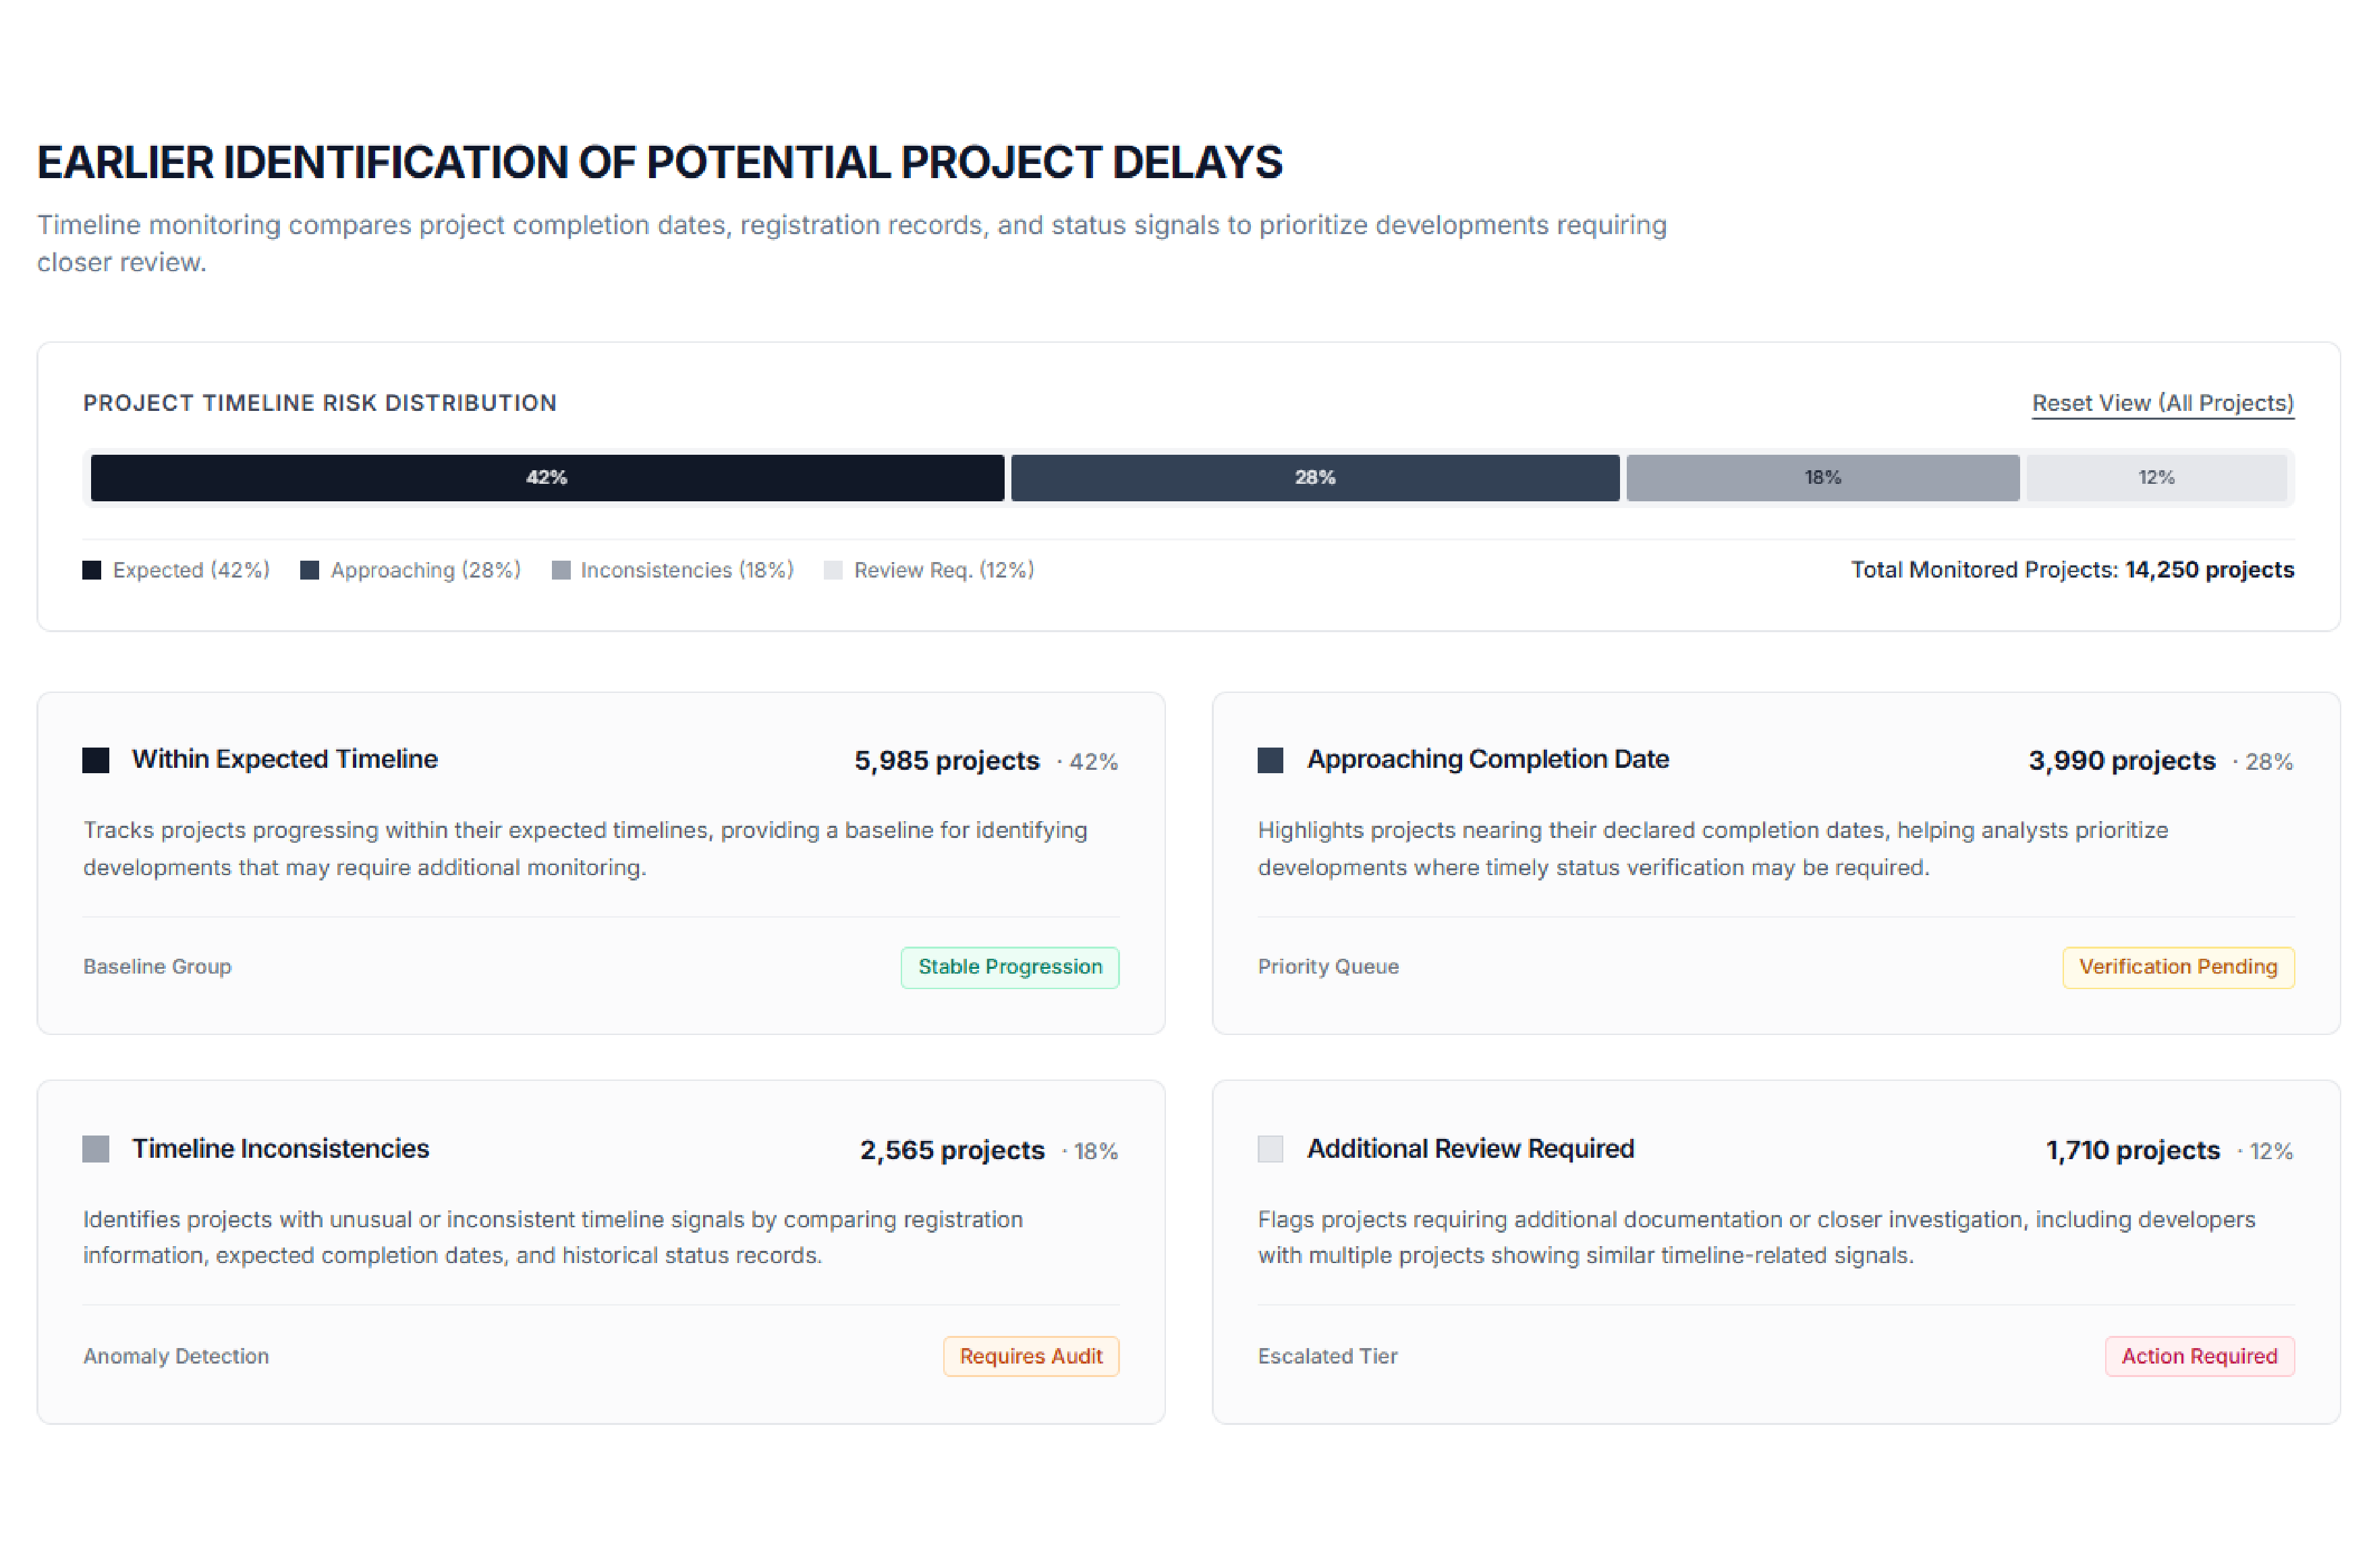
One of the strongest benefits of the system was its ability to compare project timelines and identify records requiring closer review.
When expected completion dates, registration information, and status signals were structured consistently, analysts could identify projects with unusual timeline characteristics.
Instead of discovering potential issues during a periodic manual review, the system could prioritize projects according to predefined monitoring rules.
The resulting framework helped lenders distinguish between:
This supported a more proactive approach to portfolio management.
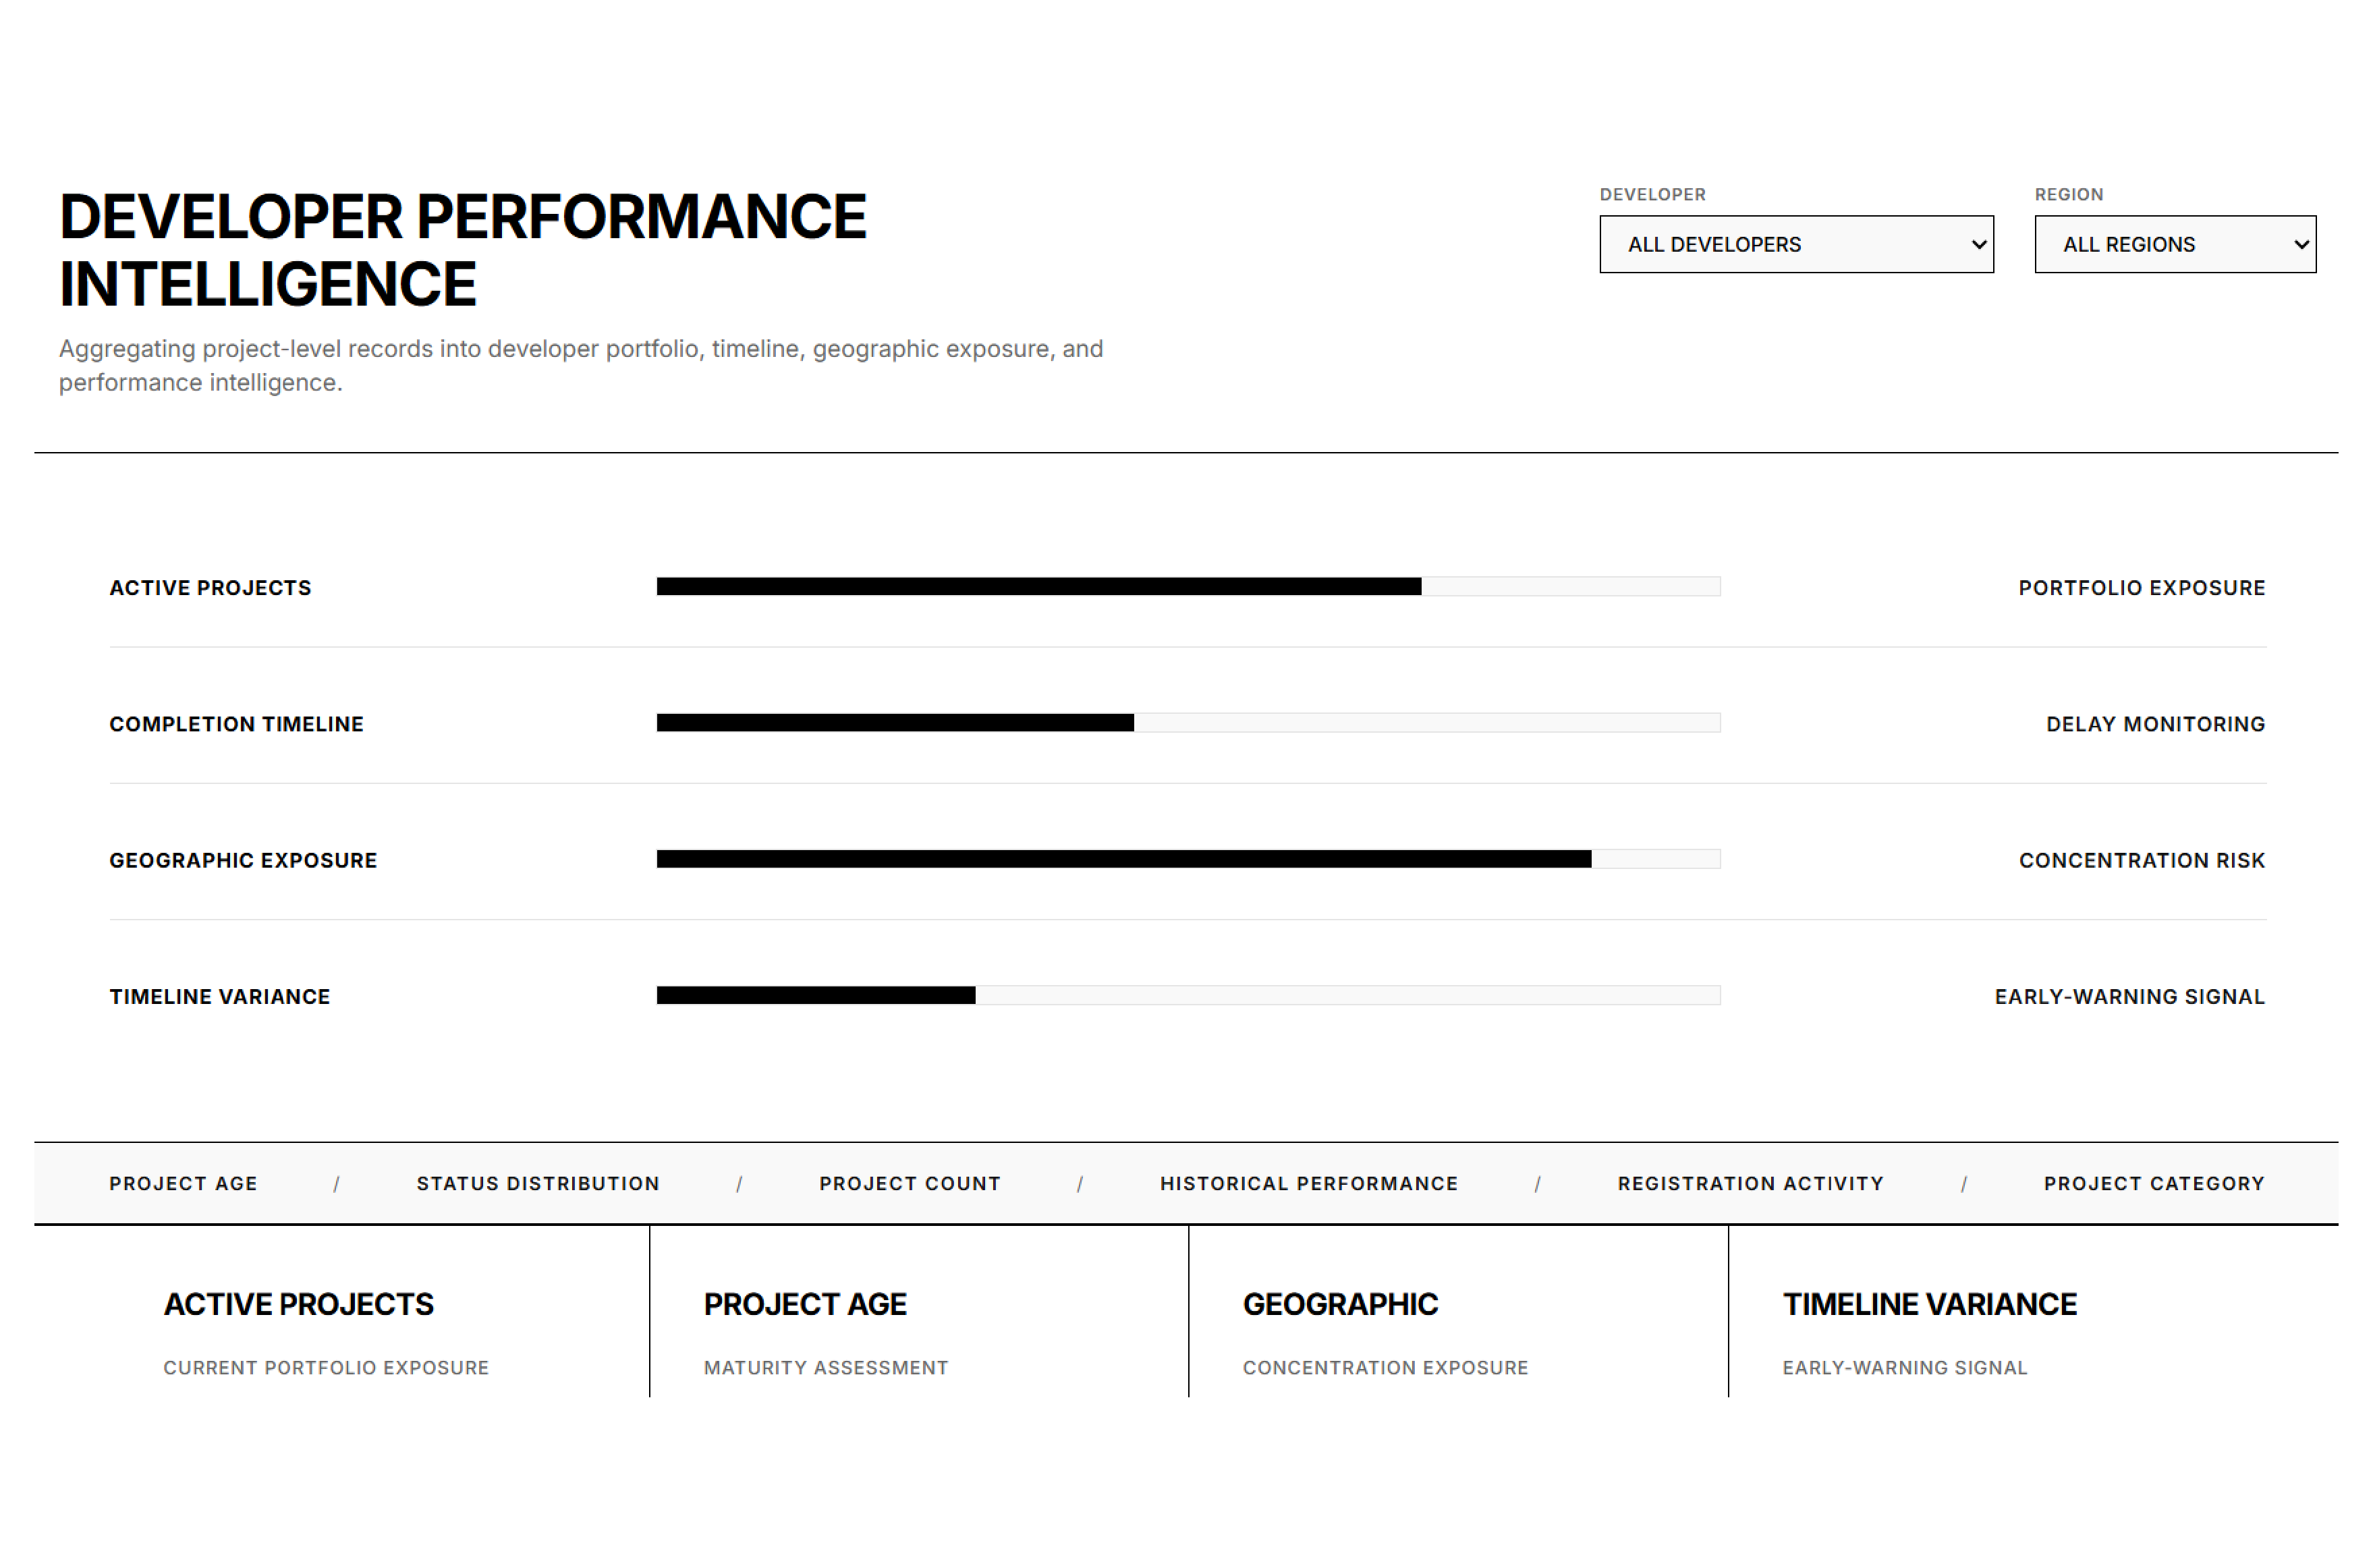
Project-level information became significantly more useful when connected to developer-level records.
The system consolidated projects associated with the same developer, enabling analysts to evaluate patterns across multiple developments.
A developer with a large portfolio could therefore be assessed through aggregate indicators rather than through isolated project reviews.
The analytical framework could examine:
| Metric | Captured Intelligence | Lending Relevance |
|---|---|---|
| Active Projects | Number of ongoing projects | Portfolio exposure |
| Project Age | Time since registration | Maturity assessment |
| Completion Timeline | Declared completion information | Delay monitoring |
| Status Distribution | Active, completed, or other available status categories | Portfolio quality |
| Geographic Exposure | Projects by city or region | Concentration risk |
| Project Count | Number of registered projects | Developer scale |
| Timeline Variance | Difference between expected and observed indicators | Early-warning signal |
| Historical Performance | Patterns across multiple projects | Developer assessment |
| Registration Activity | New and existing registrations | Pipeline visibility |
| Project Category | Residential/commercial or available classification | Exposure segmentation |
This created a more comprehensive developer intelligence layer for lending teams.
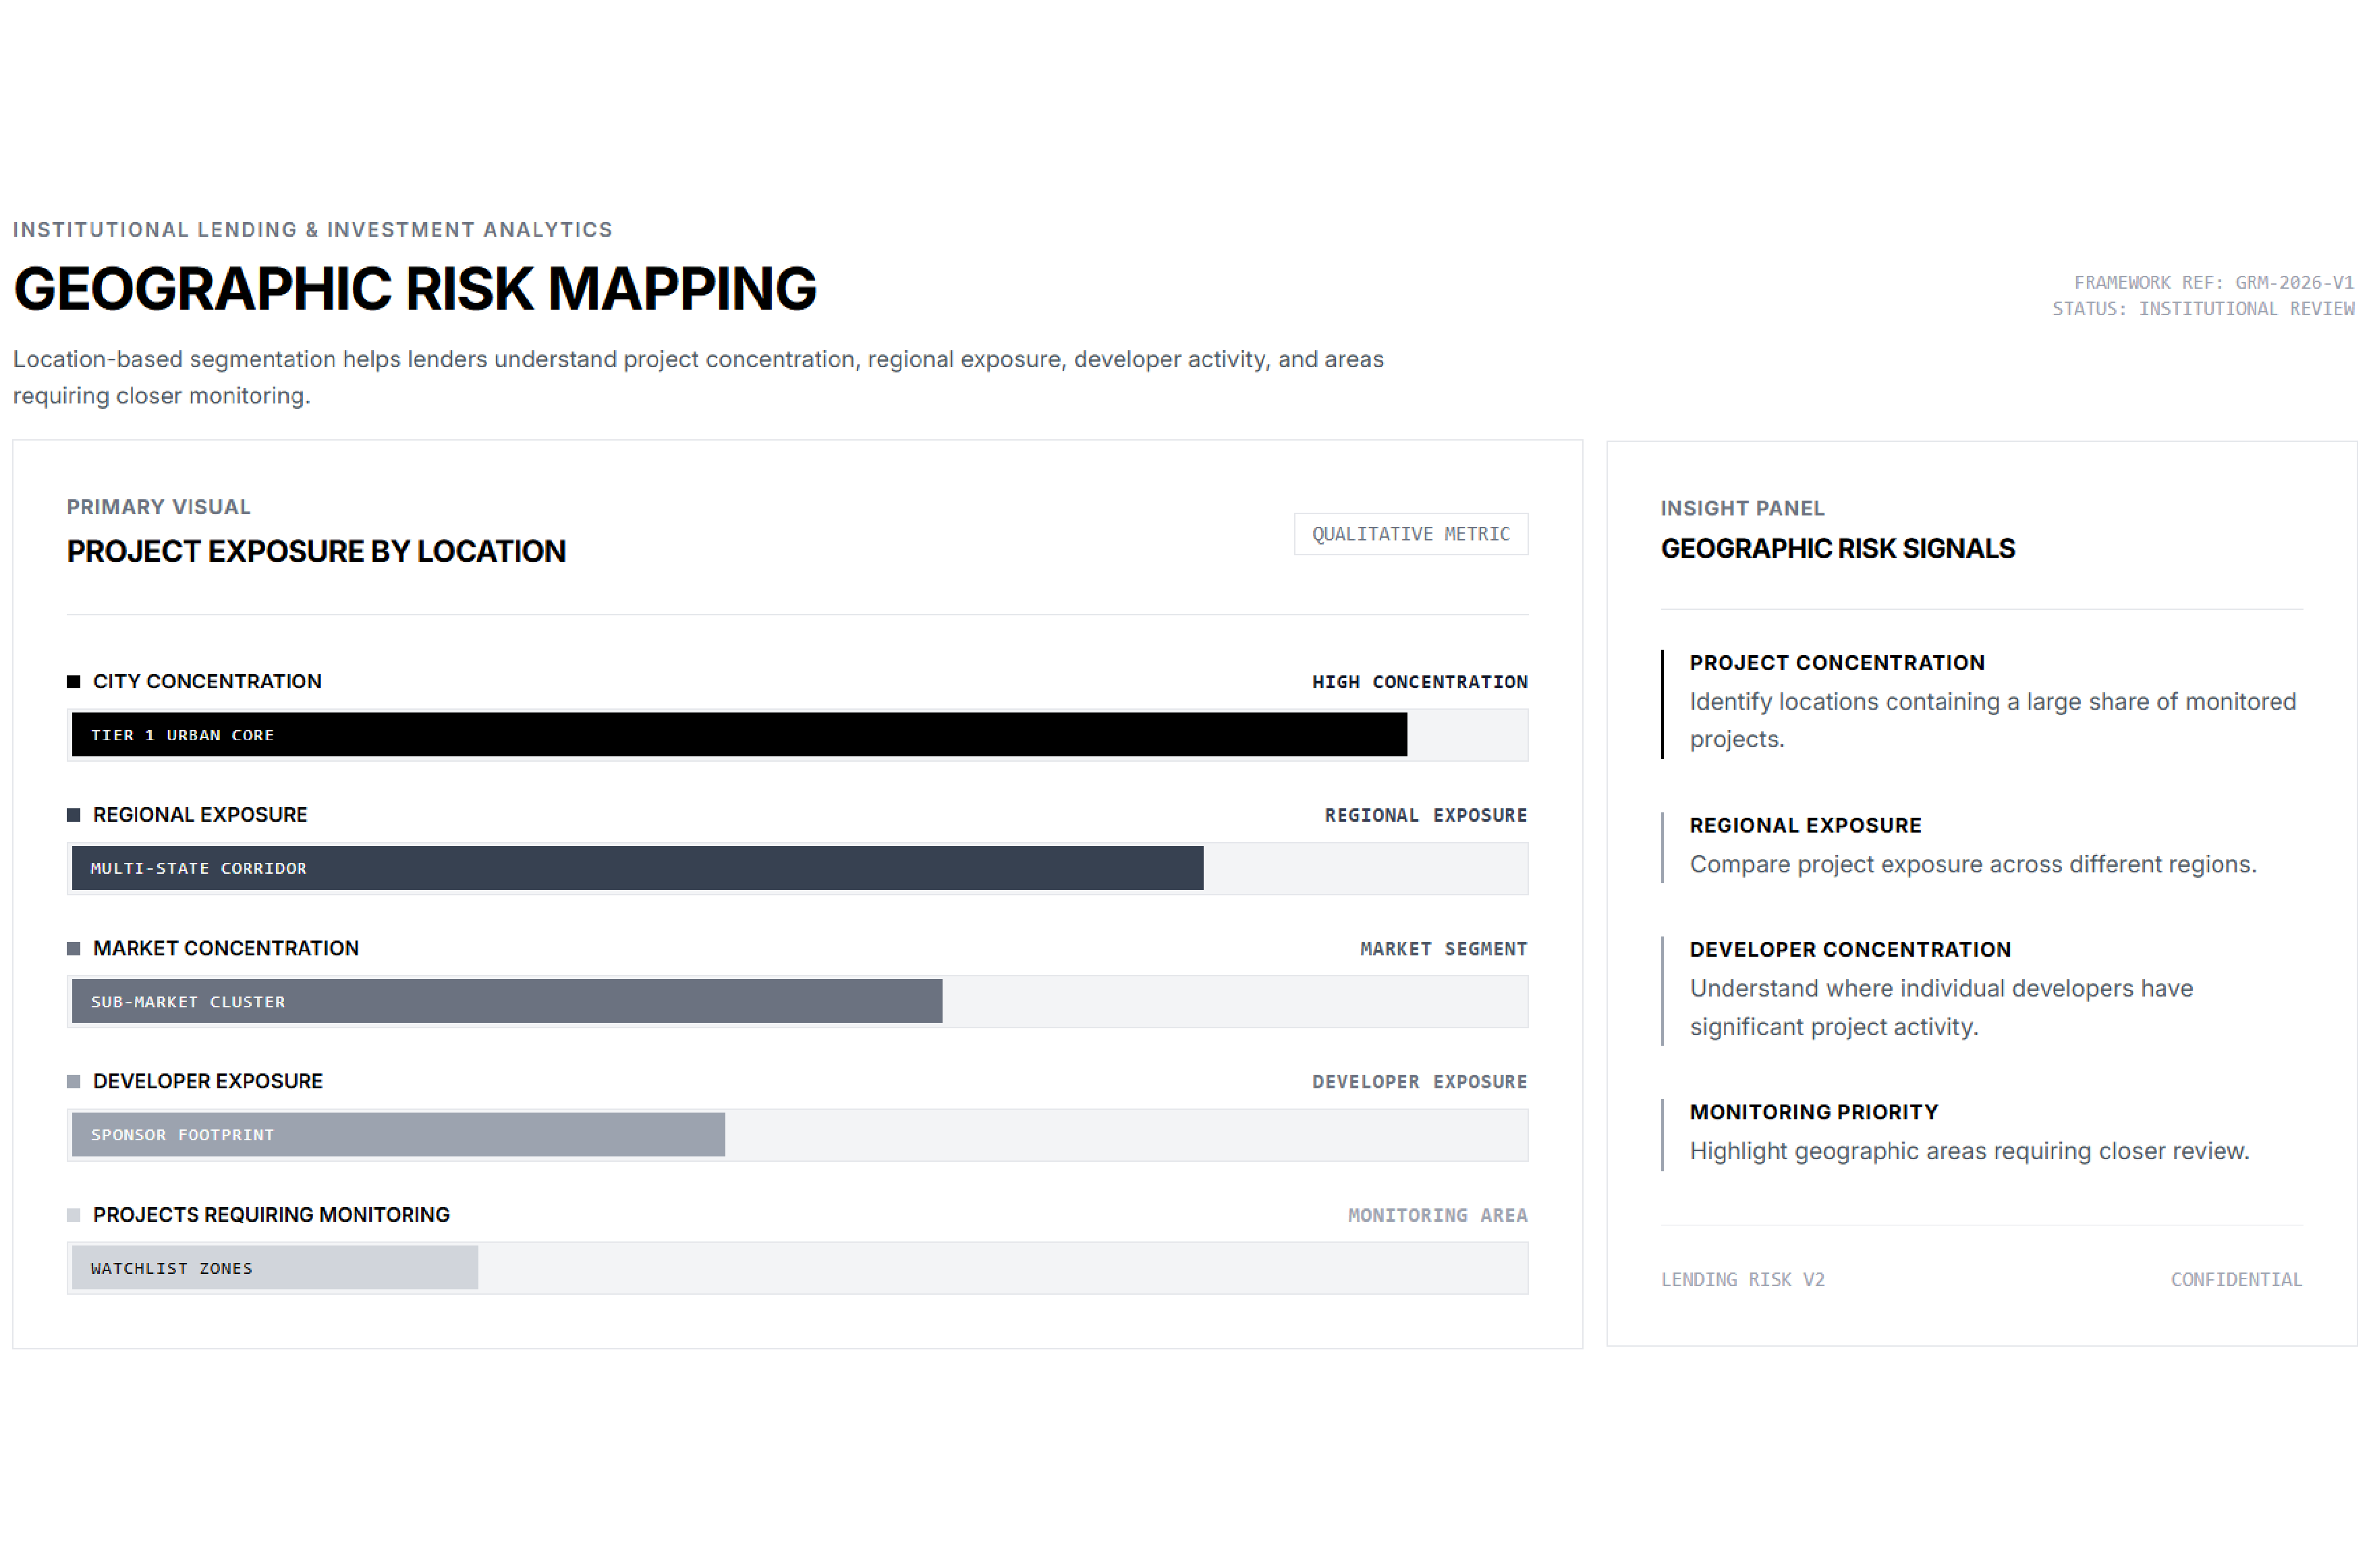
Real estate risk is closely connected with location.
The automated system standardized location information so that projects could be grouped according to city, region, market, and other available geographic attributes.
This allowed analysts to examine concentration across locations.
A lender could identify whether a large proportion of its project exposure was concentrated in a particular city or whether certain regions had higher concentrations of projects requiring monitoring.
Location-based segmentation also supported comparisons between project activity and developer exposure.
This transformed geographic information from a basic project attribute into a strategic risk intelligence dimension.
The following illustrative dataset demonstrates how structured RERA project intelligence can support lending risk analysis.
| Project Name | Developer | City | Registration Status | Expected Completion | Project Age | Risk Indicator | Exposure Score |
|---|---|---|---|---|---|---|---|
| Green Valley Heights | Godrej Properties | Pune | Active | Dec 2026 | 3.2 yrs | Moderate | 68 |
| Metro View Residences | Prestige Group | Bengaluru | Active | Jun 2027 | 2.1 yrs | Low | 42 |
| Riverfront Enclave | Lodha Group | Mumbai | Active | Mar 2026 | 4.4 yrs | High | 84 |
| Sunrise County | Sobha Limited | Hyderabad | Active | Nov 2026 | 3.8 yrs | Moderate | 63 |
| Urban Crest | Casagrand | Chennai | Active | Aug 2027 | 1.7 yrs | Low | 37 |
| Lakewood Towers | DLF Limited | Gurugram | Active | Feb 2026 | 4.8 yrs | High | 89 |
| Horizon Park | Brigade Enterprises | Pune | Active | Sep 2027 | 1.9 yrs | Low | 35 |
| Royal Habitat | ATS Infrastructure | Noida | Active | May 2026 | 4.1 yrs | High | 82 |
The sample demonstrates how multiple fields can be combined to create a lending-oriented project intelligence model.
The risk indicator does not represent a legal or financial conclusion. Instead, it illustrates how structured regulatory information can be organized for internal monitoring and further investigation.
After implementing automated RERA data collection and analytics, the client achieved measurable improvements in data accessibility, portfolio monitoring, and risk prioritization.
The broader business impact came from transforming project information into a reusable intelligence asset.
Instead of collecting information repeatedly for individual lending decisions, the client established a centralized data layer that could support multiple analytical workflows.
Our approach combines automated data collection, structured processing, data validation, entity matching, and analytical transformation to help real estate organizations convert fragmented project information into usable intelligence.
The framework supports large-scale collection while maintaining standardized structures across projects, developers, and locations.
It also reduces dependency on repetitive manual searches and spreadsheet-based consolidation.
For lending organizations, the greatest advantage is the ability to establish a repeatable monitoring framework.
Instead of treating every project review as a separate research assignment, teams can maintain centralized project datasets and continuously analyze changes across the portfolio.
The architecture can also support integration with dashboards, internal databases, analytical models, and reporting systems.
Data-quality processes further improve the reliability of downstream analysis by identifying duplicate, incomplete, inconsistent, or incorrectly formatted records.
The solution can be adapted to different project volumes, markets, data structures, and analytical requirements.
"We needed a more efficient way to consolidate real estate project information across our lending portfolio. The automated intelligence framework significantly reduced the amount of manual research required by our analysts and gave us a much clearer view of project timelines, developers, and geographic exposure. The structured datasets have improved our reporting workflows and made it easier to identify projects requiring additional review. The biggest benefit has been the ability to monitor a much larger portfolio without increasing manual effort at the same rate."
— Head of Real Estate Risk Analytics
The final outcome was a centralized and scalable real estate intelligence framework capable of converting regulatory project information into structured datasets for lending, underwriting, portfolio monitoring, and risk analytics.
The client gained improved visibility into project registrations, developers, locations, project timelines, and status indicators.
The system also created standardized Real-estate datasets that could be reused across underwriting, portfolio analysis, developer benchmarking, and internal reporting workflows.
The structured data layer made it easier to compare projects across markets and identify recurring patterns that may require further investigation.
The integration of Location intelligence provided an additional analytical dimension by allowing lenders to evaluate project concentration, geographic exposure, and regional portfolio patterns.
The system also supported the development of project-level and developer-level monitoring indicators that could be incorporated into internal risk frameworks.
Deployment of Web Scraping API Services enabled the client to connect structured data collection with broader enterprise data workflows, supporting scalable ingestion and downstream analytical applications.
Automated RERA data collection involves systematically collecting publicly available real estate project and regulatory information and transforming it into structured datasets. The resulting information can include project details, developers, locations, registration information, timelines, status indicators, and other relevant fields used for analysis.
Structured RERA information can provide lenders with additional project and developer-level signals for due diligence and portfolio monitoring. When combined with internal lending information, it can help analysts evaluate project timelines, developer portfolios, geographic exposure, and other indicators requiring further review.
Yes. When project timelines and status information are consistently structured, analytical rules can be applied to identify projects that require closer monitoring. This can help risk teams prioritize projects based on timeline-related signals rather than manually reviewing every project with the same level of attention.
Yes. Developer names and project records can be standardized and matched so that multiple projects can be analyzed under a common developer profile. This enables organizations to examine portfolio size, geographic distribution, project status, and other developer-level indicators.
Yes. A scalable architecture can process project information across multiple geographic markets. Standardized location fields allow projects to be segmented by city, region, market, or other available geographic classifications.
Transform regulatory real estate data into actionable lending intelligence—automate RERA data collection with iWeb Data Scraping today.
Start a projectFields marked * are required. Everything else just helps us scope faster — skip what you don't know yet.