
34.6K+
TOTAL REVIEWS

Extract Amazon Seller Central data for real-time insights, optimizing pricing, inventory, and SKU performance for scalable Amazon growth intelligence.
This case study is based on a real-world client scenario where a growing eCommerce brand actively Extract Amazon Seller Central data to improve decision-making across pricing, inventory, and product performance.
It is designed for:
The client’s core challenge was simple: Seller Central provides data, but not intelligence. Their goal was to convert raw marketplace signals into structured, decision-ready insights.
Amazon Seller Central is the primary dashboard for managing listings, orders, pricing, inventory, and performance for Amazon sellers. As businesses scale across multiple SKUs, its native reports often become fragmented and less effective for real-time decisions.
To address this, the client implemented Amazon Seller Central sales analytics to structure raw marketplace outputs into actionable insights. This included SKU-level sales units, daily order volume, revenue per ASIN, pricing history, Buy Box percentage, FBA/FBM inventory levels, stock turnover rate, return rate %, ad-attributed conversions, impressions, click-through rate (CTR), and conversion rate.
For instance, the data revealed that top 15 SKUs contributed over 70% of total revenue, while nearly 30% of listings faced periodic stockouts during high-demand cycles. It also highlighted frequent price fluctuations within a 5–12% range impacting Buy Box ownership and showing clear correlations between price drops and conversion spikes.
This approach enabled a shift from manual reporting to continuous, data-driven monitoring of Amazon operations, improving speed, accuracy, and forecasting ability in decision-making.
Although Amazon Seller Central provides dashboards for sales and inventory, the client faced three critical limitations:
First, data fragmentation made it difficult to connect sales performance with inventory movement in real time. Each module operated independently, creating blind spots in decision-making.
Second, pricing volatility was not captured effectively, making it hard to track competitive shifts across multiple ASINs. This led to delayed responses to market changes.
Third, SKU-level scaling introduced inconsistencies in reporting, especially across parent-child variations, leading to misleading performance summaries.
To solve this, the client moved toward Amazon inventory data scraping pipelines that unified all marketplace signals into a structured dataset.
By adopting Amazon sales and inventory data scraping, the client removed manual reporting dependency and built a scalable, automated system for continuous marketplace intelligence, enabling faster insights, improved accuracy, and more efficient decision-making.
| Dimension | Manual Seller Central Tracking | Client Data Scraping System |
|---|---|---|
| Data collection | Manual exports | Automated continuous scraping |
| Update speed | Daily/weekly lag | Near real-time ingestion |
| SKU mapping | Error-prone | Normalized parent-child structure |
| Inventory visibility | Delayed snapshots | Live stock monitoring |
| Scalability | Limited to few SKUs | Scales across full catalog |
The brand in focus is a rapidly growing consumer electronics seller operating on Amazon, specializing in gaming peripherals such as mechanical keyboards, precision mice, headsets, and performance-focused accessories. As its product catalog expanded across multiple regions, the complexity of tracking performance across listings increased significantly. To manage this scale, the brand shifted toward structured marketplace intelligence built on continuous data extraction from Amazon’s seller ecosystem.
Operating in a highly competitive segment, the brand faces constant challenges from price fluctuations, inventory instability, and aggressive competitor positioning. To maintain operational control, it relies on real-time visibility into SKU performance, demand shifts, and stock movement patterns. This has enabled the team to move away from static reporting and toward a more responsive, data-driven decision framework that supports faster and more accurate business decisions across its Amazon operations.
The solution was built around structured extraction of marketplace signals using Real time Amazon Seller Central analytics workflows. We captured SKU-level sales velocity, inventory updates across FBA and FBM, price changes and discount frequency, Buy Box ownership shifts, and order spikes during promotional periods. Each data point was time-stamped, cleaned, and normalized into a unified schema to ensure consistency and accurate comparison across different time periods and product categories. This structured approach enabled deeper visibility into performance trends, helping the client identify demand patterns, pricing sensitivity, and stock risks at an early stage. As a result, the business transitioned from static, lagging reports to continuous intelligence powered by a standardized Amazon Seller Central Dataset, improving forecasting accuracy and enabling faster, data-driven operational decisions across their entire catalog.
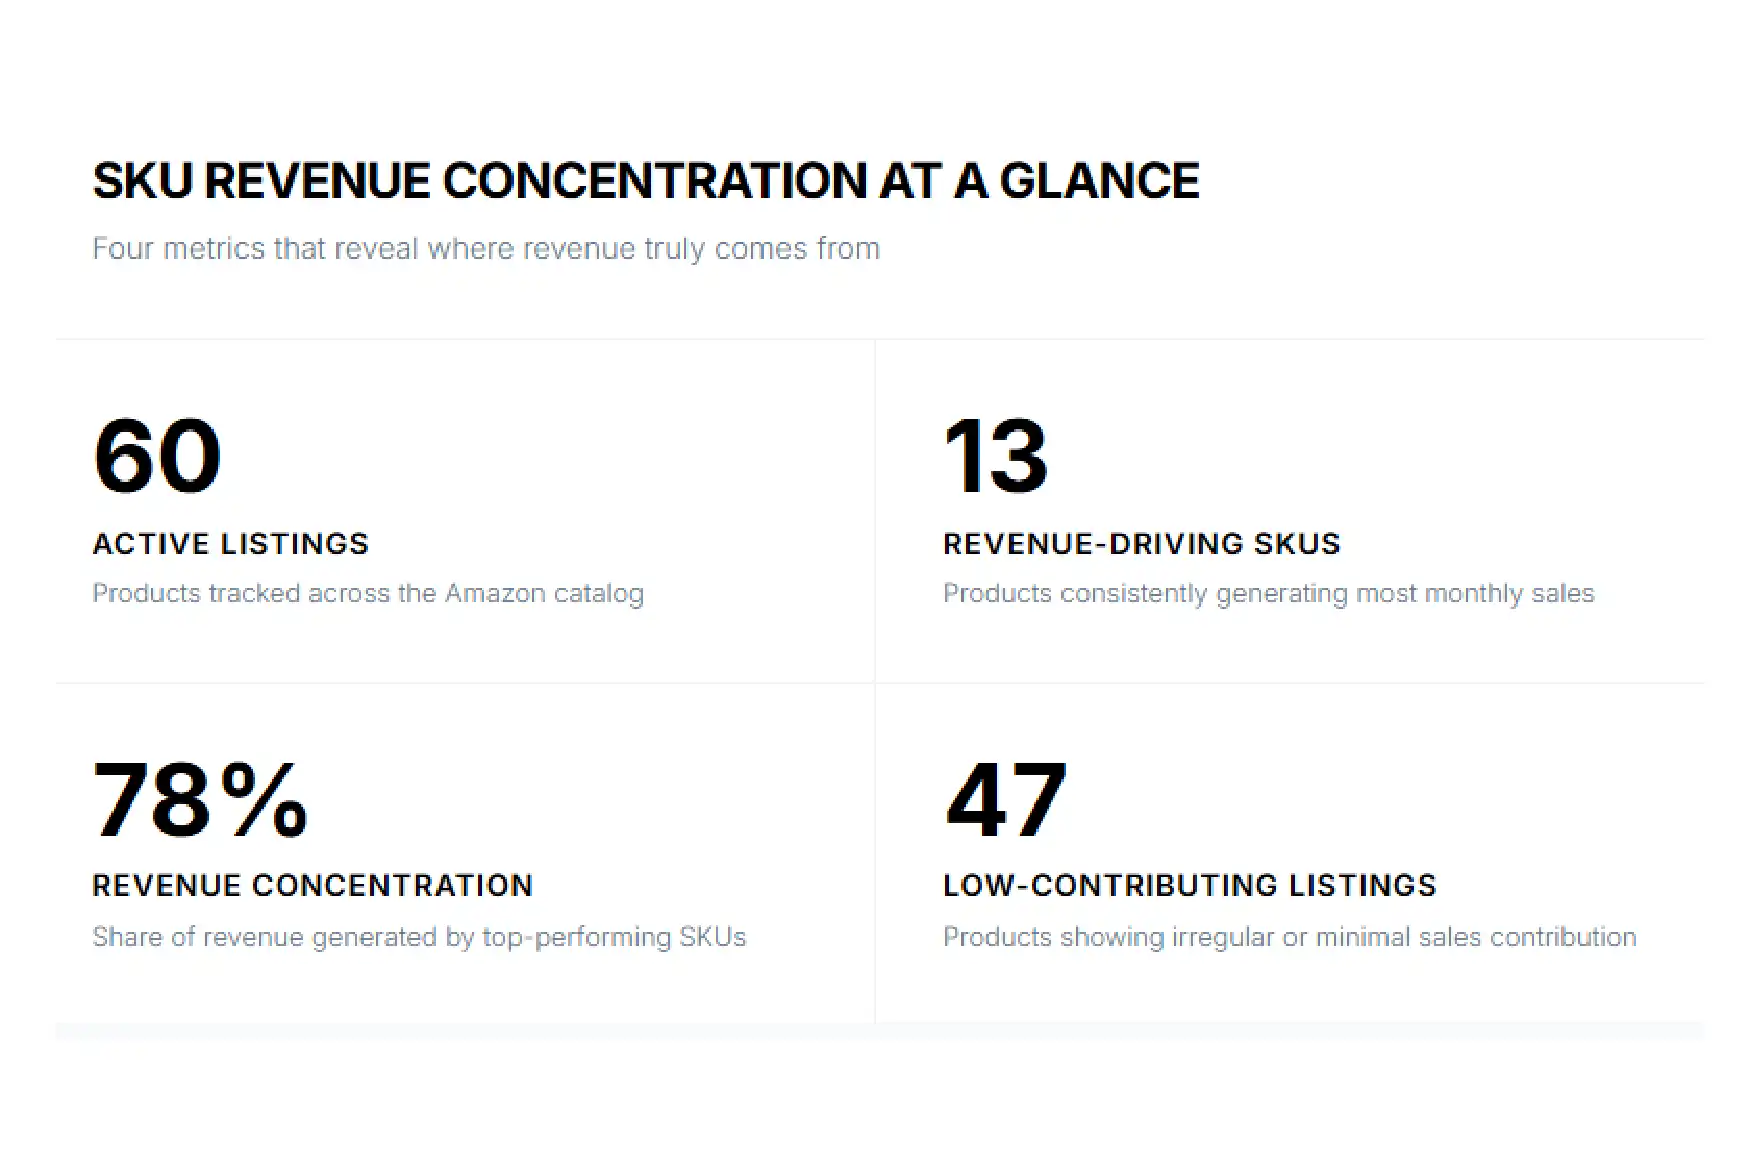
The analysis of the Amazon Seller Central Dataset revealed a strong revenue concentration across a small subset of products. The client initially assumed that sales were evenly distributed across their catalog of 60 active listings. However, structured performance tracking showed that only 13 SKUs consistently generated the majority of monthly revenue, while the remaining listings contributed minimal or highly irregular sales. Many of these low-performing SKUs showed seasonal spikes or inconsistent demand patterns rather than stable performance. This insight significantly changed inventory planning strategy, allowing the client to focus stock allocation, marketing spend, and replenishment cycles on high-impact SKUs. As a result, capital was no longer tied up in low-performing inventory, improving overall operational efficiency and cash flow management across the Amazon business.
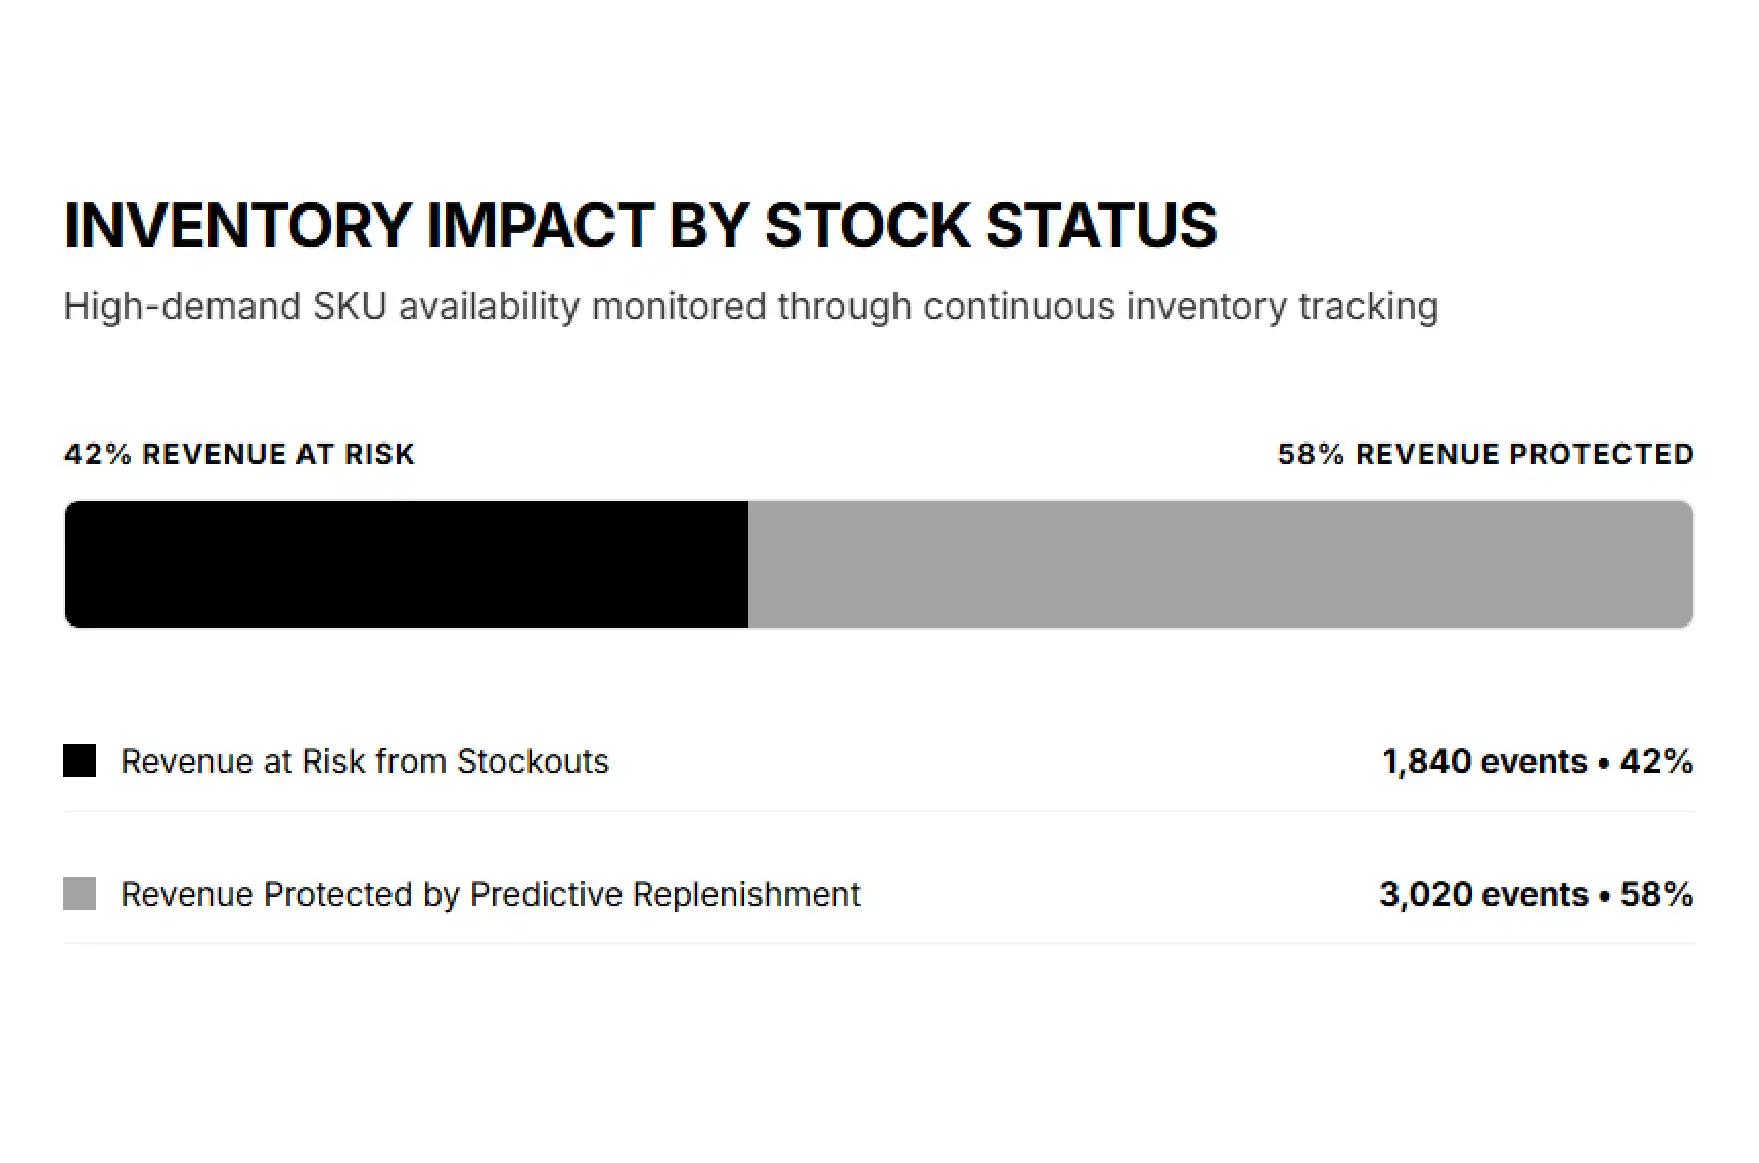
Continuous monitoring through structured eCommerce Data Scraping Services uncovered frequent short-term stockouts in high-velocity SKUs. These gaps were not immediately visible in standard Seller Central reports due to reporting delays and dashboard aggregation. However, time-series tracking showed that even short stockouts of 6–12 hours led to measurable consequences such as ranking drops, reduced Buy Box visibility, and missed conversion opportunities. High-demand products were repeatedly going out of stock during peak traffic windows, especially during promotional cycles. By identifying these patterns, the client shifted from reactive replenishment to predictive inventory planning. Reorder thresholds and restocking cycles were adjusted based on real-time demand signals, ensuring continuous availability of high-performing products and reducing hidden revenue leakage caused by micro stockouts.
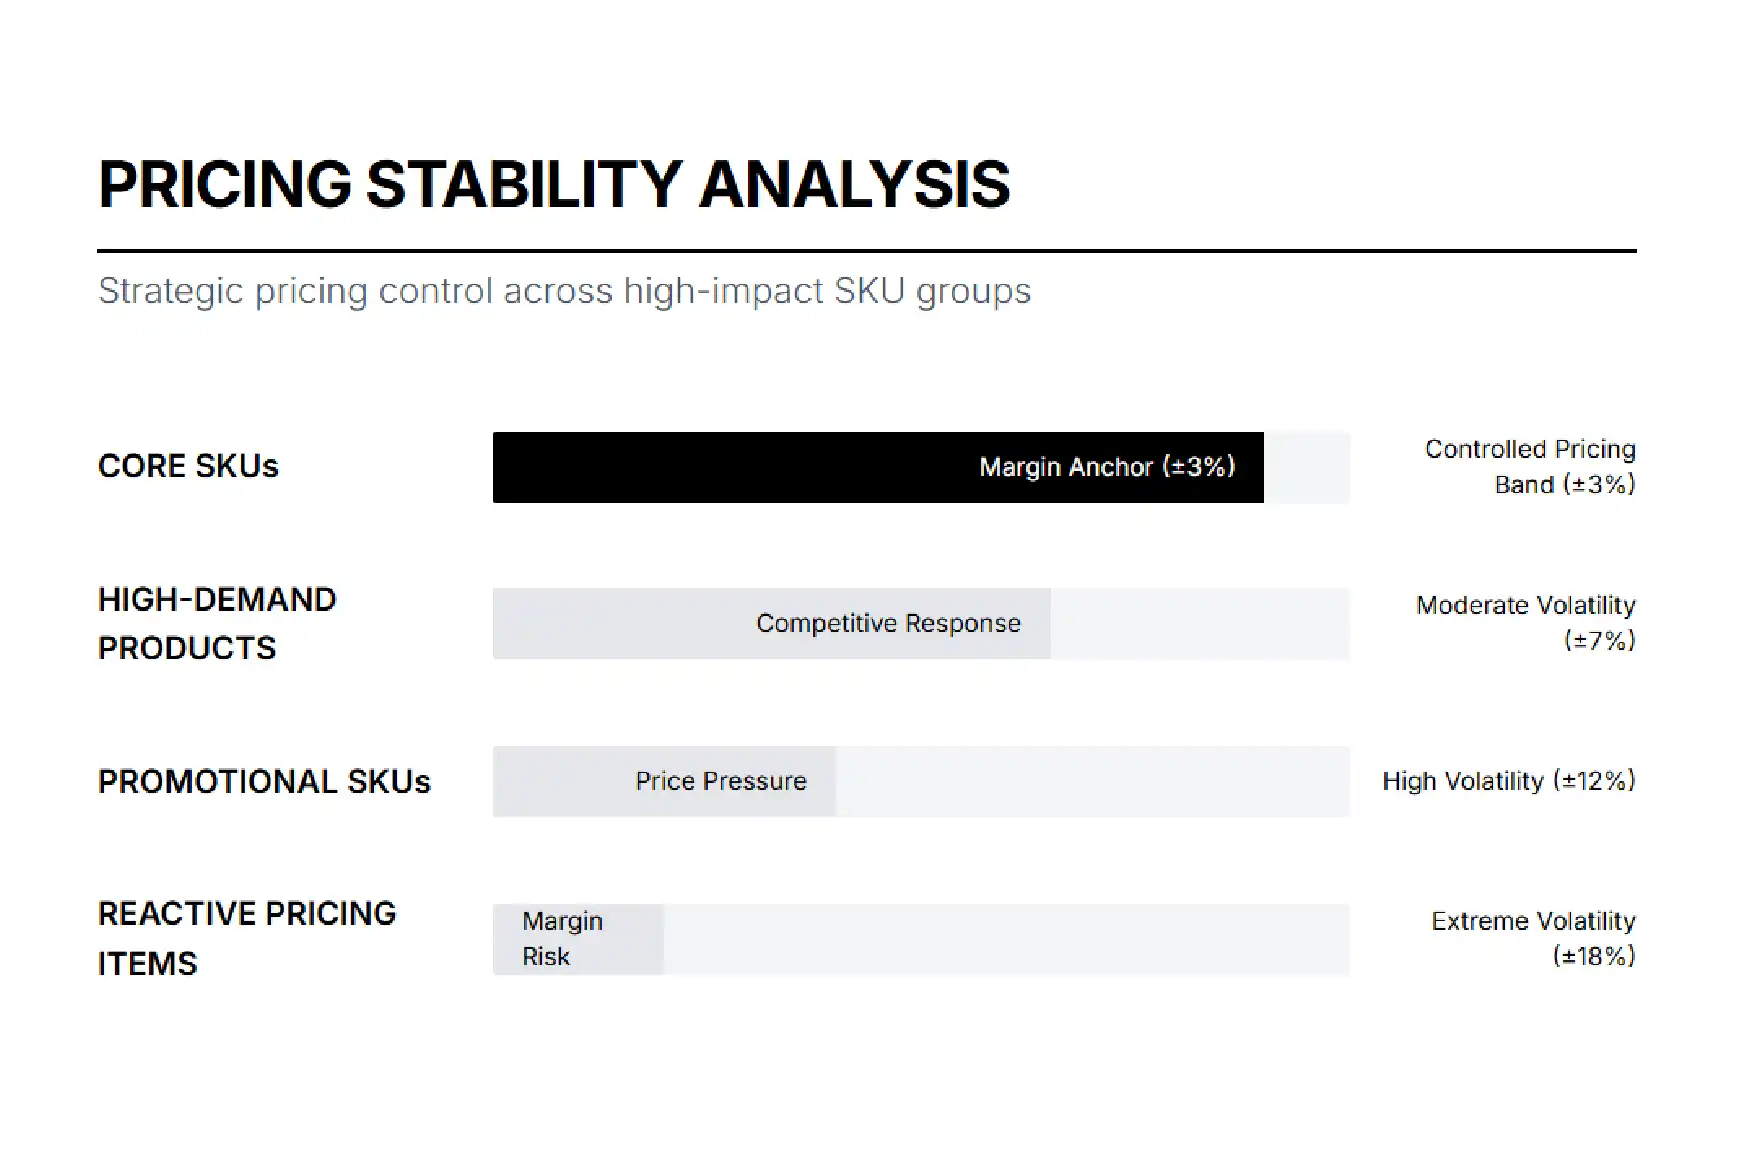
Analysis of competitive pricing behavior using structured marketplace extraction highlighted significant pricing volatility across key SKUs. The system showed that frequent competitor-driven price changes were forcing constant adjustments across the client’s catalog. Instead of maintaining stable pricing anchors, the product listings were reacting dynamically to market fluctuations, resulting in inconsistent perceived value among customers. This instability negatively impacted brand positioning and reduced long-term margin predictability. In several cases, small price drops triggered short-term conversion spikes but weakened overall profitability. By introducing controlled pricing bands for core SKUs, the client stabilized pricing behavior, improved customer trust, and maintained healthier margins. This also reduced unnecessary price wars and helped establish a more consistent brand value perception across competitive categories.
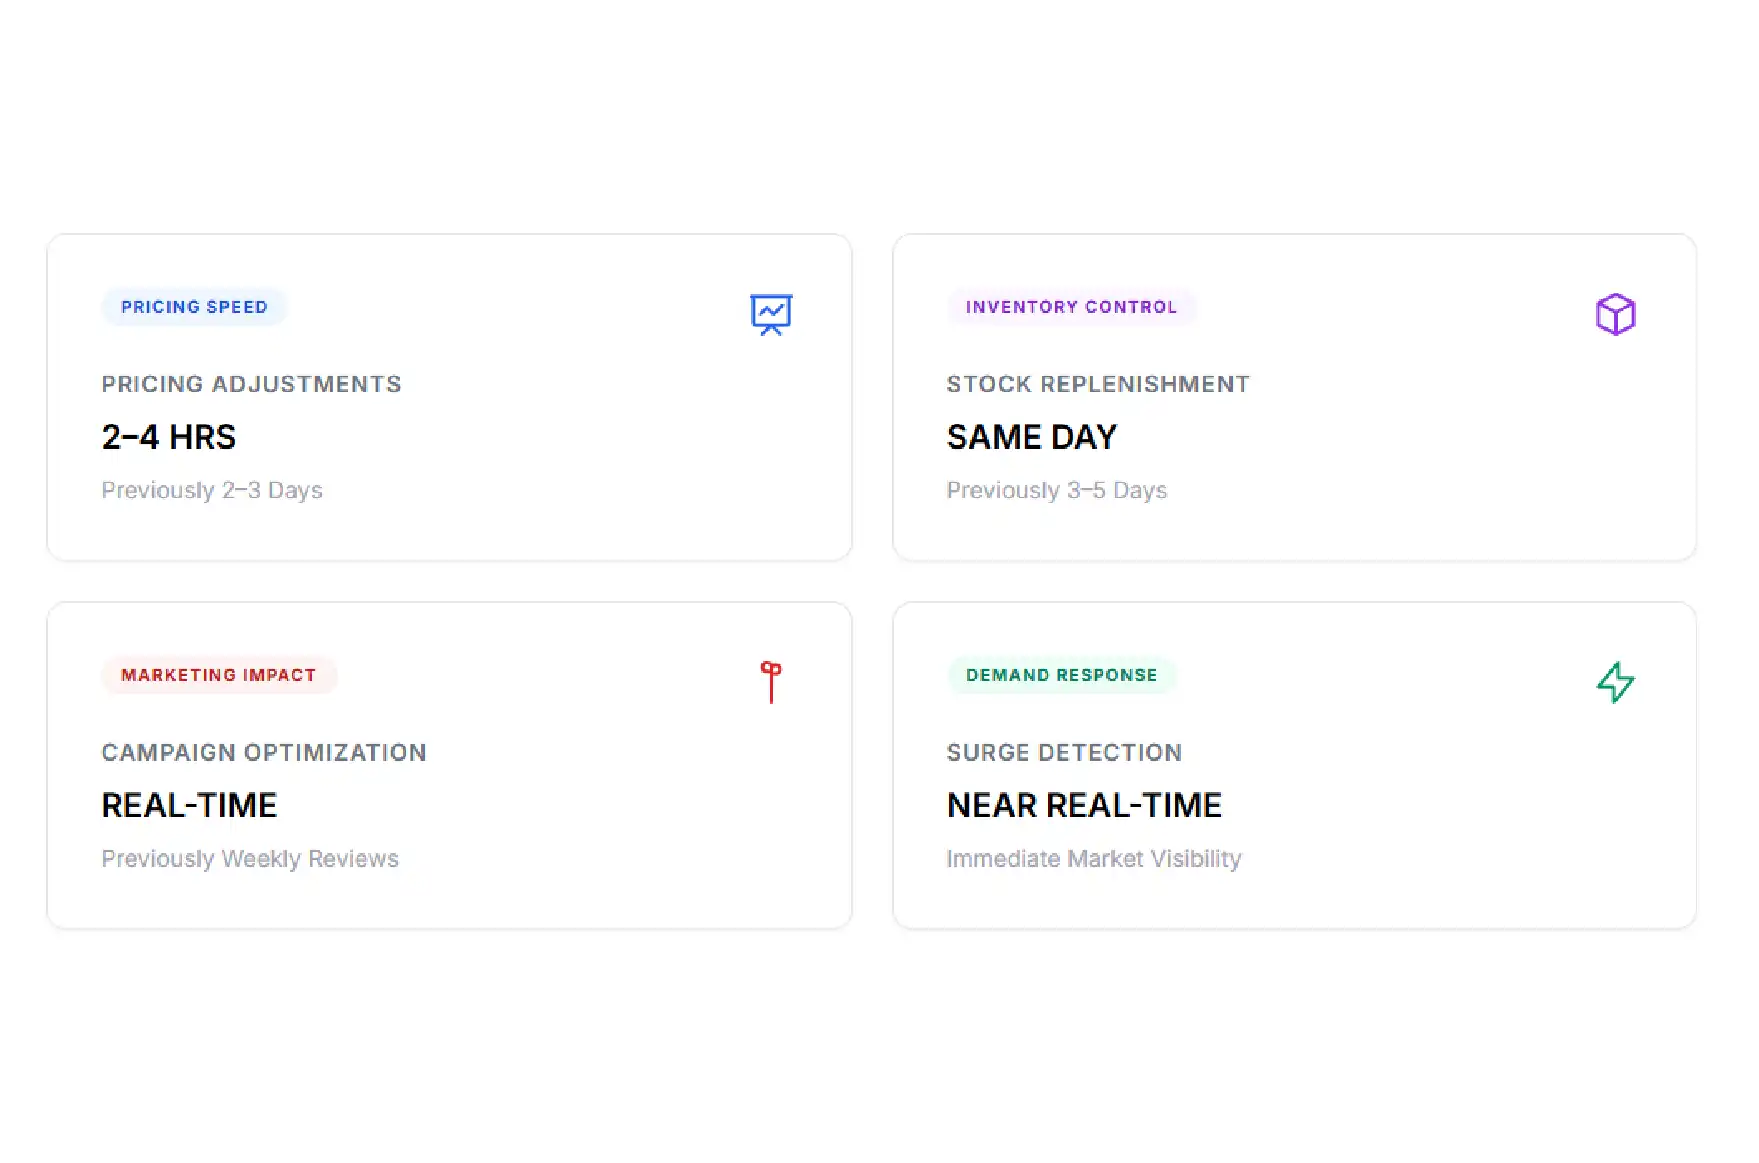
With Real time Amazon Seller Central analytics, the client significantly improved operational responsiveness by reducing decision latency from days to just a few hours. This transformation enabled faster reactions to market changes, promotional performance, and inventory fluctuations.
| Decision Area | Before (Latency) | After (Latency) | Impact |
|---|---|---|---|
| Pricing Adjustments | 2–3 days | 2–4 hours | Faster competitiveness |
| Stock Replenishment | 3–5 days | Same day | Reduced stockouts |
| Campaign Optimization | Weekly | Same day | Higher ROAS |
| Demand Surge Response | Delayed | Near real-time | Improved conversions |
This shift allowed the client to move from retrospective reporting to live operational control, enabling immediate intervention during sales spikes, competitor price drops, and sudden inventory changes across SKUs.
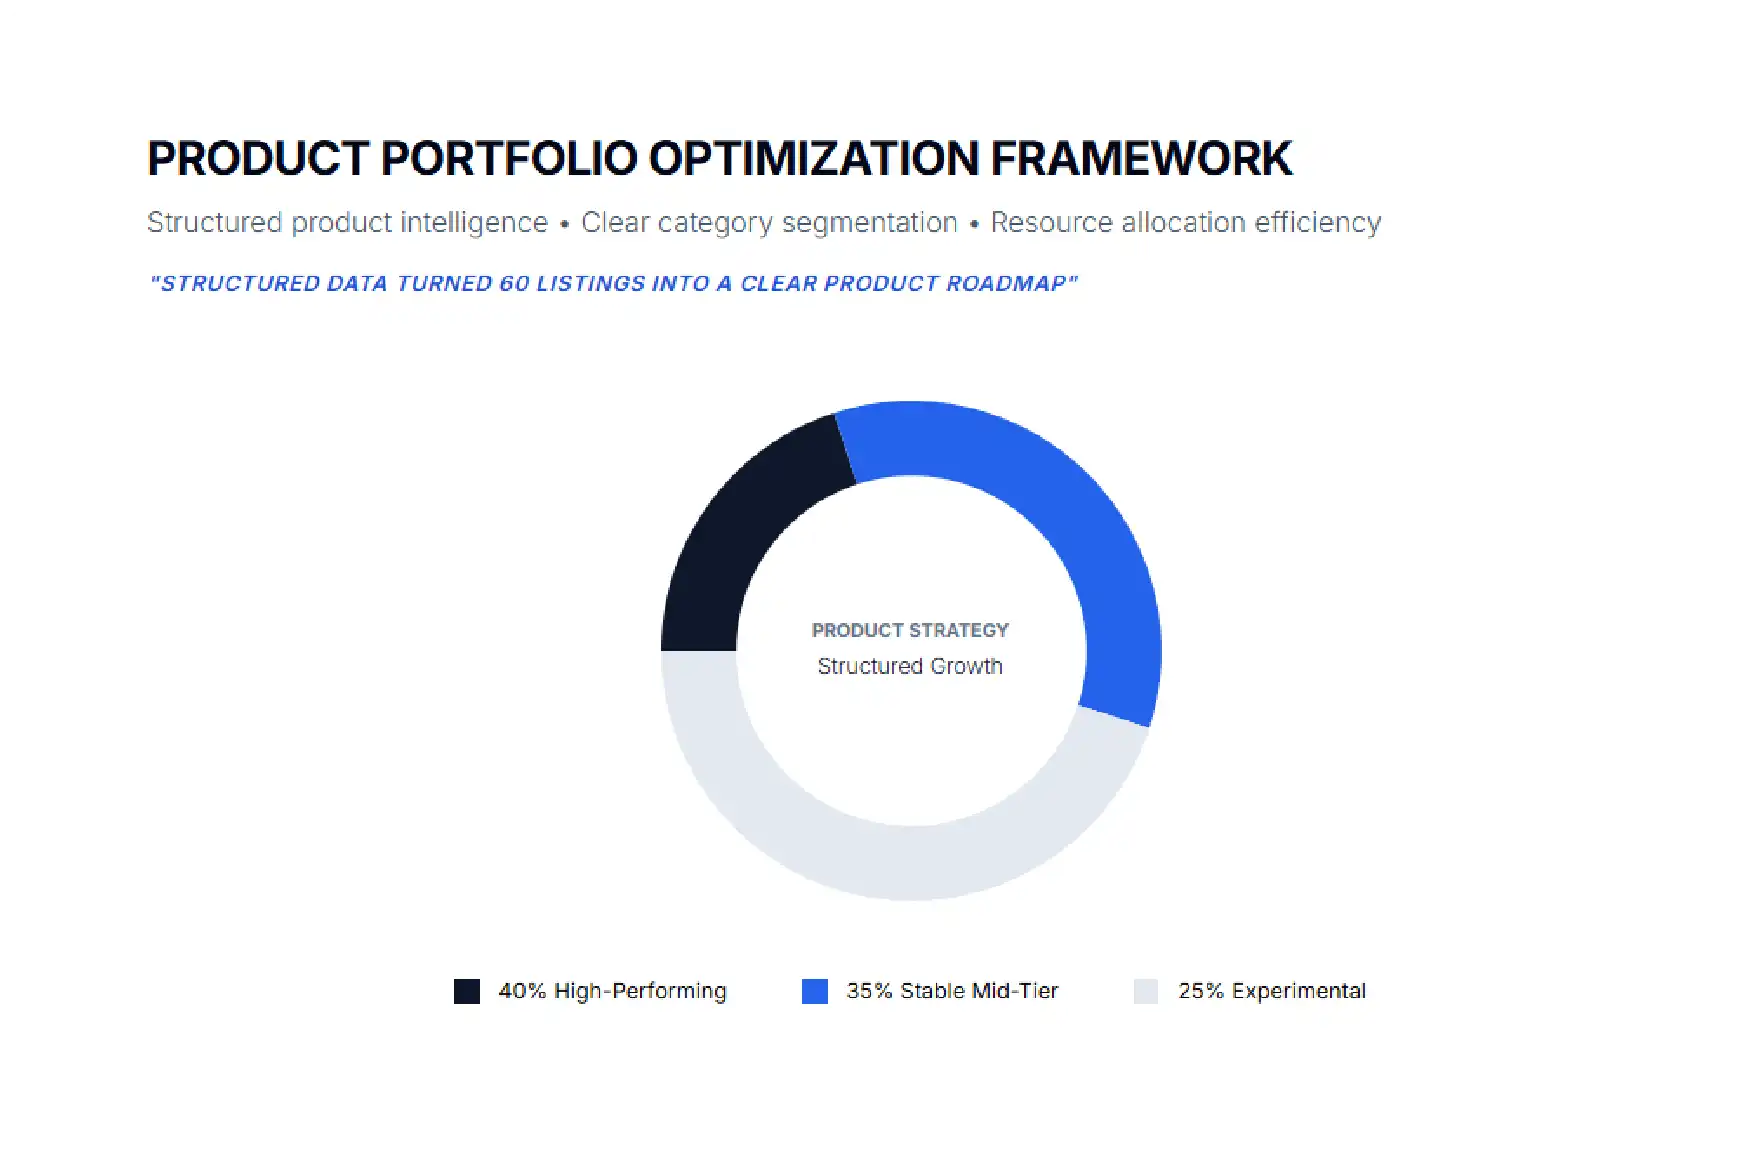
The use of structured eCommerce intelligence helped the client reorganize their entire product strategy. By analyzing performance patterns, the catalog was segmented into clear categories such as high-performing revenue drivers, stable mid-tier products, and experimental or seasonal SKUs. This classification reduced operational confusion and improved focus on products that delivered consistent returns. High-performing SKUs received priority in marketing budgets, inventory allocation, and ad spend, while underperforming listings were either optimized or repositioned for niche demand testing. This structured approach created a clearer product roadmap and eliminated unnecessary resource allocation across low-impact listings. It also improved decision-making clarity across product, marketing, and supply chain teams, leading to more aligned and efficient business operations.
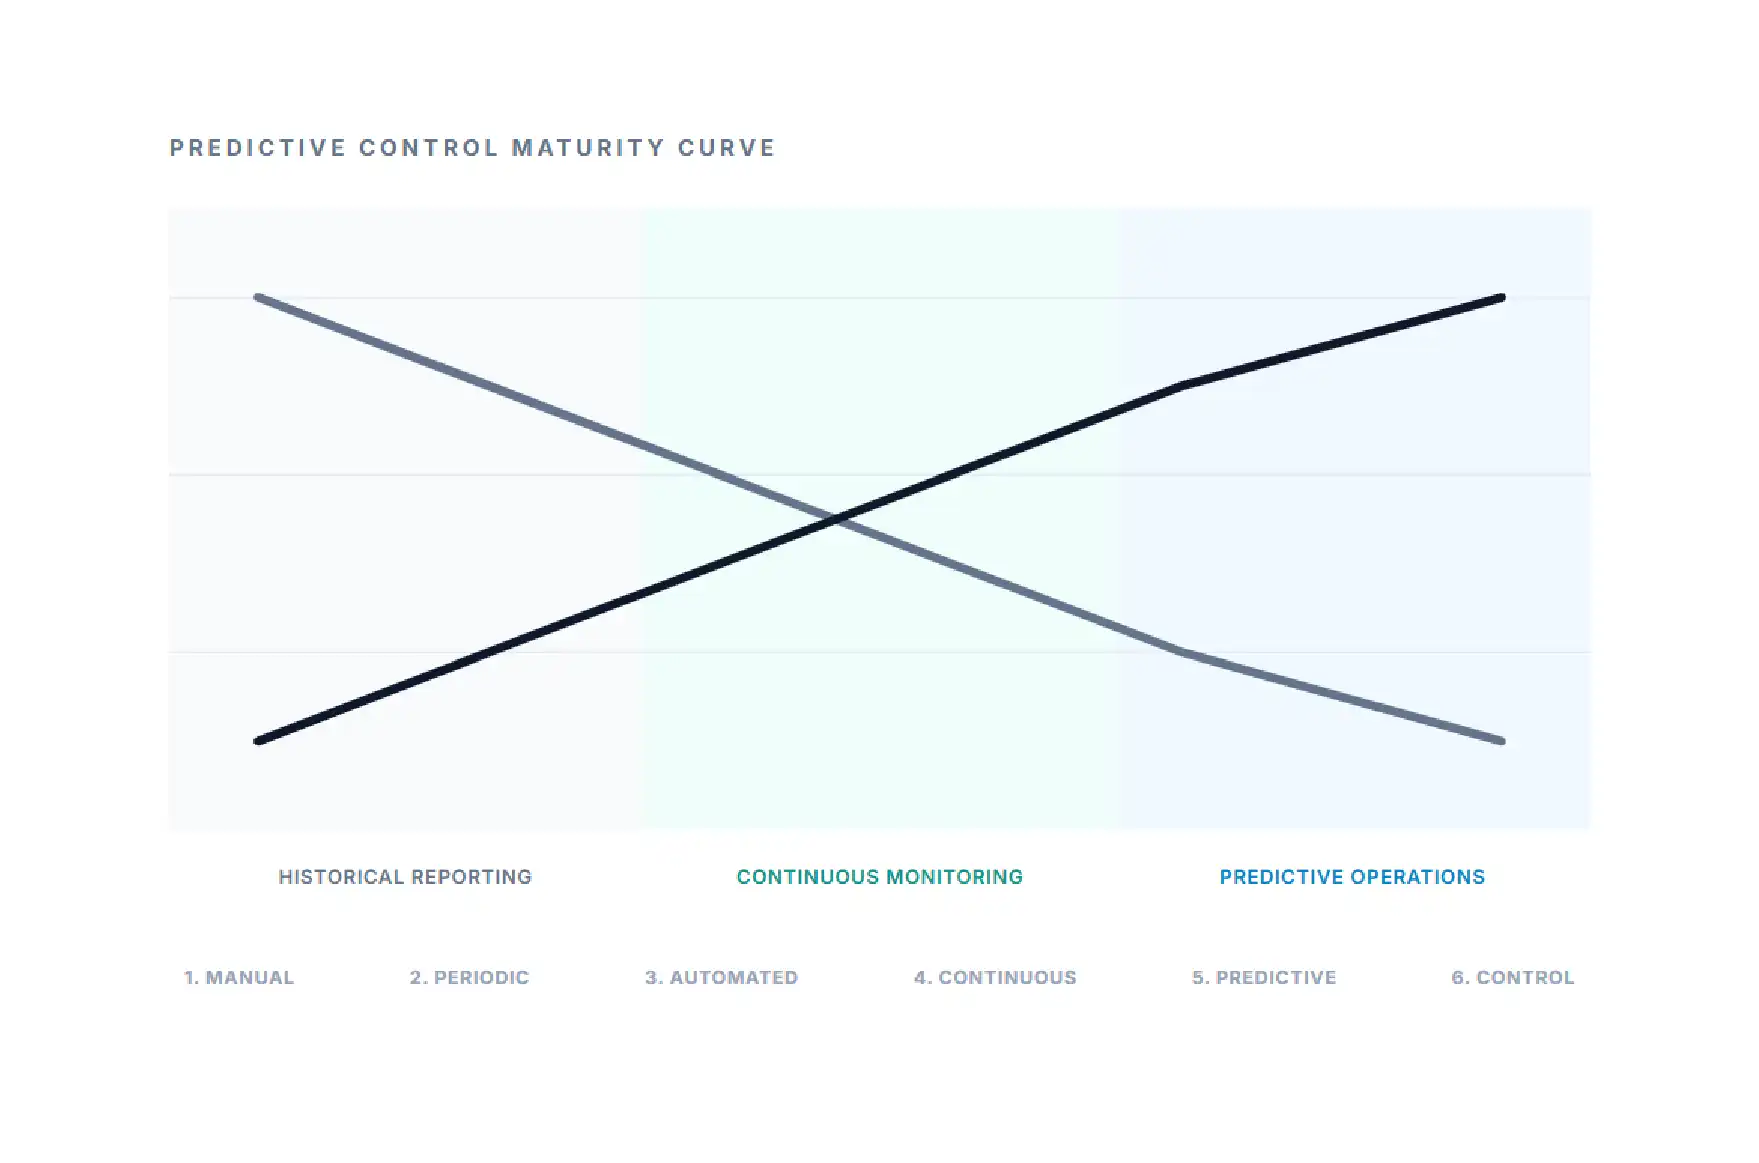
The adoption of continuous data systems to Scrape Amazon Seller Central API enabled a shift from reactive reporting to predictive marketplace control. Instead of responding after events occurred, the client could now identify early warning signals through continuous monitoring. These included rapid inventory depletion trends, competitor price undercut patterns, sudden demand acceleration, and Buy Box instability indicators. Early detection allowed proactive interventions such as adjusting pricing, increasing inventory orders, or modifying ad spend before revenue impact occurred. This predictive layer significantly reduced risk exposure during high-demand cycles and promotional events. Over time, the system improved forecasting accuracy and operational preparedness, allowing the business to anticipate marketplace changes rather than react to them, creating a more stable and scalable Amazon growth model.
Below is the expanded Amazon Seller Central dataset showing SKU-level performance, including product categories, pricing, orders, inventory levels, and stock status to support sales tracking, demand analysis, and inventory optimization.
| SKU | Product | Category | Price | Orders | Inventory | Status |
|---|---|---|---|---|---|---|
| AMZ-KB-101 | Pro Gaming Keyboard | Keyboard | $69.99 | 9,420 | 120 | Stable |
| AMZ-MS-205 | Precision Mouse | Mouse | $34.99 | 14,880 | 45 | Low Stock |
| AMZ-HD-330 | Gaming Headset | Audio | $49.99 | 6,210 | 80 | Stable |
| AMZ-ACC-120 | Controller Grip | Accessories | $12.99 | 3,540 | 0 | Out of Stock |
| AMZ-MIC-410 | USB Streaming Mic | Audio | $79.99 | 4,860 | 35 | Low Stock |
| AMZ-MOU-512 | Wireless Gaming Mouse | Mouse | $44.99 | 11,230 | 60 | Stable |
| AMZ-KB-220 | Mechanical Keyboard RGB | Keyboard | $89.99 | 7,540 | 25 | Low Stock |
| AMZ-CHA-330 | Gaming Chair | Furniture | $159.99 | 2,180 | 15 | Low Stock |
| AMZ-ACC-210 | Mouse Pad XL | Accessories | $14.99 | 8,760 | 0 | Out of Stock |
| AMZ-HD-450 | Noise Cancelling Headset | Audio | $59.99 | 5,940 | 50 | Stable |
After implementing structured Amazon data scraping, the client achieved measurable operational improvements across sales, inventory, and marketing efficiency, driven by continuous visibility into marketplace behavior.
This shift fundamentally changed how the client operated on Amazon—from reactive management to data-driven control powered by eCommerce Data Intelligence and enriched behavioral insights derived from Ecommerce Product Ratings and Review Dataset analysis across all active listings.
Our importance lies in its ability to transform scattered online information into structured, actionable intelligence for businesses. In today’s competitive digital landscape, companies need real-time access to pricing trends, customer behavior, and competitor insights to stay ahead. By using Web Scraping API Services, organizations can automate large-scale data extraction with high accuracy, reducing manual effort and improving decision-making speed. It also ensures seamless integration of live data into dashboards and analytics systems for continuous monitoring. Similarly, Web Scraping Services help businesses collect and organize data from multiple sources efficiently, enabling better market research, pricing optimization, and product strategy development. Overall, iWeb Data Scraping empowers companies to make faster, data-driven decisions while maintaining scalability and operational efficiency across industries.
Stop relying on scattered reports and delayed dashboards. Share your product category or marketplace focus, and we will convert raw Seller Central signals into structured, real-time insights you can actually act on with confidence.
Start a projectReports are delayed, fragmented, and often lack real-time accuracy, while scraping enables unified, continuous, and real-time visibility across all SKUs for faster and more informed decision-making.
Yes, real-time tracking is essential in fast-moving eCommerce categories where pricing, competitor activity, and inventory levels change frequently, often multiple times within a single day.
Yes, the system is fully scalable and designed to handle large multi-SKU and multi-category Amazon operations while maintaining consistent performance, accuracy, and structured data output.
Scraping improves inventory management by identifying stock depletion patterns early, reducing stockout risks, and enabling proactive replenishment before Seller Central dashboards reflect the actual issue.
Seller Central data provides insights into sales performance trends, pricing fluctuations, inventory health, customer demand patterns, and Buy Box ownership dynamics across different ASINs and categories.