Introduction
India’s retail industry is becoming increasingly competitive as consumers rely on digital discovery, location-based searches, customer reviews, and star ratings to select stores. From supermarkets and fashion outlets to electronics retailers, pharmacies, furniture showrooms, and convenience stores, a business’s Google Maps presence can influence its visibility, customer confidence, and potential footfall. In 2026, evaluating store ratings across brands and cities provides retailers with a practical way to understand customer sentiment and identify differences in local performance.
A structured Google Maps ratings scraping India strategy helps businesses collect publicly displayed store ratings, review counts, business categories, addresses, and location details for comparative analysis. Through Google Maps ratings scraping, analysts can organize store-level information into consistent datasets and examine how customer perceptions vary between metropolitan areas, emerging commercial centers, and smaller cities.
Reliable India retail store ratings data can support benchmarking, expansion planning, customer experience improvements, and competitive research. However, a meaningful report must distinguish verified observations from illustrative examples, because ratings change over time and individual outlets belonging to the same brand may perform differently. This research report establishes a practical framework for comparing retail brands by city in 2026, with numerical tables designed to demonstrate how a city-level rating index and store-level benchmarking dataset can be structured.
Data note: The numerical datasets below are illustrative research examples, not verified live Google Maps ratings or actual brand rankings. They demonstrate a reporting methodology and should be replaced with date-stamped, collected store-level observations before being used to publish factual market rankings.
1. Research Scope and Brand Benchmarking Framework
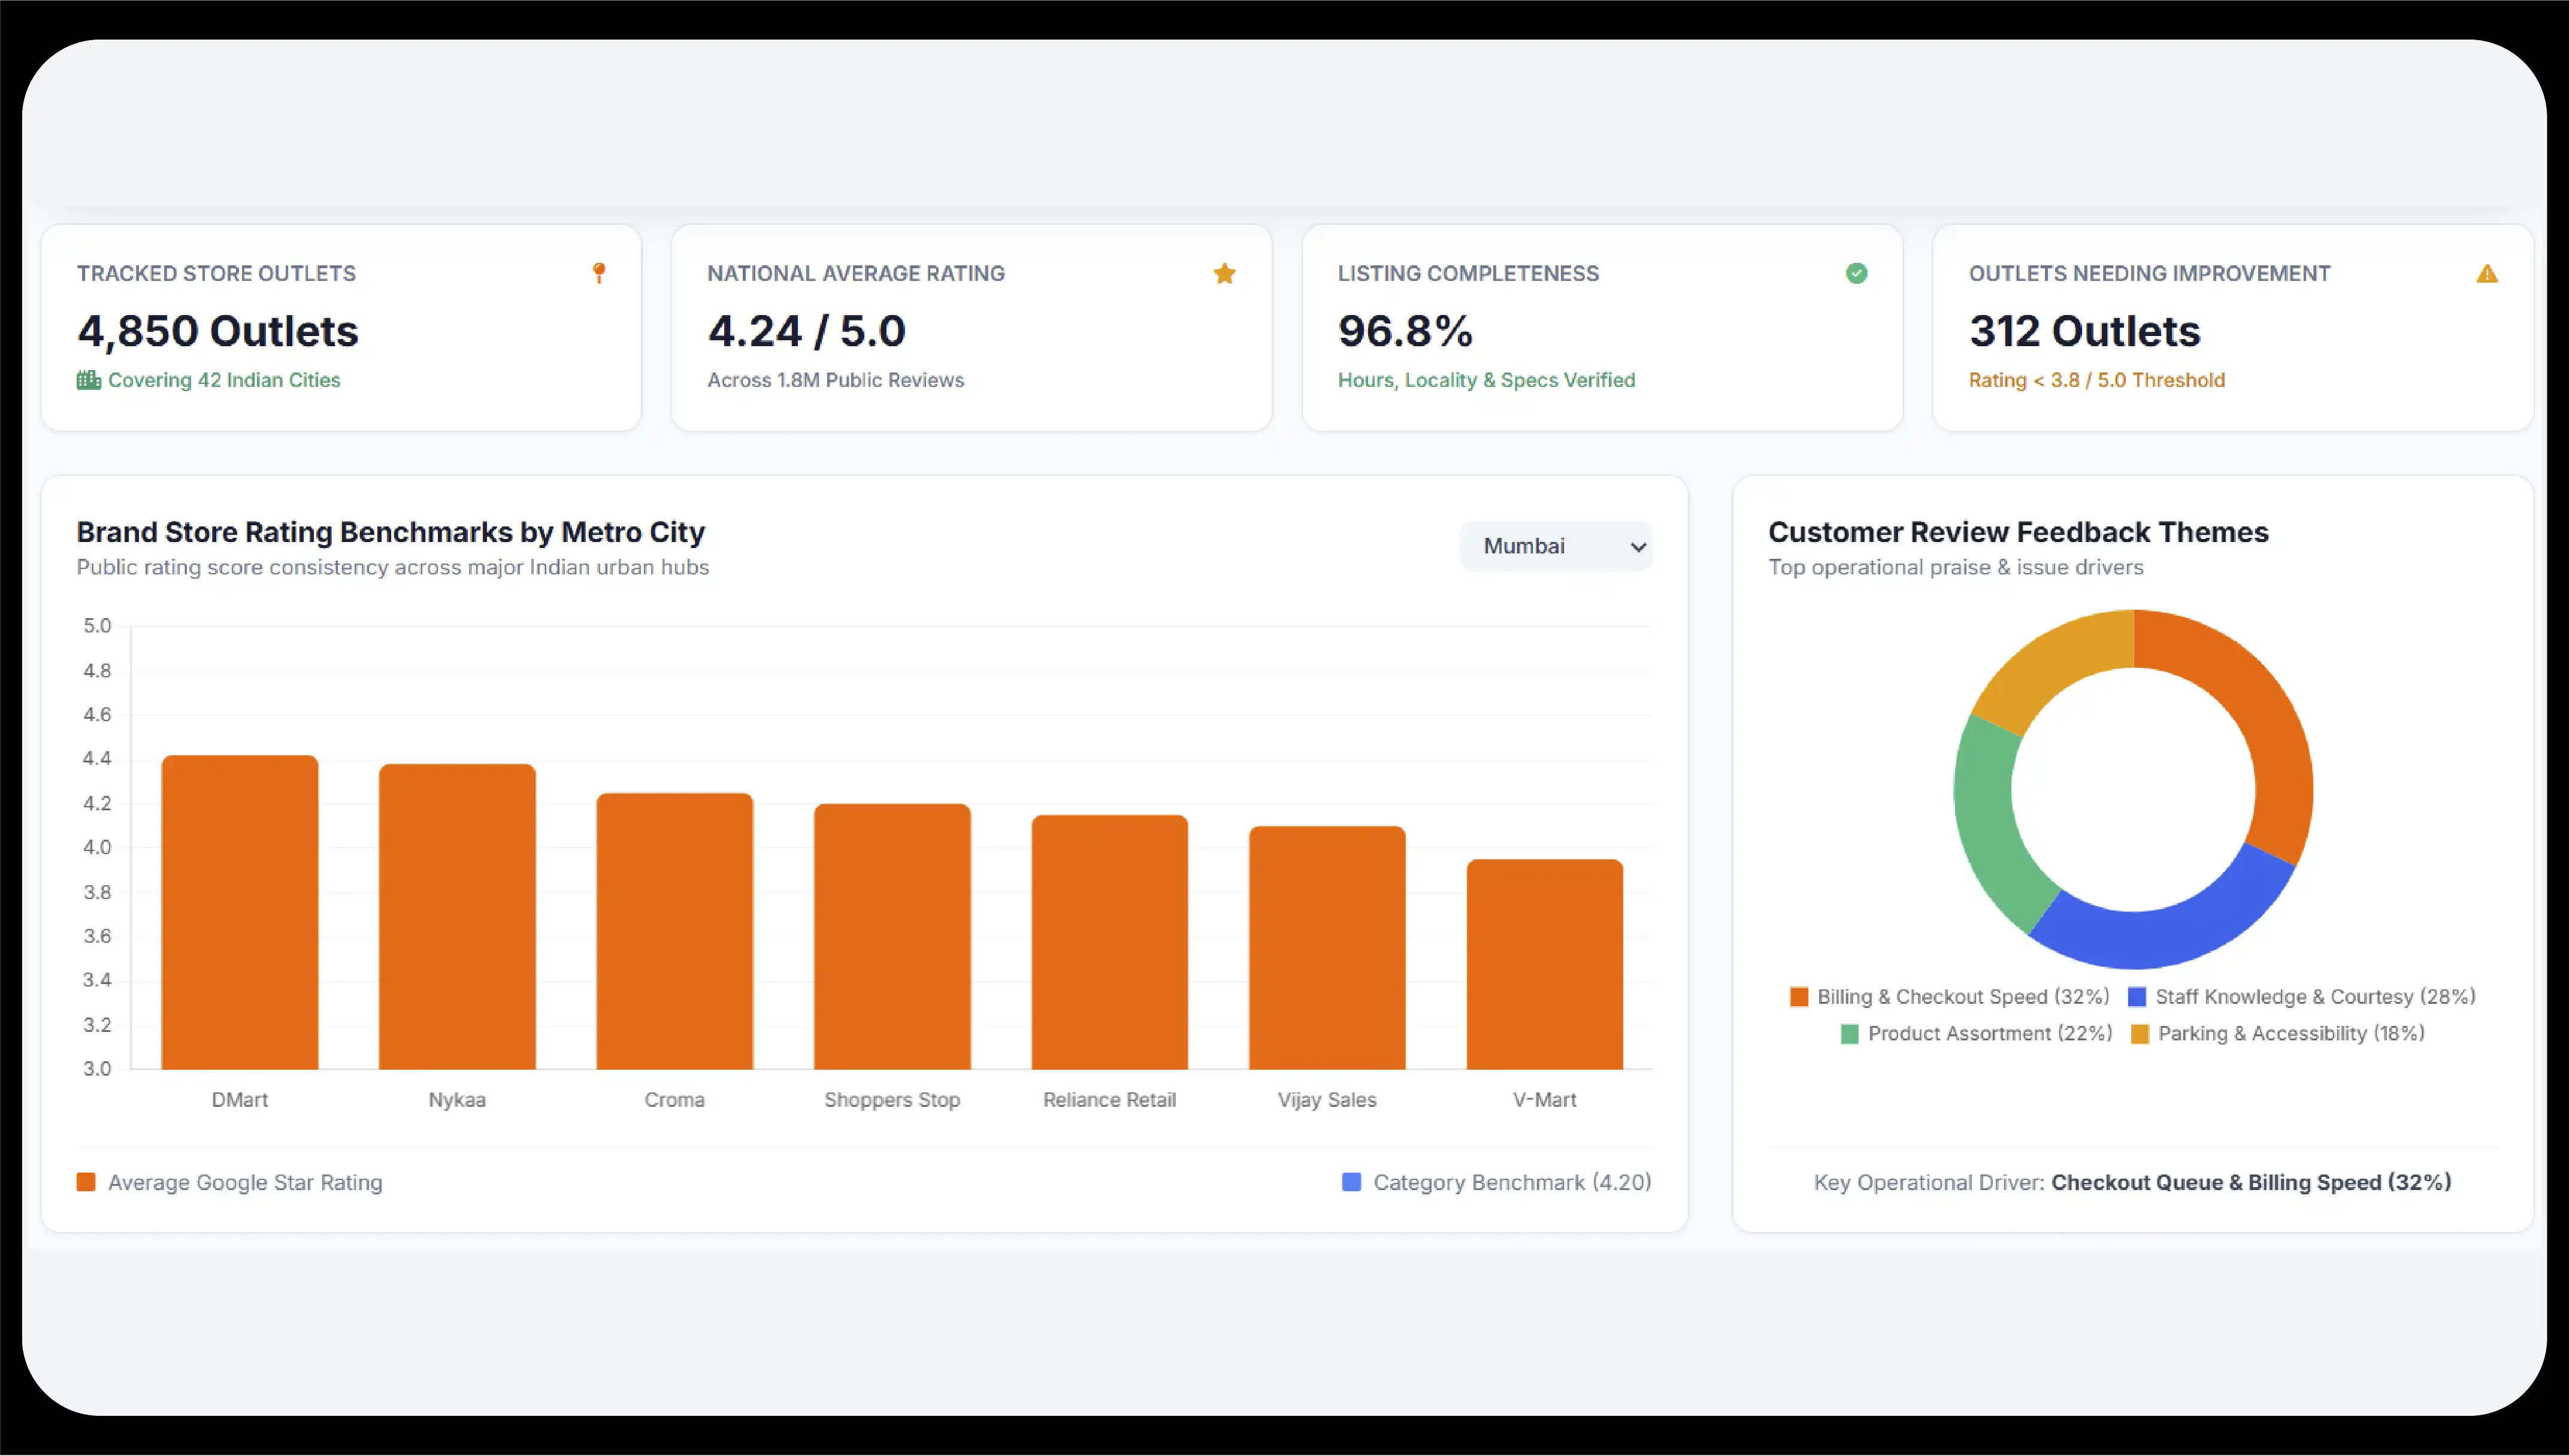
The 2026 report focuses on major Indian retail categories, including grocery and supermarkets, fashion and apparel, electronics, pharmacies, beauty products, and home furnishings. Brands such as Reliance Retail, DMart, More Retail, V-Mart, Croma, Vijay Sales, Nykaa, and Shoppers Stop provide useful examples of the different operating models that a nationwide benchmarking exercise can examine.
The objective is not simply to identify the highest-rated brand. It is to understand whether ratings remain consistent across cities, how much customer feedback each store receives, and which outlets require operational improvements.
A brand-wise store ratings by city framework should include the following fields:
- Brand name and retail category.
- City, locality, store address, and unique listing identifier.
- Current public star rating and total review count.
- Recent review volume and rating movement over a defined period.
- Store operating status and listing completeness.
- Common positive and negative review themes, where review analysis is permitted.
Google explains that its displayed review score represents the average of ratings published for a business, on a five-star scale. New reviews can take up to two weeks to be reflected in the score, making collection timestamps essential when comparing outlets.
Why city-level comparisons matter?
Mumbai, Delhi NCR, Bengaluru, Hyderabad, Chennai, Pune, Kolkata, Ahmedabad, Jaipur, and Lucknow have different retail environments, consumer expectations, store formats, and competitive conditions. A high rating in one city does not automatically establish that a brand provides the same experience elsewhere.
For instance, a supermarket outlet in a densely populated urban neighbourhood may receive complaints about checkout queues, while a suburban store may receive more comments about parking or product availability. These are hypotheses to investigate through actual reviews, not conclusions that can be established from star ratings alone.
A robust city-wise store rating report should therefore compare outlets within the same retail category and, where possible, similar store formats and neighbourhoods. This prevents a small pharmacy from being compared uncritically with a large hypermarket or a premium electronics showroom.
2. Numerical Benchmark Table: Brand Ratings Across Indian Cities
The following table demonstrates a hypothetical benchmark for ten retail brands across ten major Indian cities. Ratings are expressed on a five-star scale, while store counts and review volumes illustrate the structure of a research dataset.
Illustrative figures only. These values are not live Google Maps observations and do not represent actual brand performance.
| Mumbai |
4.1 |
4.2 |
4.0 |
4.3 |
4.0 |
4.2 |
4.0 |
4.1 |
4.4 |
4.2 |
| Delhi NCR |
4.0 |
4.1 |
4.1 |
4.2 |
3.9 |
4.1 |
4.0 |
4.0 |
4.3 |
4.1 |
| Bengaluru |
4.2 |
4.3 |
4.2 |
4.4 |
4.1 |
4.3 |
4.1 |
4.2 |
4.5 |
4.3 |
| Hyderabad |
4.2 |
4.2 |
4.1 |
4.3 |
4.0 |
4.2 |
4.1 |
4.1 |
4.4 |
4.2 |
| Chennai |
4.1 |
4.2 |
4.0 |
4.2 |
4.0 |
4.1 |
4.0 |
4.0 |
4.3 |
4.1 |
| Pune |
4.2 |
4.3 |
4.2 |
4.3 |
4.1 |
4.2 |
4.1 |
4.2 |
4.4 |
4.2 |
| Kolkata |
4.0 |
4.1 |
4.0 |
4.2 |
3.9 |
4.1 |
3.9 |
4.0 |
4.3 |
4.1 |
| Ahmedabad |
4.1 |
4.2 |
4.1 |
4.3 |
4.0 |
4.2 |
4.0 |
4.1 |
4.4 |
4.2 |
| Jaipur |
4.2 |
4.3 |
4.1 |
4.3 |
4.1 |
4.2 |
4.1 |
4.1 |
4.4 |
4.2 |
| Lucknow |
4.1 |
4.2 |
4.0 |
4.2 |
4.0 |
4.1 |
4.0 |
4.0 |
4.3 |
4.1 |
| Illustrative mean |
4.12 |
4.21 |
4.08 |
4.27 |
4.01 |
4.17 |
4.02 |
4.08 |
4.37 |
4.17 |
Pharmacy chain and home retail are category labels rather than named brands in this example. The mean row is calculated from the ten illustrative city ratings in each column.
What this table helps analysts understand?
First, it demonstrates how to identify variation across cities without relying on a single national average. Second, it makes it possible to compare category-level performance and determine which outlets merit further investigation. Third, it highlights the importance of keeping the comparison consistent: the same brands, rating scale, collection period, and store-selection rules should be used for every city.
In a real dataset, analysts should also record the number of eligible outlets behind each city-level average. A city represented by three stores should not be presented as equally reliable as a city represented by fifty comparable outlets. Review counts and the distribution of individual store ratings should accompany the averages.
3. Store-Level Dataset and Review Volume Analysis
City averages provide an overview, but operational decisions require information about individual outlets. Two stores belonging to the same retailer can receive substantially different ratings because of differences in staff service, inventory management, checkout efficiency, accessibility, and local competition.
This is where location intelligence India retail becomes valuable. By linking store ratings with coordinates, neighbourhoods, review volumes, and retail categories, businesses can identify geographic clusters of strong and weak performance and determine where additional investigation is necessary.
The next table illustrates the fields required for a store-level benchmarking dataset. Each record represents one hypothetical outlet, with numerical indicators for review activity and operational follow-up.
Illustrative store records only. Ratings, review counts, sentiment percentages, and response figures below are invented examples for demonstrating the analytical approach.
| MUM-101 |
Reliance Retail |
Mumbai |
2,480 |
186 |
4.1 |
4.0 |
+0.1 |
18% |
42% |
Medium |
| MUM-102 |
DMart |
Mumbai |
3,620 |
240 |
4.2 |
4.3 |
-0.1 |
16% |
35% |
Medium |
| MUM-103 |
Croma |
Mumbai |
1,840 |
132 |
4.0 |
4.1 |
-0.1 |
22% |
48% |
High |
| DEL-101 |
Reliance Retail |
Delhi NCR |
2,160 |
170 |
4.0 |
4.0 |
0.0 |
21% |
38% |
High |
| DEL-102 |
DMart |
Delhi NCR |
3,150 |
215 |
4.1 |
4.2 |
-0.1 |
19% |
40% |
Medium |
| DEL-103 |
Croma |
Delhi NCR |
1,560 |
125 |
4.1 |
4.0 |
+0.1 |
17% |
52% |
Medium |
| BLR-101 |
Reliance Retail |
Bengaluru |
2,730 |
205 |
4.2 |
4.1 |
+0.1 |
14% |
56% |
Low |
| BLR-102 |
DMart |
Bengaluru |
4,120 |
310 |
4.3 |
4.2 |
+0.1 |
13% |
61% |
Low |
| BLR-103 |
Croma |
Bengaluru |
2,050 |
158 |
4.2 |
4.2 |
0.0 |
16% |
54% |
Medium |
| HYD-101 |
Reliance Retail |
Hyderabad |
2,280 |
175 |
4.2 |
4.1 |
+0.1 |
15% |
49% |
Low |
| HYD-102 |
DMart |
Hyderabad |
3,480 |
260 |
4.2 |
4.3 |
-0.1 |
18% |
44% |
Medium |
| HYD-103 |
Croma |
Hyderabad |
1,720 |
140 |
4.1 |
4.0 |
+0.1 |
19% |
50% |
Medium |
| CHE-101 |
Reliance Retail |
Chennai |
1,960 |
148 |
4.1 |
4.0 |
+0.1 |
17% |
45% |
Medium |
| CHE-102 |
DMart |
Chennai |
2,940 |
225 |
4.2 |
4.1 |
+0.1 |
15% |
53% |
Low |
| CHE-103 |
Croma |
Chennai |
1,430 |
112 |
4.0 |
4.1 |
-0.1 |
23% |
39% |
High |
| PUN-101 |
Reliance Retail |
Pune |
1,850 |
155 |
4.2 |
4.1 |
+0.1 |
14% |
51% |
Low |
| PUN-102 |
DMart |
Pune |
2,870 |
218 |
4.3 |
4.2 |
+0.1 |
12% |
59% |
Low |
| PUN-103 |
Croma |
Pune |
1,390 |
106 |
4.2 |
4.1 |
+0.1 |
15% |
47% |
Medium |
| KOL-101 |
Reliance Retail |
Kolkata |
1,720 |
130 |
4.0 |
4.1 |
-0.1 |
22% |
34% |
High |
| KOL-102 |
DMart |
Kolkata |
2,410 |
184 |
4.1 |
4.0 |
+0.1 |
17% |
46% |
Medium |
Rating change is the difference between the two illustrative rating snapshots. Negative review share is the percentage of sampled reviews classified as negative; owner response rate is the percentage of eligible reviews receiving a response. Neither metric is a standard Google Maps rating field, so both require a separately documented review-analysis method.
Interpreting the store-level results
The table illustrates why an average rating should never be used in isolation. An outlet rated 4.2 with 3,000 reviews offers a different evidence base from one rated 4.8 with only 12 reviews. The second outlet may genuinely provide excellent service, but its limited feedback makes the result more sensitive to a small number of new ratings.
Review volume also needs careful interpretation. More reviews may reflect a larger customer base, greater store visibility, or a longer operating history. It does not automatically mean that the store has better service or higher sales.
Rating changes should be calculated using comparable snapshots, and differences should be examined alongside review counts. Because Google may take up to two weeks to update a displayed score after a new review, apparent changes in collection windows may not align perfectly with the dates on which customers submitted feedback.
4. Key Research Findings and Market Implications
Customer experience varies at the outlet level
National averages can hide underperforming branches. Retailers should identify stores that consistently score below comparable outlets and investigate whether their problems involve service quality, billing, inventory, product knowledge, or store accessibility.
Review volume changes the interpretation of ratings
A rating with a large review base may be more stable than one supported by very few reviews. A stronger report therefore combines the mean and median ratings with outlet counts, review-volume bands, and the share of stores falling below an agreed threshold.
Local competition provides essential context
A retailer with a 4.1 rating might be competitive in one locality but lag behind nearby alternatives in another. Comparing stores within the same shopping district or a defined geographic radius provides a more useful operational benchmark than comparing distant outlets without context.
Review themes explain what star ratings cannot
Ratings indicate the overall score but do not explain the reasons behind customer satisfaction or dissatisfaction. Where permitted, analysis of public review text can reveal recurring concerns about staff interactions, billing queues, product availability, returns, cleanliness, and service turnaround.
These themes should be validated against an appropriate sample, including regional-language feedback where feasible. Automated classification can support large-scale analysis, but quality checks are necessary to avoid treating sarcasm, ambiguous comments, or unrelated feedback as reliable evidence.
Store managers need actionable performance indicators
A useful reporting dashboard should highlight outlets with falling ratings, increasing negative feedback, unresolved recurring complaints, or unusually high review activity. These indicators can help teams prioritise store visits and improvement programmes without assuming that every negative review reflects a systemic problem.
5. Methodology for Building a Reliable 2026 Report
A dependable study should follow a repeatable collection and validation process rather than selecting a handful of highly visible stores.
- Define the brand universe: Select retail brands and categories, specify the ten cities, and establish consistent criteria for eligible store listings.
- Collect public listing information: Record store names, addresses, coordinates where available, ratings, review counts, listing identifiers, and collection timestamps.
- Validate outlet identity: Detect duplicate listings, closed branches, renamed outlets, and locations incorrectly assigned to a brand or category.
- Standardise the dataset: Apply consistent city names, category definitions, rating formats, review-count fields, and reporting periods.
- Calculate comparable metrics: Compute brand and city averages, medians, rating distributions, review-volume indicators, and rating changes between comparable snapshots.
- Analyse review themes: Where permitted, examine relevant public review content to identify common complaints and positive experiences, using quality checks for automated classifications.
- Create the final report: Publish brand rankings, city comparisons, store-level exceptions, collection dates, sample sizes, and limitations alongside the findings.
Google's documentation confirms that review scores are displayed on a five-star scale and represent the average of published ratings for each business. Consequently, a robust study should preserve the original store-level score rather than treating it as a custom sentiment index.
The research design should also distinguish between a complete sample of identified outlets and a sample drawn from visible search results. Google Maps results can vary with search location and other contextual factors. A clearly documented sampling method is essential for interpreting the resulting rankings.
6. Business Applications of Retail Rating Intelligence
The report can support several practical business decisions.
- Competitive benchmarking: Identify brands and outlets that outperform or underperform comparable local competitors.
- Customer experience management: Prioritise recurring issues and track whether operational changes coincide with rating improvements.
- Expansion planning: Combine store reputation indicators with population, commercial activity, accessibility, and competitor density to support location assessments.
- Franchise monitoring: Compare independently operated branches against consistent brand-level standards.
- Retail property analysis: Help shopping centre operators understand tenant reputation patterns and identify potential service issues.
- Marketing optimisation: Identify locations where improved business information and customer experience may strengthen local discovery.
Google also recommends maintaining an accurate Business Profile with useful information such as opening hours, addresses, and available services to help customers make informed decisions before visiting a physical store.
These applications are most valuable when rating data is integrated with additional business indicators. Google Maps ratings alone cannot establish store revenue, footfall, customer retention, or profitability; those outcomes require independent evidence.
Conclusion
India’s retail landscape requires a more granular approach to reputation measurement in 2026. A national brand average can conceal substantial differences between outlets, while city-level comparisons can reveal where local customer experience deserves closer attention. Combining star ratings, review counts, rating movements, and validated review themes creates a more useful foundation for competitive benchmarking and operational improvement.
A structured retail store review analysis India programme can help retailers identify recurring service concerns, monitor customer feedback, and prioritise branches for further investigation. Consistent collection dates, comparable store samples, and transparent calculations are essential for producing credible conclusions.
Effective Google Maps business data extraction can organise publicly displayed business information into standardised datasets that support location-level comparisons, dashboards, and periodic reporting. The resulting intelligence should be validated against current listings and used in accordance with applicable platform terms and privacy requirements.
Finally, a carefully configured Google Maps data scraper India workflow can support repeatable research across brands, cities, and retail categories when collection methods are permitted and data quality is monitored. The strongest 2026 report will not simply rank retailers by their star ratings; it will explain the differences, identify actionable patterns, and clearly separate verified observations from illustrative benchmarks.
Experience top-notch web scraping service and mobile app scraping solutions with iWeb Data Scraping. Our skilled team excels in extracting various data sets, including retail store locations and beyond. Connect with us today to learn how our customized services can address your unique project needs, delivering the highest efficiency and dependability for all your data requirements.