
41.7K+
TOTAL RESTAURANT AND MENU RECORDS PROCESSED

Grab Data Scraping Helped a Regional Food Brand Track Competitor Menus, Pricing, Promotions, and Product Availability Across Southeast Asia.
This case study is based on a real-world enterprise scenario where a regional food brand leverages large-scale restaurant and food delivery platform data extraction through Grab data scraping to transform fragmented menu listings, pricing information, promotional offers, and product availability records into structured business intelligence. The project demonstrates how GrabFood data scraping can help businesses understand regional restaurant competition, monitor pricing movements, and improve menu positioning across Southeast Asian markets.
It is designed for:
The client's central requirement was to establish consistent visibility into the rapidly changing restaurant marketplace. Although GrabFood provided access to extensive restaurant listings and menus, collecting comparable information manually across different countries, cities, and delivery locations was challenging.
A regional food brand operating across Southeast Asia wanted to improve its competitive intelligence capabilities by understanding restaurant assortment, menu pricing, promotional activity, and product availability across multiple GrabFood markets. Its existing research process relied heavily on manual browsing, spreadsheets, and occasional competitor checks, making it difficult to maintain accurate and consistent market information.
The organization also wanted to understand adjacent digital commerce signals, including GrabMart product data, to evaluate grocery, packaged food, and convenience product assortment. In addition, selected mobility indicators, such as Grab ride fare data, were considered useful for understanding broader platform pricing movements and potential relationships between delivery-market activity and local operating conditions.
The iWeb Data Intelligence team designed a structured extraction and analytics framework that collected restaurant information, menu descriptions, item-level prices, promotional offers, delivery-related details, and availability indicators from supported GrabFood market interfaces.
The solution organized information by country, city, restaurant, cuisine, category, and individual menu item. It also standardized currencies, product naming conventions, portion descriptions, and promotional fields to make cross-market comparisons more meaningful.
The project established a unified regional dataset covering restaurant assortment, pricing differences, discount activity, and menu changes. Automated processing helped identify price movements, discontinued products, newly introduced dishes, and promotional patterns without depending on repeated manual research.
The client operated in a highly competitive regional food environment where restaurant prices, product availability, and promotional campaigns changed frequently. Monitoring these changes across multiple Southeast Asian countries created several operational and analytical challenges.
Fragmented Regional Market Information
The client struggled to consolidate Southeast Asia food delivery data from different countries and city-level markets. Each market contained different restaurant selections, currencies, cuisine preferences, menu structures, and promotional practices. This fragmentation prevented the organization from developing a consistent regional overview.
Limited Menu and Pricing Visibility
Obtaining comparable Grab menu and pricing data was another major challenge. Restaurant listings frequently contained different item names, portion sizes, add-ons, meal combinations, and promotional prices. Without standardized records, comparing similar dishes across competing restaurants became difficult.
Frequent Price and Promotional Changes
Restaurant prices and discounts could change between monitoring cycles. Limited visibility into these movements made it challenging to determine whether competitors were adjusting regular prices, introducing temporary promotions, or changing meal combinations to attract customers.
Inconsistent Product Availability
Some restaurants displayed products that were temporarily unavailable, while other menu items appeared only during specific periods or under particular delivery locations. The client lacked a reliable historical record to distinguish temporary unavailability from permanent menu removal.
Manual Monitoring Limitations
The existing research process involved individual restaurant searches, screenshots, spreadsheet updates, and manual comparisons. Although this approach provided occasional insights, it consumed considerable time and made continuous monitoring difficult. The organization needed Grab data scraping to automate repetitive collection activities and establish a consistent intelligence pipeline.
The client also struggled to answer several operational questions:
To overcome these limitations, the client transitioned from manual restaurant monitoring to an automated extraction and analytics framework. The system continuously collected available restaurant and menu information from selected markets, standardized records, and prepared datasets for competitive benchmarking.
By adopting an automated approach to restaurant data extraction, the client replaced fragmented manual monitoring with a structured intelligence pipeline that continuously captures restaurant listings, menu information, pricing changes, promotional offers, and availability indicators across selected GrabFood markets.
| Dimension | Manual Monitoring | Structured Data Scraping System |
|---|---|---|
| Data collection | Individual restaurant searches | Automated collection across selected markets |
| Menu monitoring | Periodic manual checks | Scheduled menu-level extraction |
| Price tracking | Spreadsheet-based updates | Structured historical price records |
| Discount analysis | Manual promotional observation | Automated discount and offer comparison |
| Availability tracking | Occasional product checks | Repeated availability monitoring |
| Market coverage | Limited restaurants and locations | Scalable multi-city coverage |
| Currency handling | Manual conversion | Standardized currency fields |
| Data organization | Disconnected spreadsheets | Centralized structured database |
| Competitor analysis | Subjective comparisons | Comparable restaurant-level metrics |
| Reporting | Manually prepared reports | Automated dashboards and exports |
The new framework improved the consistency of information collection and allowed the client to evaluate competitors using comparable fields. Rather than treating each restaurant listing as an isolated record, the system created a connected dataset covering restaurants, menu items, prices, categories, promotions, and locations.
The brand in focus is an anonymized regional food business operating within Southeast Asia's rapidly expanding restaurant and food delivery ecosystem. Its portfolio includes multiple food categories, including quick-service meals, casual dining, beverages, snacks, and ready-to-eat products.
The organization serves customers through a combination of physical restaurant outlets, digital ordering channels, and third-party food delivery platforms. As its regional presence expanded, the company recognized that maintaining competitive pricing and relevant menu assortments required a deeper understanding of local market conditions.
Different countries presented different commercial realities. A meal combination that performed well in Singapore might require different pricing or portion positioning in Malaysia. Similarly, popular beverage categories in Thailand could differ from customer preferences in Vietnam or the Philippines.
The brand wanted to understand these differences using measurable market intelligence rather than relying exclusively on individual market observations.
iWeb Data Intelligence developed an end-to-end data extraction and processing solution to convert publicly accessible and otherwise authorized GrabFood information into structured competitive intelligence.
The implementation followed a systematic workflow covering market selection, data extraction, normalization, validation, enrichment, storage, and reporting.
Market and Location Identification
The first stage involved identifying the countries, cities, and delivery locations relevant to the client's competitive research. Coverage was organized around selected markets in Singapore, Malaysia, Indonesia, Thailand, Vietnam, and the Philippines.
Restaurant discovery was performed across relevant cuisine categories, including burgers, pizza, Asian meals, desserts, beverages, bakery products, and traditional regional food offerings.
Automated Restaurant Data Collection
The extraction framework collected available restaurant-level information, including restaurant names, cuisine classifications, location identifiers, listing details, delivery information, and relevant customer-facing indicators.
These records established the foundation for connecting individual restaurants with their respective menu items and market locations.
Menu-Level Data Extraction
The next stage captured available menu information, including item names, descriptions, categories, portion sizes, variants, add-ons, and displayed prices.
Where supported by the source, promotional pricing and regular pricing were recorded separately. This distinction helped the client evaluate the actual displayed discount against the standard menu price.
Pricing and Promotional Intelligence
The system captured price information across selected restaurants and delivery locations. It identified differences between regular and promotional prices, recorded discount labels, and tracked changes between scheduled collection cycles.
This allowed the client to compare competing products and understand how promotional activity influenced market positioning.
Data Cleaning and Standardization
Raw information was processed through automated validation and normalization procedures. Duplicate records were removed, inconsistent naming conventions were standardized, and currencies were mapped to their respective markets.
Menu descriptions were also organized into consistent categories, making it easier to compare equivalent products across different restaurant brands.
A typical normalized record contained:
After collection, the raw records passed through several processing stages.
Restaurant Normalization: Restaurant names and identifiers were standardized so that equivalent records could be mapped consistently across markets.
For example, variations in restaurant naming, cuisine labels, and location descriptions were normalized to reduce duplicate records.
Menu Normalization: Menu item names and descriptions were standardized to ensure that comparable products could be analyzed consistently across restaurants.
Price Classification: The system categorized observations into states such as regular price, offer price, or normalized price, depending on the data returned during collection.
Duplicate Removal: Repeated records generated during overlapping collection cycles were identified and handled using restaurant, menu item, location, and timestamp combinations.
Historical Storage: Each observation was timestamped, enabling the client to calculate price movements and promotional cycles over time.
Alert Prioritization: The analytics layer identified high-priority situations, including restaurants showing significant price deviations or repeated availability changes across markets.
The final dataset was connected to dashboards where analysts could filter information by country, city, cuisine, category, and time period.
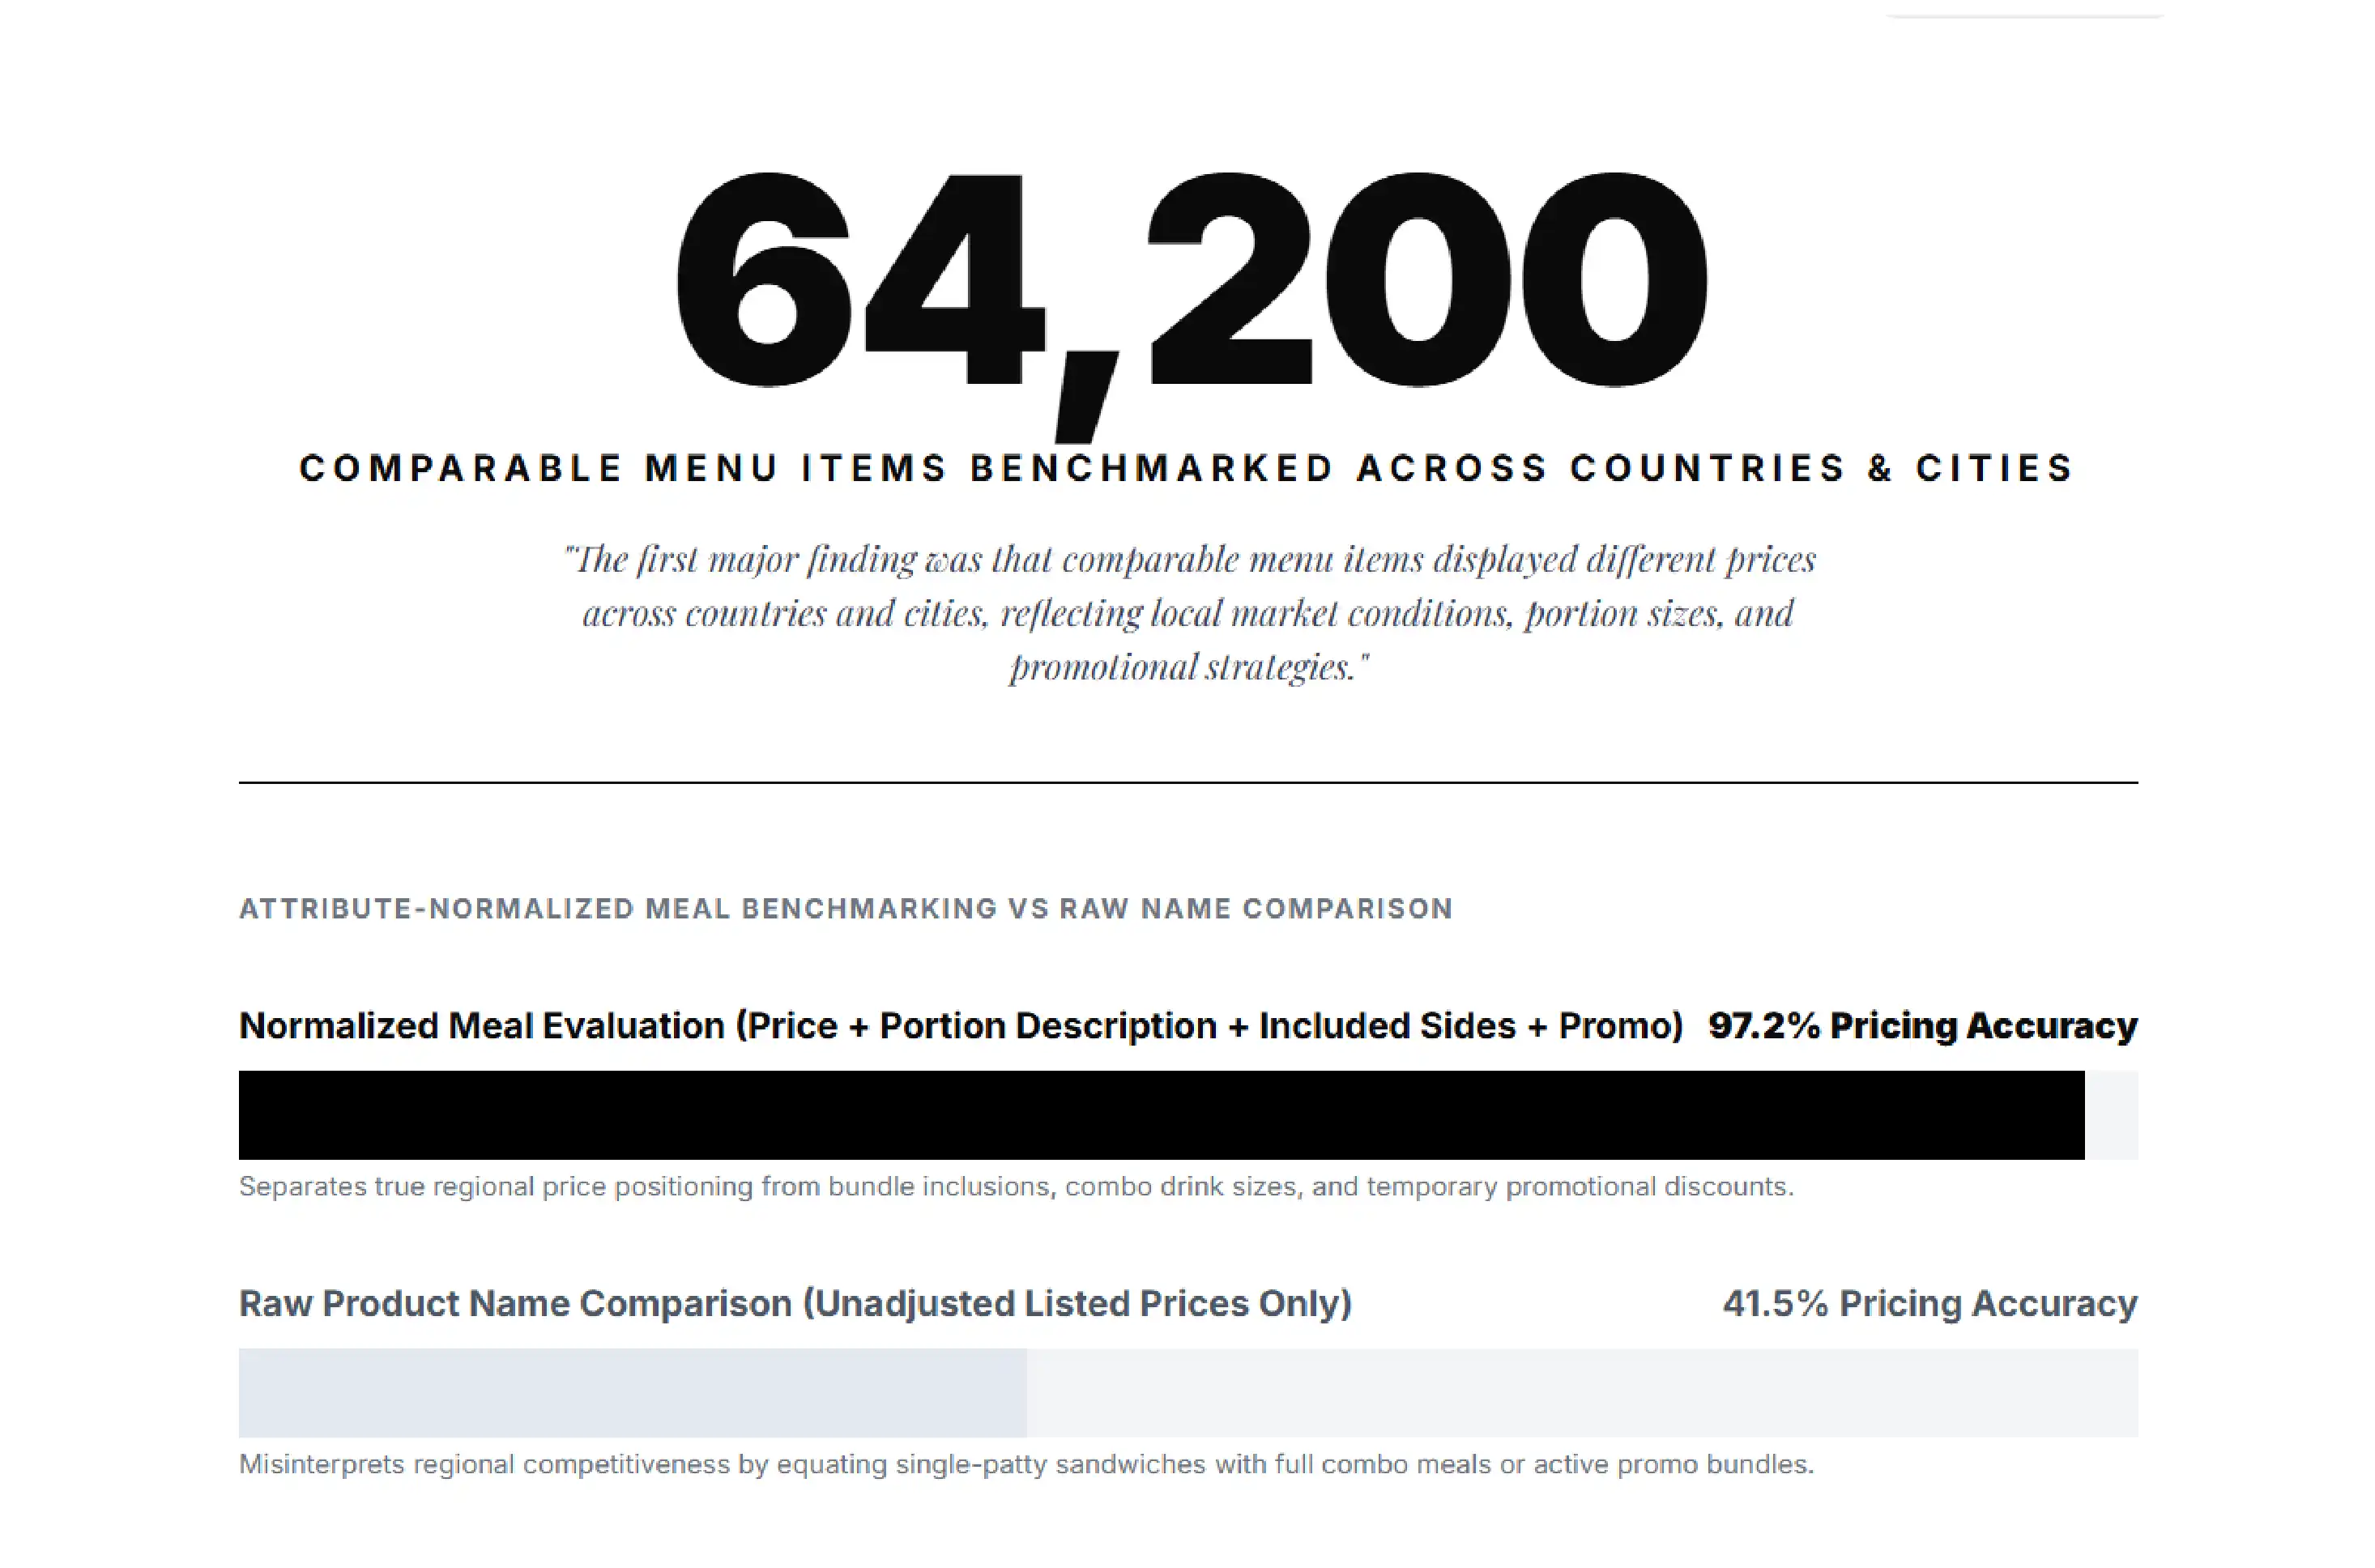
The first major finding was that comparable menu items displayed different prices across countries and cities. These differences reflected local market conditions, restaurant positioning, portion sizes, ingredient costs, and promotional strategies.
The consolidated dataset allowed the client to compare similar products across competing restaurant brands while considering market-specific differences.
For example, a burger meal offered by competing restaurants could be evaluated using its listed price, portion description, included sides, and promotional status rather than relying on the product name alone.
This helped the brand identify markets where its menu positioning appeared comparatively expensive or where selected products could support stronger premium positioning.
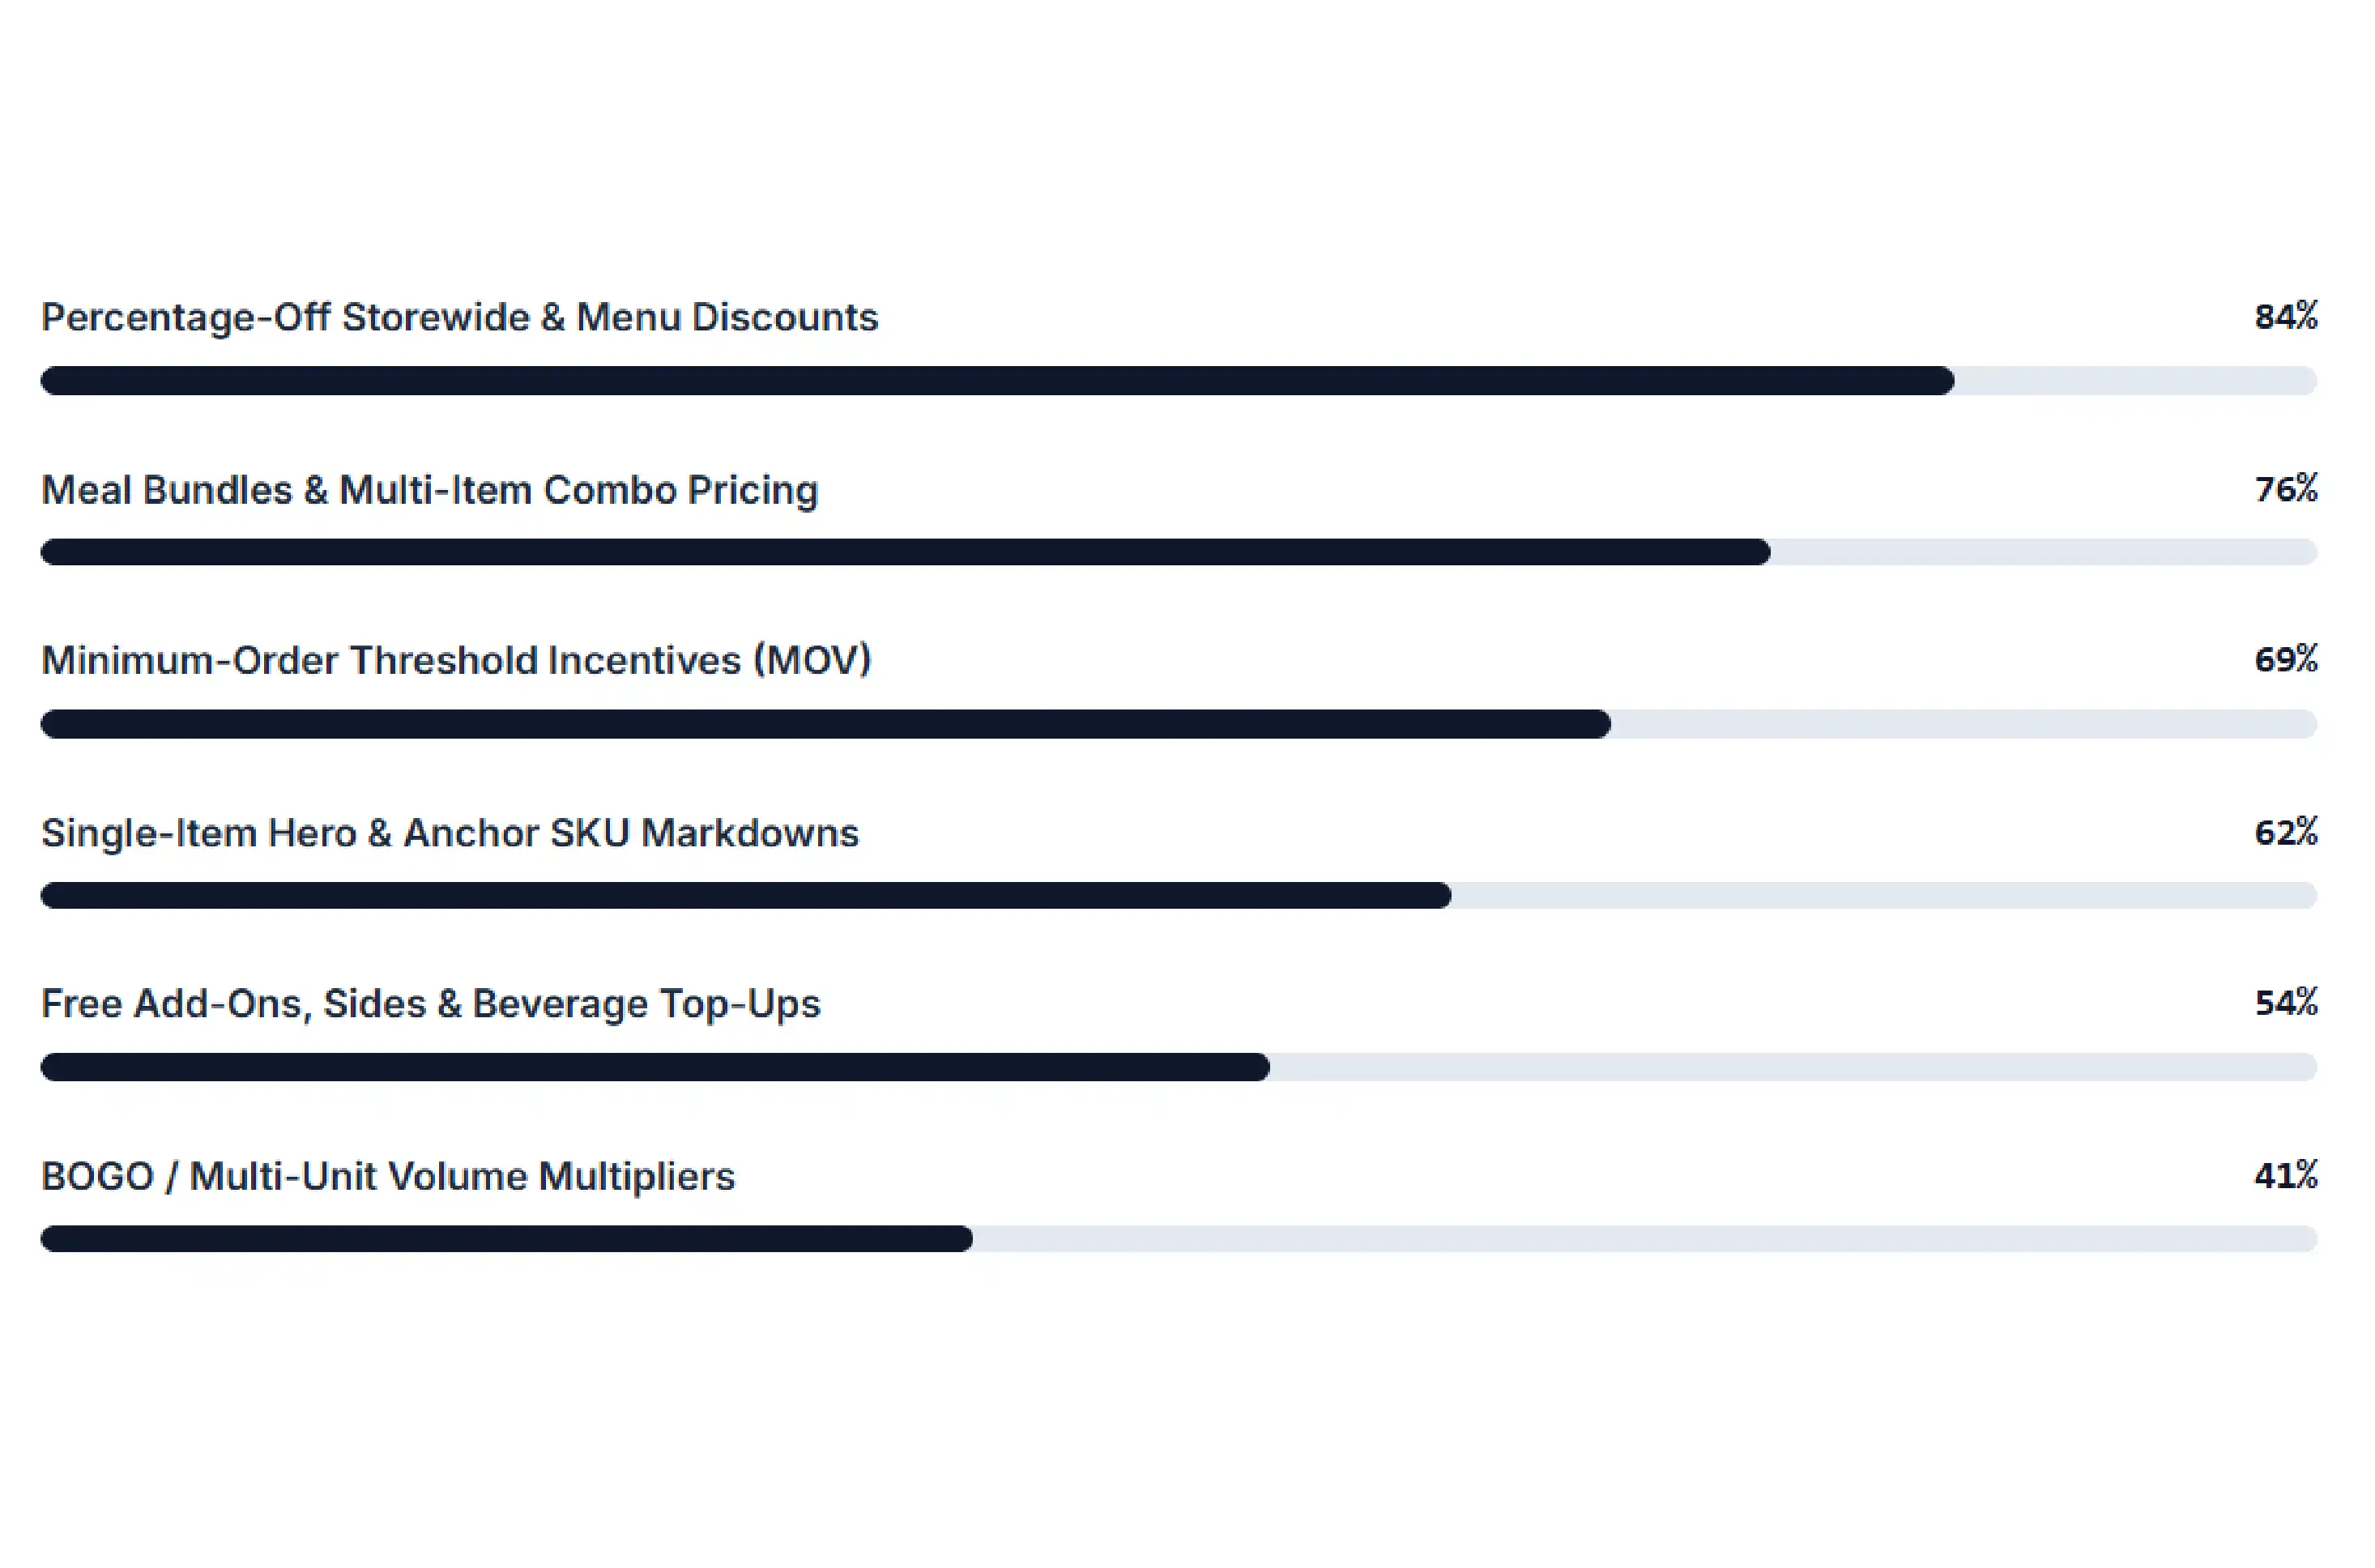
The second finding highlighted differences in promotional behavior across food categories. Quick-service restaurants, beverage outlets, pizza brands, and dessert businesses used different discount structures to attract customers.
Some competitors promoted individual menu items, while others emphasized meal bundles, percentage discounts, free add-ons, or minimum-order incentives.
By organizing promotional information into standardized fields, the client could compare discount frequency, promotional depth, and the relationship between regular and displayed prices.
This provided a clearer understanding of how competitors used offers to increase visibility and encourage larger orders.
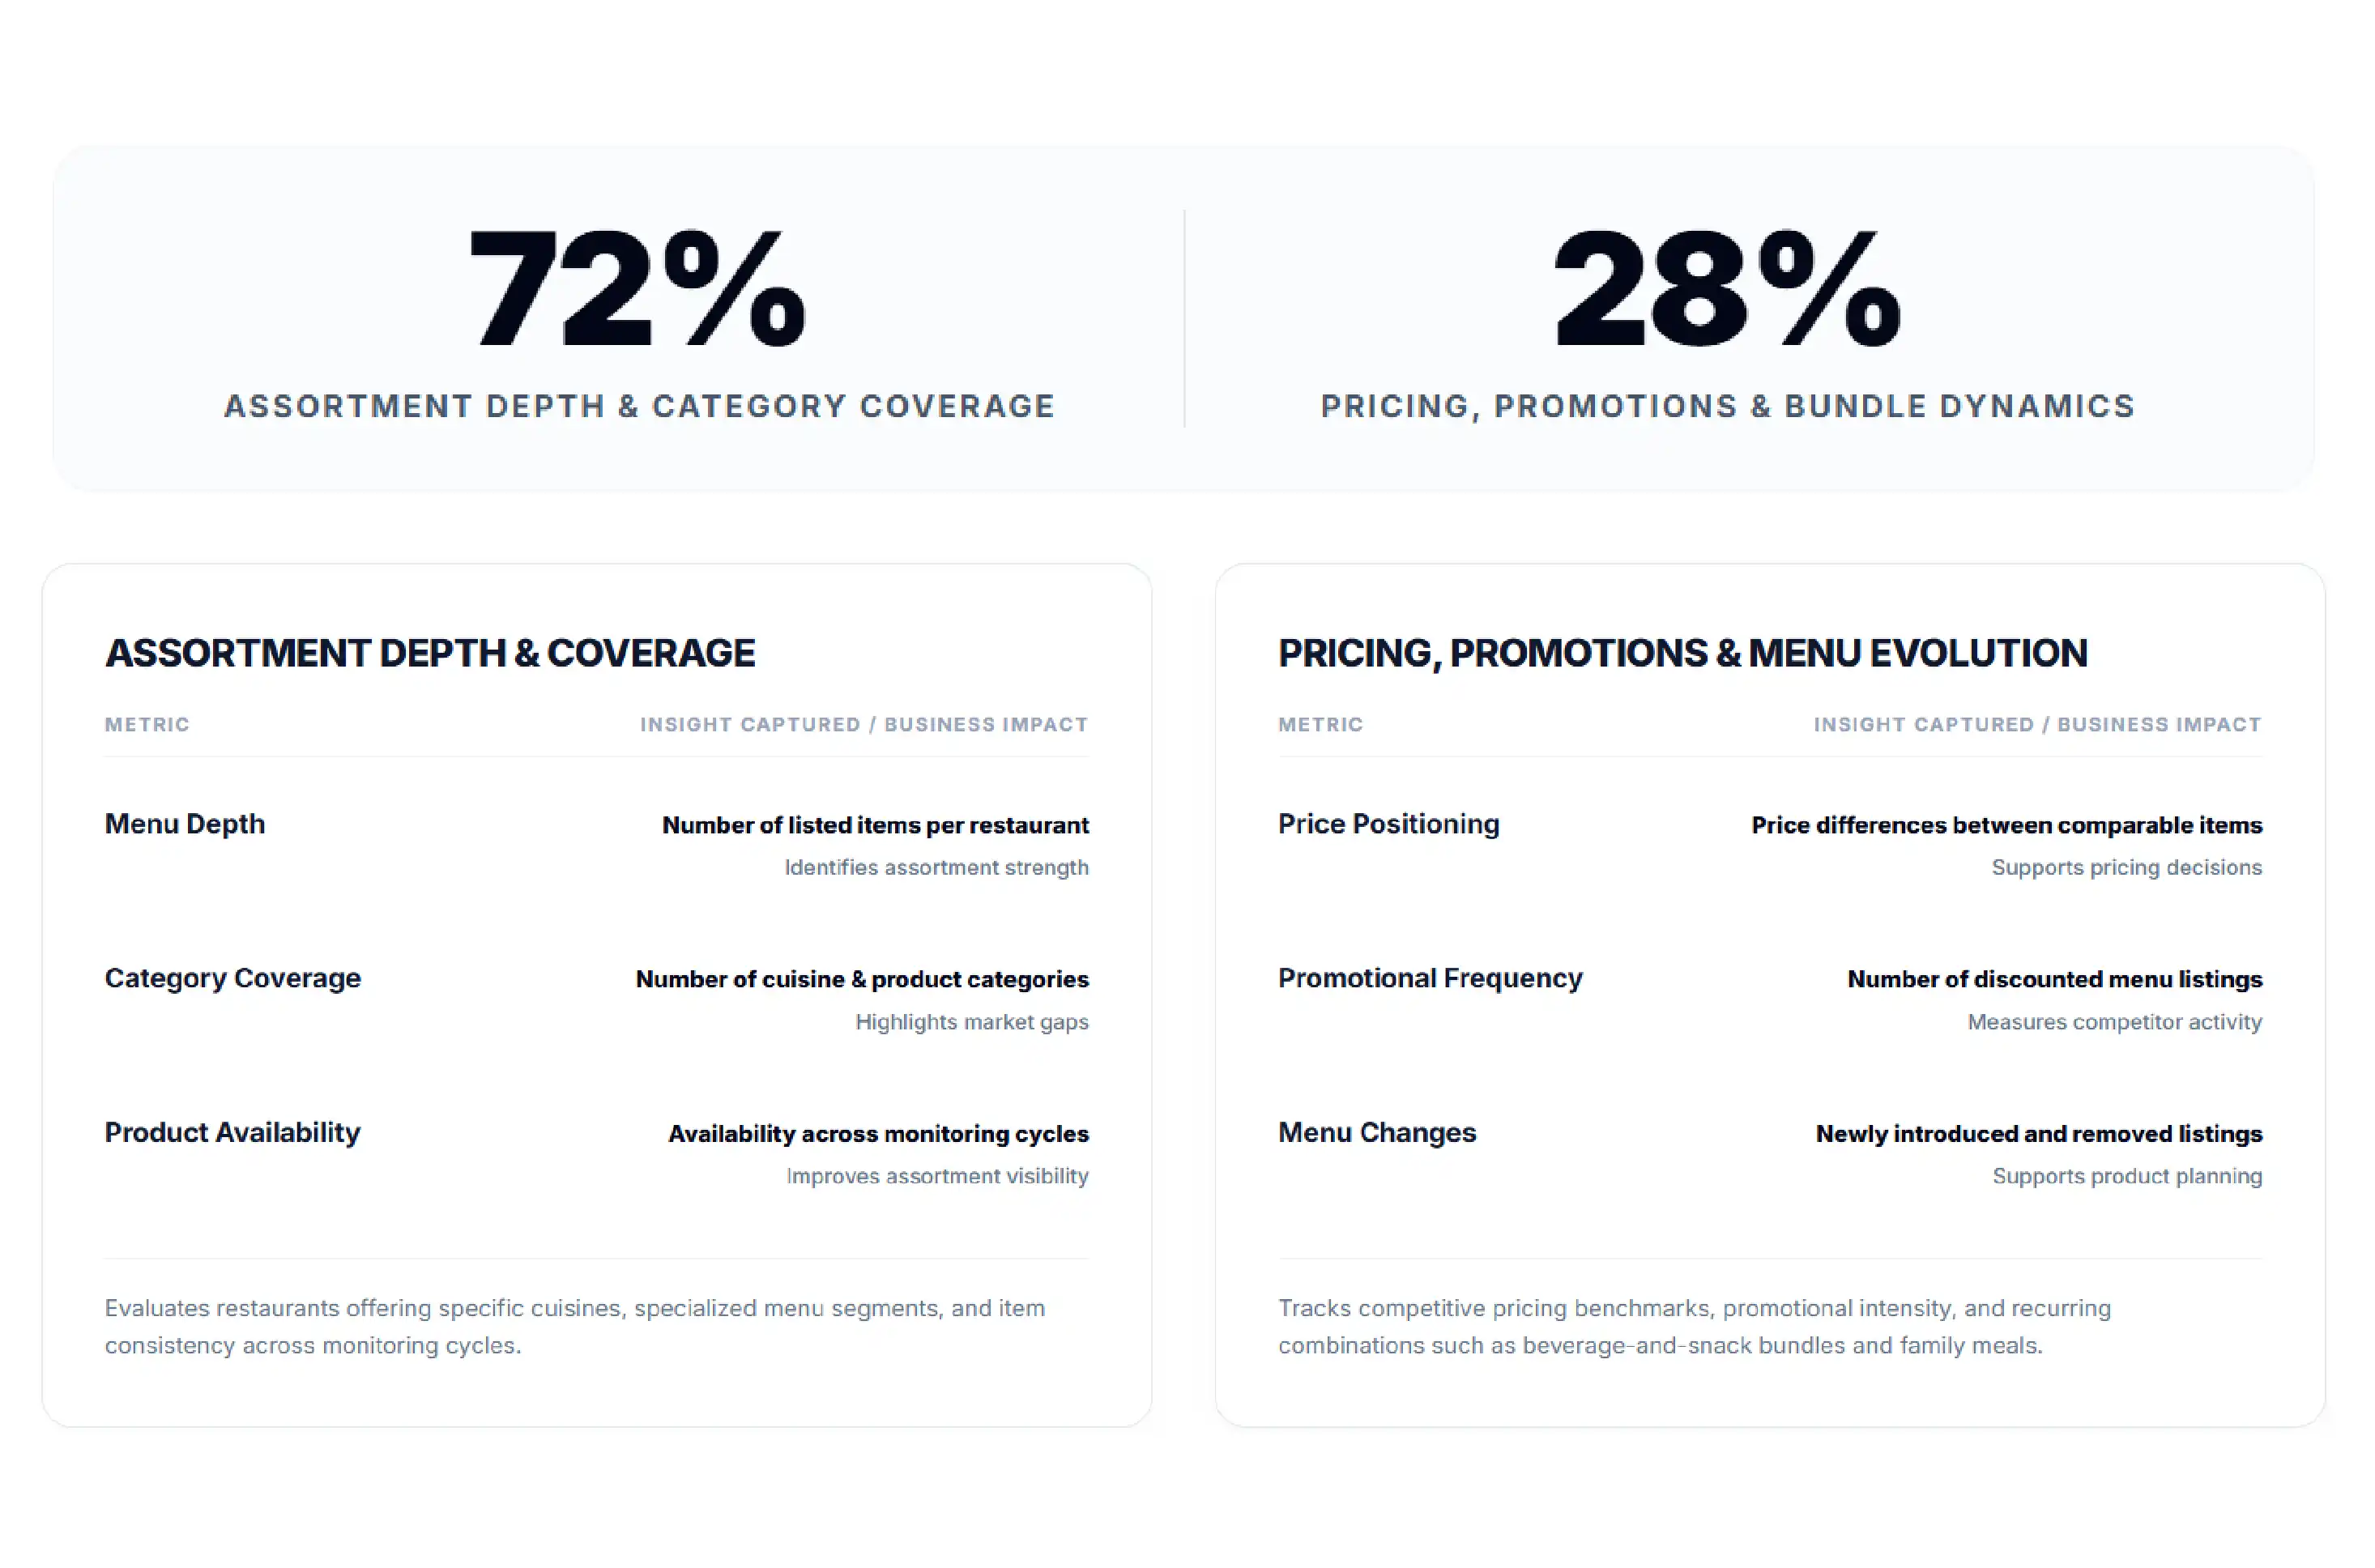
The third finding focused on restaurant assortment and menu depth. The collected information helped identify categories with extensive competitor offerings and categories where fewer comparable products were listed.
The client could evaluate the number of restaurants offering specific cuisines, the variety of products within each category, and the presence of specialized menu segments.
These insights supported decisions concerning product innovation, category expansion, and localized menu development.
The analysis also helped identify recurring combinations, such as beverage-and-snack bundles, family meals, and multi-item promotional packages.
| Metric | Insight Captured | Business Impact |
|---|---|---|
| Menu Depth | Number of listed items per restaurant | Identifies assortment strength |
| Category Coverage | Number of cuisine and product categories | Highlights market gaps |
| Price Positioning | Price differences between comparable items | Supports pricing decisions |
| Promotional Frequency | Number of discounted menu listings | Measures competitor activity |
| Product Availability | Availability across monitoring cycles | Improves assortment visibility |
| Menu Changes | Newly introduced and removed listings | Supports product planning |
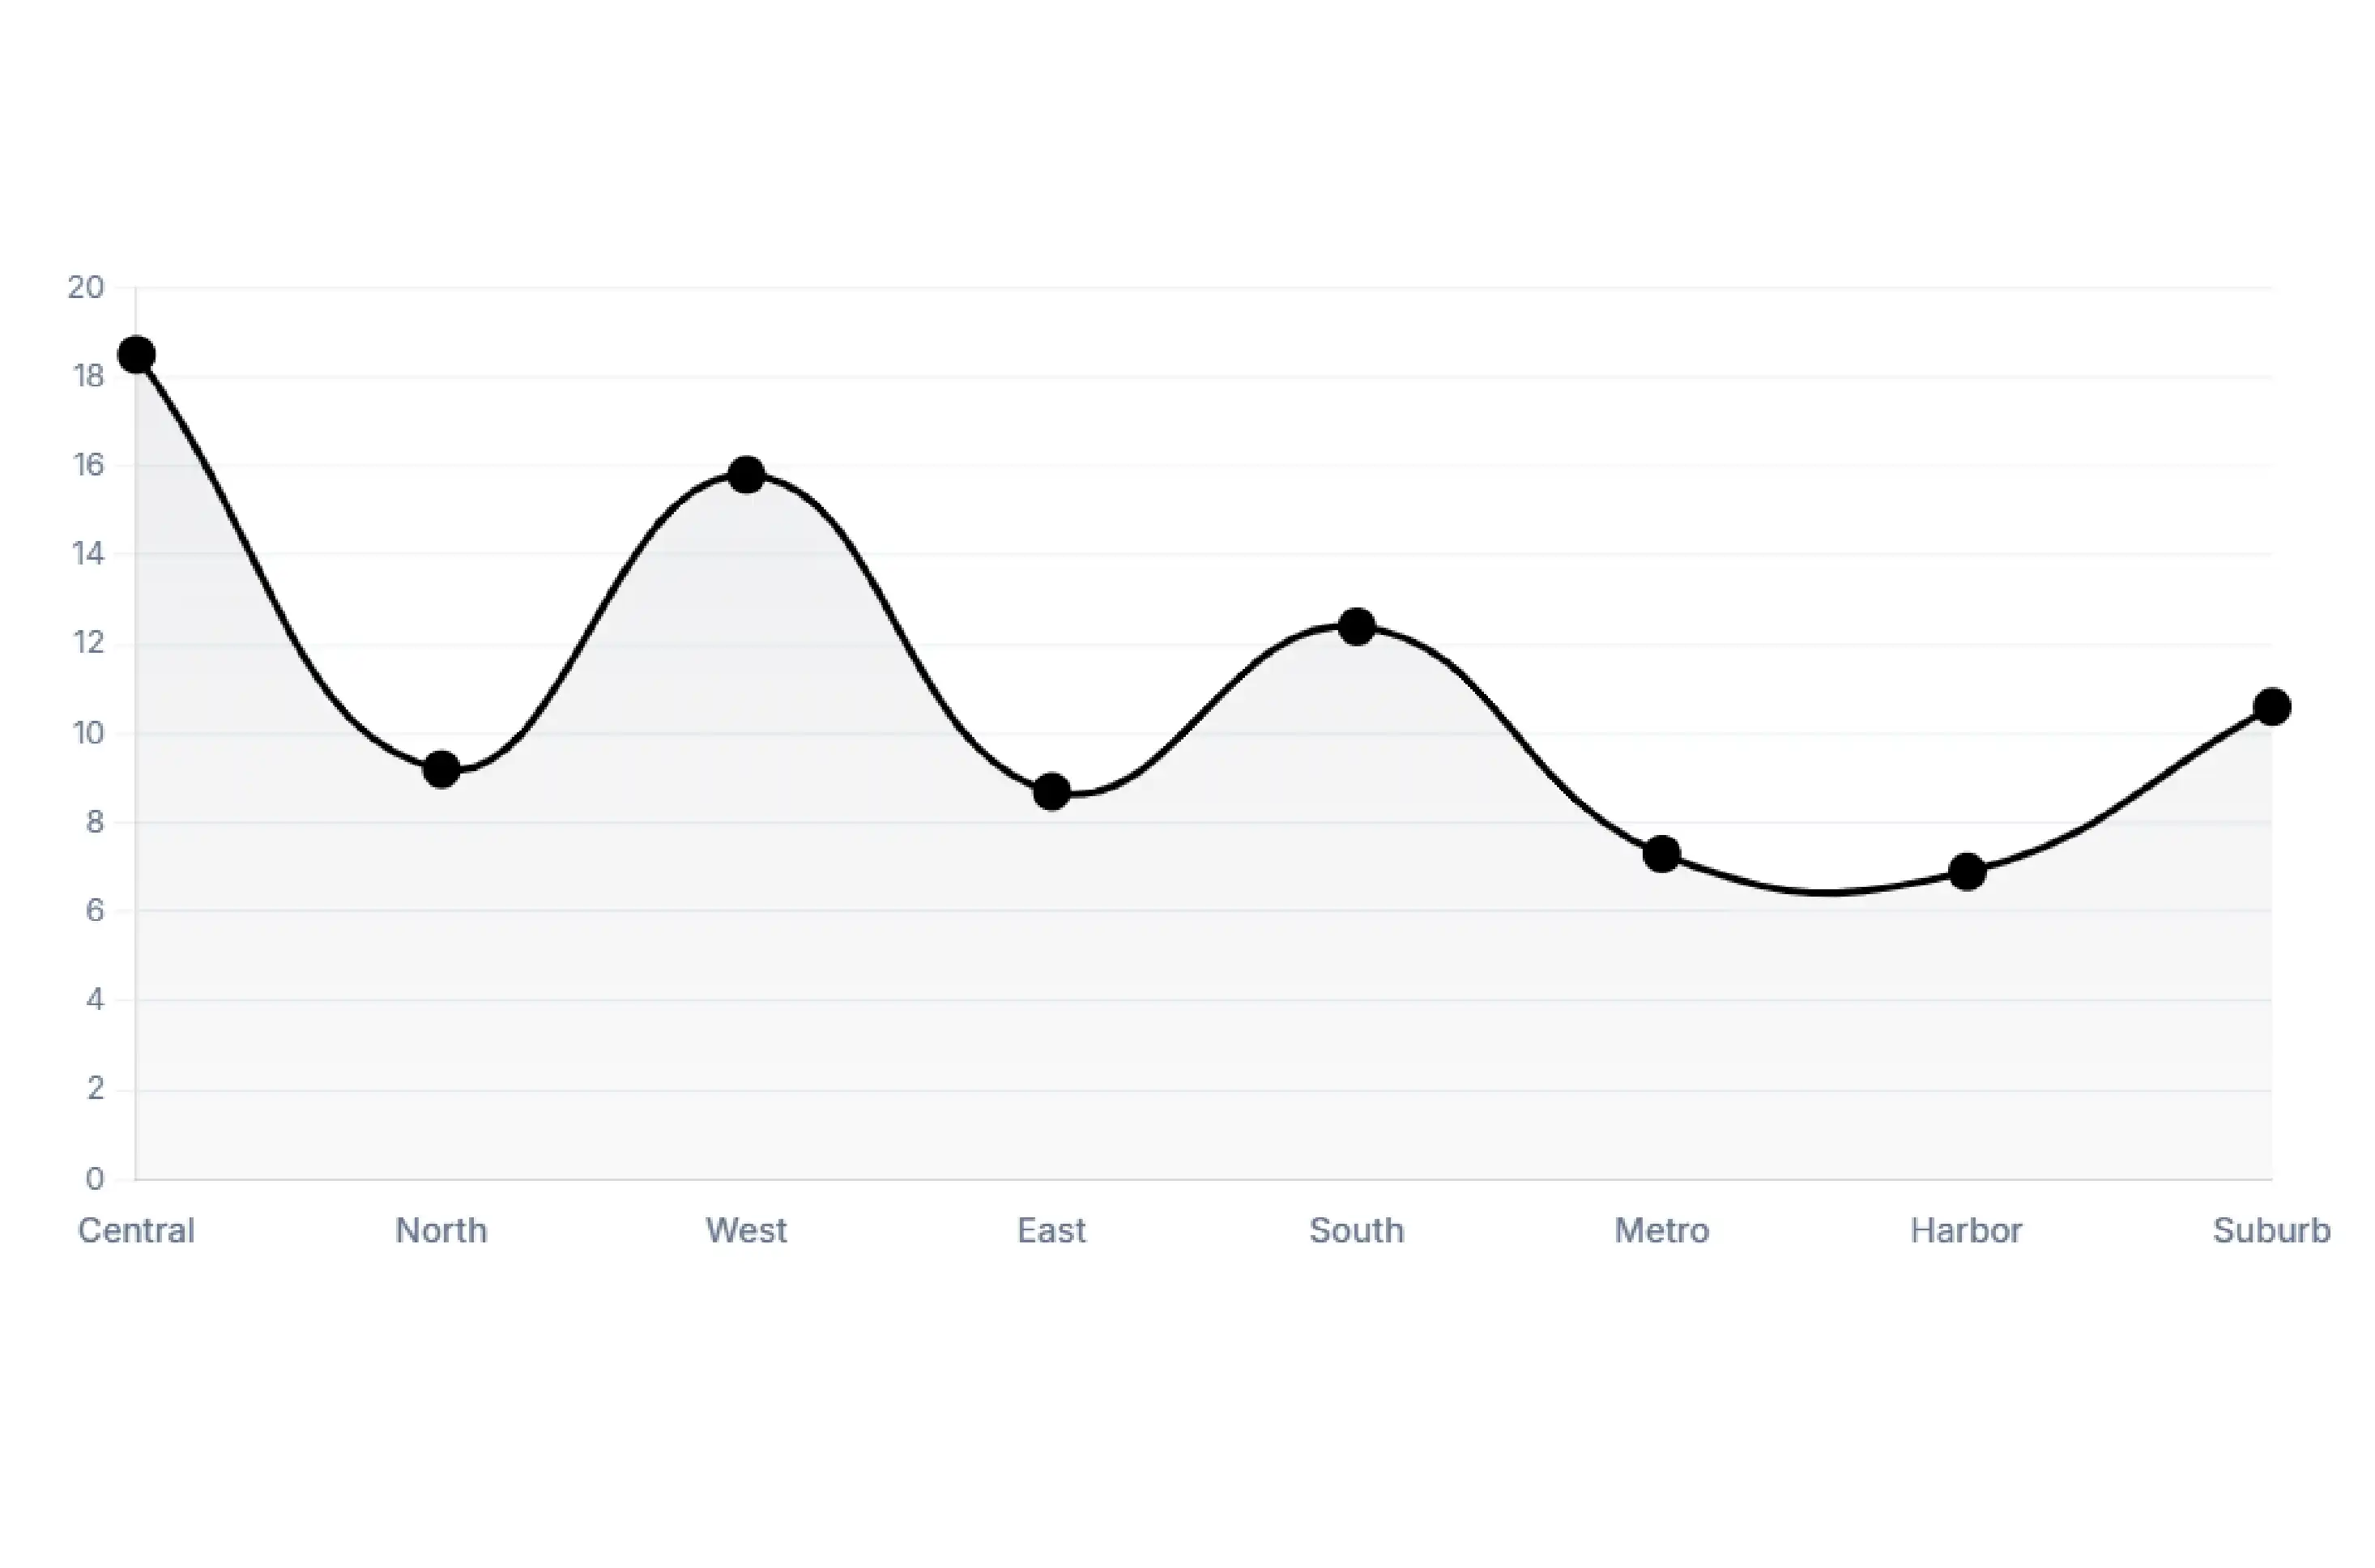
The fourth finding demonstrated the importance of tracking availability alongside menu prices. A listed product did not necessarily remain available throughout every monitoring cycle or across every delivery location.
By recording availability observations with timestamps, the client could distinguish between products that were consistently listed and those that experienced repeated unavailability.
This helped the organization assess competitor assortment reliability and avoid interpreting every missing listing as a permanent product discontinuation.
It also supported better decisions regarding menu planning, demand forecasting, and product positioning in selected markets.
The following illustrative dataset demonstrates how restaurant and menu information can be organized for competitive benchmarking. The records are representative examples created to explain the analytical framework and are not verified live GrabFood listings.
| Country | Restaurant | Cuisine | Menu Item | Regular Price | Offer Price |
|---|---|---|---|---|---|
| Singapore | Urban Grill | Burgers | Classic Cheeseburger | SGD 12.90 | SGD 10.90 |
| Malaysia | Nasi Corner | Asian | Chicken Rice Set | MYR 13.50 | MYR 11.90 |
| Indonesia | Daily Bites | Fast Food | Crispy Chicken Meal | IDR 38,000 | IDR 32,000 |
| Thailand | Bangkok Kitchen | Thai | Pad Thai | THB 95 | THB 85 |
| Vietnam | Saigon Bowl | Vietnamese | Beef Noodle Bowl | VND 75,000 | VND 65,000 |
| Philippines | Manila Eats | Filipino | Chicken Rice Meal | PHP 185 | PHP 159 |
The sample illustrates how the same dataset structure can accommodate different currencies, cuisines, products, and promotional prices.
The value of this dataset was not limited to individual records.
The real advantage came from accumulating observations over time.
With thousands of records collected repeatedly, analysts could calculate price trends, identify recurring promotional patterns, compare markets, and connect menu-level availability with business decisions.
After implementing structured GrabFood data intelligence through continuous monitoring of restaurant menus and prices, the client achieved significant improvements in competitive visibility, regional benchmarking, and commercial decision-making.
The following illustrative project outcomes demonstrate the types of operational improvements measured within the case study scenario.
These figures are illustrative outcomes for the described enterprise scenario, rather than independently audited performance claims.
iWeb Data Intelligence provides structured data extraction and analytics solutions that help businesses transform fragmented online information into reliable commercial intelligence.
Unified Regional Data Collection
Our approach consolidates restaurant, menu, pricing, promotional, and availability information into standardized datasets. This allows businesses to compare competitors across different countries and cities without maintaining disconnected spreadsheets or inconsistent reporting structures.
Continuous Market Monitoring
Scheduled data collection supports regular monitoring of changing menu information, promotional campaigns, and displayed prices. Businesses can maintain updated market visibility and identify important changes without depending on occasional manual research.
Data Accuracy and Standardization
Automated cleaning, validation, normalization, and deduplication processes improve dataset consistency. Currency mapping, location identifiers, standardized categories, and collection timestamps make the information more suitable for regional benchmarking and historical analysis.
"We are extremely satisfied with the data intelligence solution delivered by iWeb Data Intelligence. The project has significantly improved how we understand the regional food delivery market. Previously, our teams spent considerable time collecting restaurant menus, comparing prices, and monitoring promotional activities across different locations. Maintaining consistent information across multiple markets was particularly challenging. The structured data extraction framework has helped us consolidate this information into a centralized reporting environment. We now have better visibility into competitor pricing, menu assortment, promotional strategies, and product availability. The dashboards have also made it easier for our commercial and marketing teams to identify market changes and evaluate opportunities. We appreciate the team's approach to data organization, accuracy, and scalability. The solution has reduced manual research activities and provided a stronger foundation for regional competitive intelligence and business planning."
— Head of Regional Business Intelligence
The project delivered a scalable regional food delivery intelligence framework that transformed fragmented restaurant listings and menu information into structured, comparable business datasets.
The client gained improved visibility into restaurant pricing, promotional activity, menu assortment, and product availability across selected Southeast Asian markets. The centralized dataset also strengthened its ability to identify competitive differences between countries, cities, and restaurant categories.
Historical monitoring helped commercial teams understand price movements, evaluate discount strategies, and identify changes in competitor offerings. Standardized records made cross-market analysis more reliable, while dashboards improved access to relevant information for pricing, marketing, and expansion decisions.
The solution also established opportunities to extend the intelligence framework beyond food delivery. Future analytical applications could include Uber Ola Rapido fare comparison for selected mobility benchmarking requirements and integration with restaurant food delivery APIs where authorized access and supported data sources are available.
The resulting infrastructure provides a foundation for broader restaurant intelligence, regional market research, pricing optimization, and automated competitive monitoring.
The company could now answer critical operational questions faster:
This shift from periodic reporting to continuous competitive intelligence strengthened the organization's ability to manage the rapidly evolving regional food delivery environment.
Most importantly, the project demonstrated that menu data visibility is not simply a pricing metric. In a competitive food delivery environment, restaurant intelligence is part of the customer experience and directly influences the opportunity to convert demand into orders.
Grab data scraping helps businesses collect available restaurant information, menus, item prices, promotional offers, cuisine categories, and product availability from supported Grab platforms. The resulting datasets can support competitor benchmarking, pricing analysis, menu research, and regional market intelligence.
Depending on source availability and authorized access, relevant fields can include restaurant names, cuisine types, menu item names, descriptions, categories, portion sizes, variants, displayed prices, promotional prices, availability indicators, location details, and collection timestamps.
Yes. A structured monitoring framework can cover selected markets, including Singapore, Malaysia, Indonesia, Thailand, Vietnam, and the Philippines, subject to platform accessibility and source coverage. Currency normalization and location mapping help make the resulting information suitable for regional comparisons.
It allows businesses to compare restaurant assortment, menu pricing, promotional activity, and product availability using standardized datasets. Historical records can also reveal pricing changes, newly introduced products, discontinued listings, and differences in competitive positioning.
Yes. iWeb Data Intelligence can develop customized data extraction and analytics frameworks based on business requirements, target markets, selected restaurants, required data fields, collection frequency, and reporting preferences. Solutions can be designed for structured datasets, dashboards, and API-based integrations where supported.
iWeb Data Intelligence helps food brands transform restaurant menus, pricing information, promotional activity, and product availability into structured business insights. Our scalable data extraction solutions support smarter pricing strategies, stronger competitor benchmarking, and more informed market expansion decisions across Southeast Asia.
Start a projectFields marked * are required. Everything else just helps us scope faster — skip what you don't know yet.