Introduction
India's direct-to-consumer fashion market is entering a more data-intensive phase in
2026. Consumers are increasingly discovering apparel through mobile-first storefronts, social
media, marketplaces and brand apps, while fashion companies are competing on price, assortment,
product velocity, discounts, designs and digital visibility. This makes structured product
intelligence increasingly important for understanding what consumers actually see when they
shop.
The Indian D2C Fashion Data Scraping Report 2026 examines the competitive
positioning of three distinctive Indian fashion businesses—Bewakoof, Newme and The Souled Store.
Their different merchandise strategies provide a useful framework for studying value fashion,
trend-led fashion and pop-culture-driven apparel.
This Bewakoof, Newme & The Souled Store data analysis focuses on assortment
architecture, pricing, discounting, SKU characteristics, category depth and competitive
positioning. The analysis is designed around the information that can be collected through
structured product monitoring, enabling brands and analysts to Scrape D2C fashion product and
pricing data across digital storefronts.
The wider Indian D2C fashion market also shows significant price concentration. A
2026 analysis of approximately 55,000 Indian D2C product listings found a median fashion/apparel
price around ₹1,200, illustrating how crowded the middle of the market has become.
The Indian D2C Fashion Landscape in 2026
D2C fashion is no longer simply about creating an online storefront. The competitive
advantage increasingly comes from understanding the digital shelf.
Brands need to know:
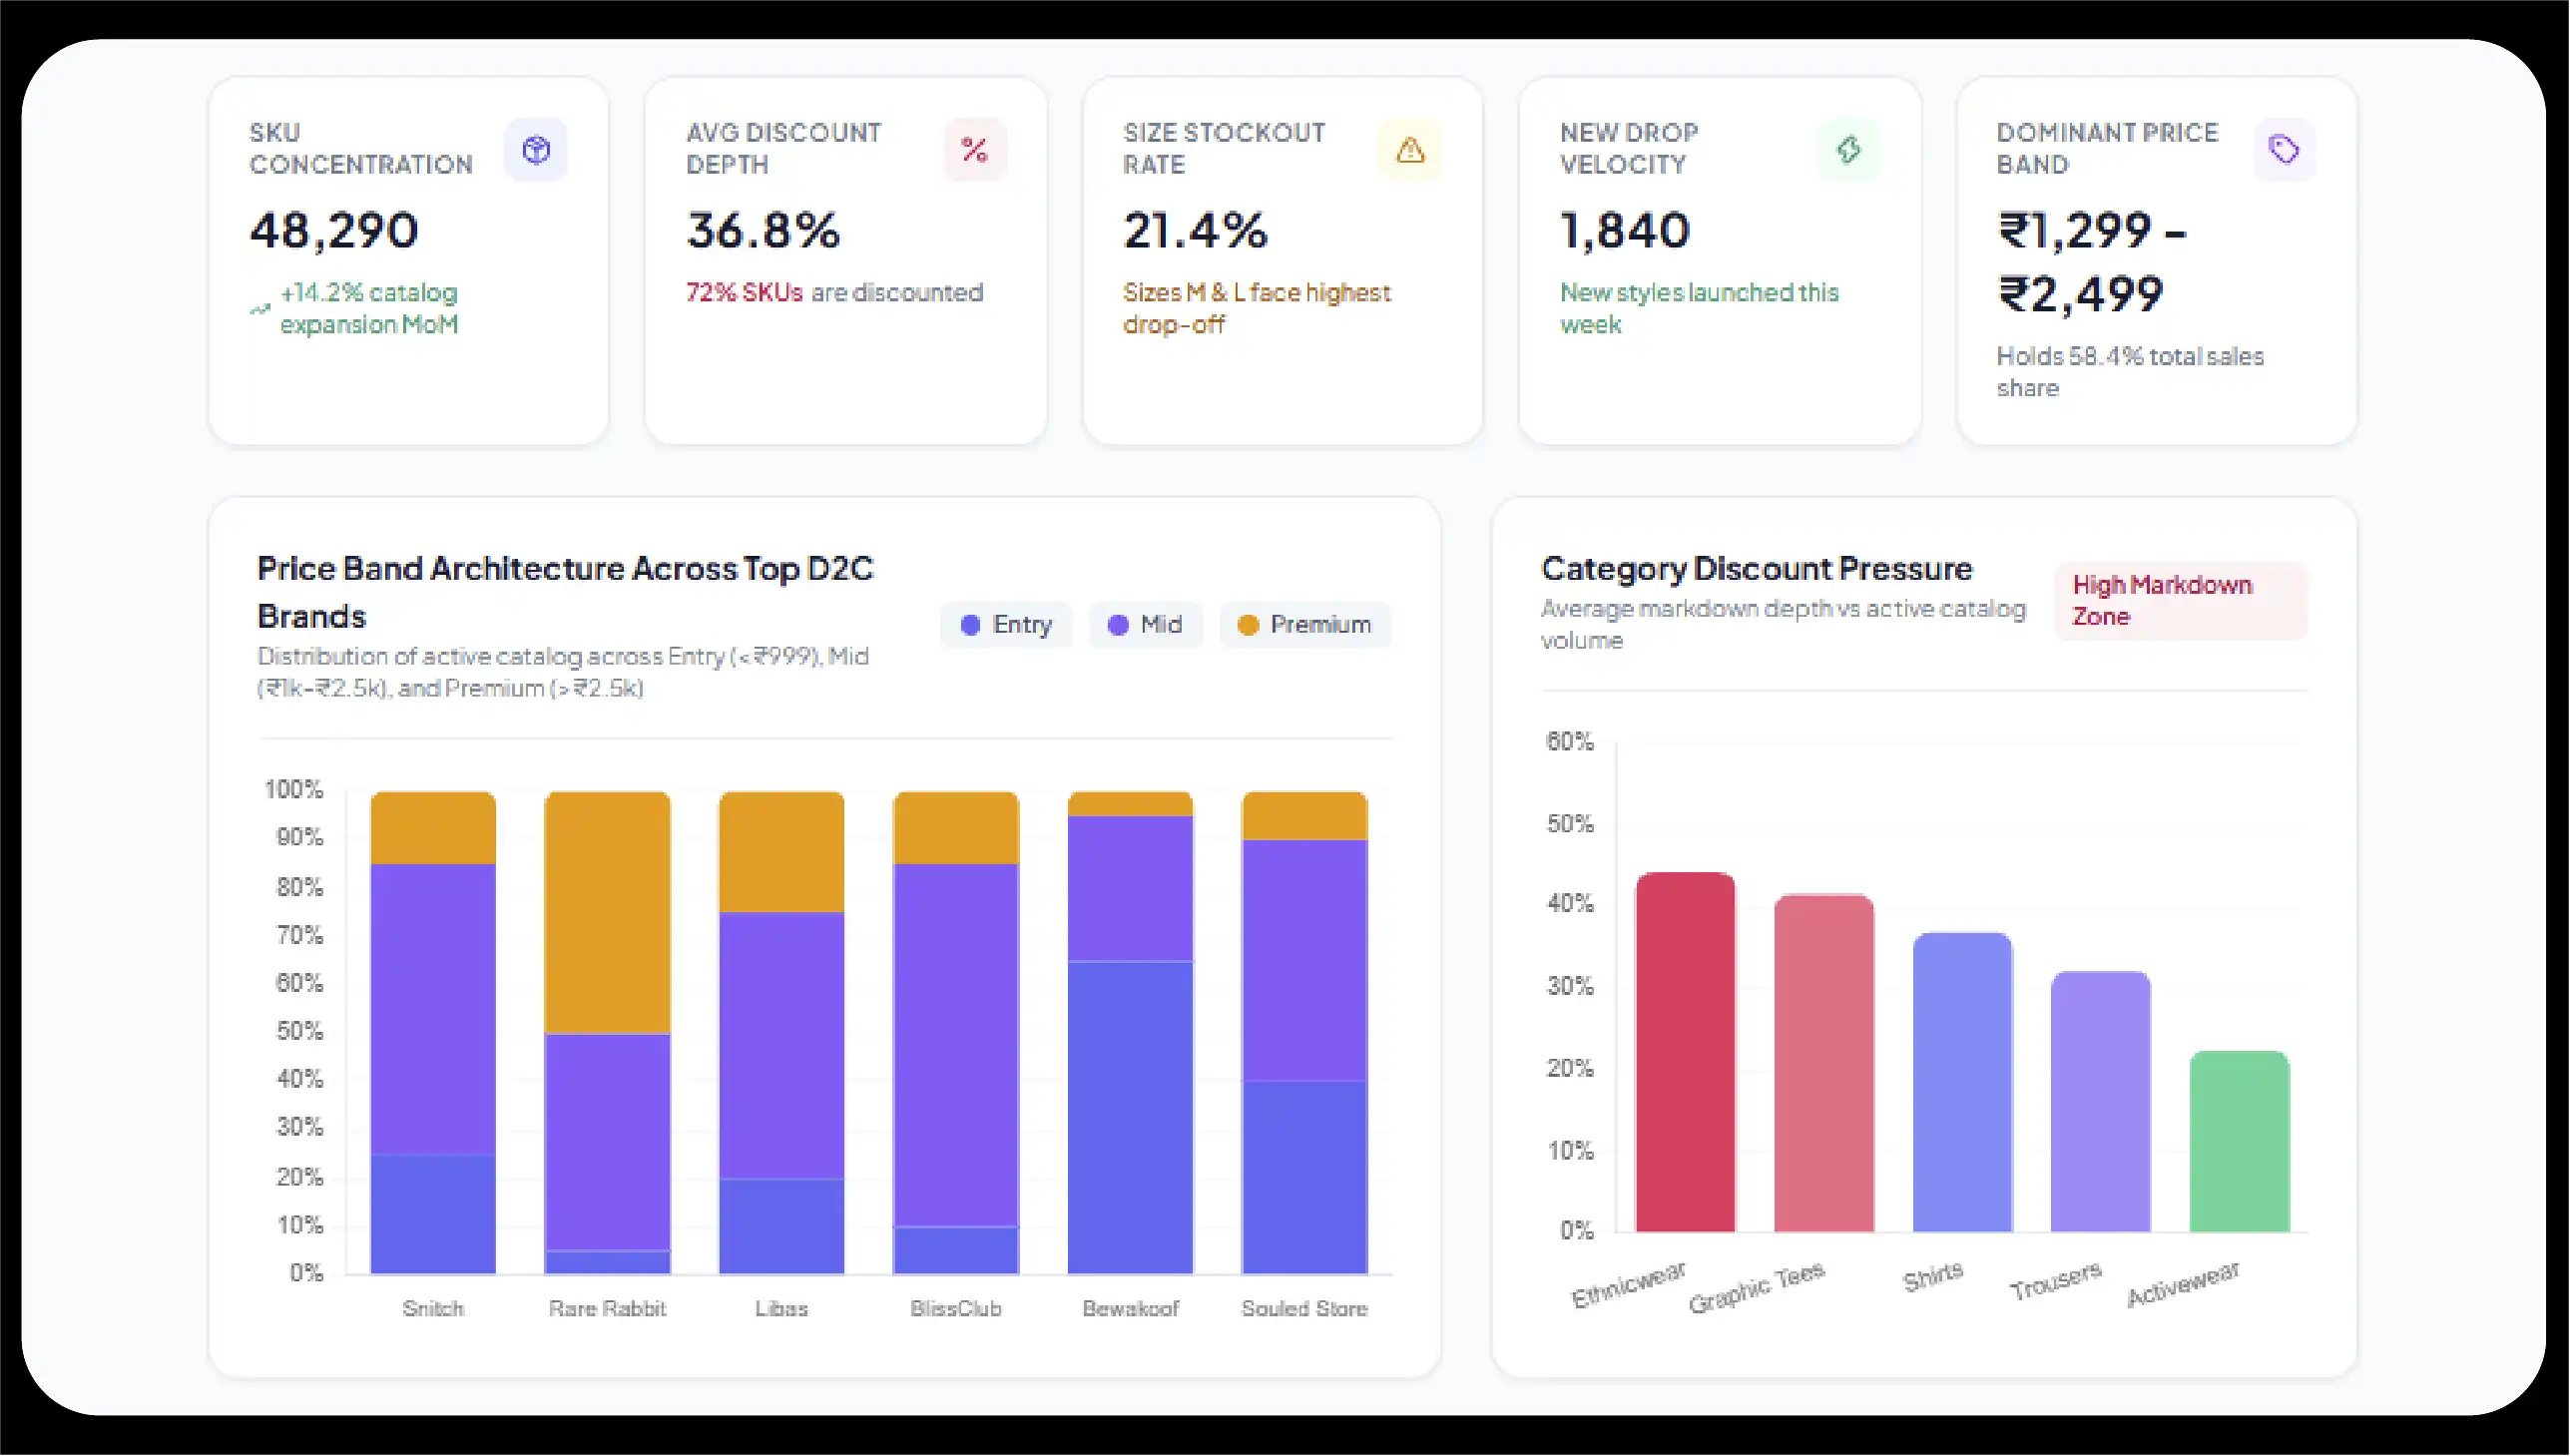
- Which categories have the highest SKU concentration?
- Which products are repeatedly discounted?
- Where are competitors positioned by price?
- How frequently are new products appearing?
- Which sizes and variants remain available?
- Which designs dominate category pages?
- How much of the assortment sits in entry, mid and premium price bands?
This is where fashion digital shelf analytics for Indian brands becomes
strategically valuable.
A continuously monitored dataset can capture product names, categories,
subcategories, brands, SKU identifiers, MRP, selling price, discount percentage, availability,
sizes, colours, ratings and promotional messages. When collected over time, these fields
transform a static product catalogue into a competitive intelligence system.
Bewakoof: Value-Focused Scale and Everyday Fashion
Bewakoof represents one of India's most established homegrown D2C fashion models.
The company says it was founded in 2012 and highlights its in-house capabilities across design,
manufacturing, technology, data science and marketing. Its website also reports more than 10
crore products sold and more than 2 crore customers bought.
Its proposition combines accessible fashion with graphic designs, oversized
silhouettes, everyday basics and licensed collaborations.
From a data perspective, Bewakoof is particularly interesting because its assortment
allows analysts to study SKU-level apparel pricing intelligence across multiple product
families. T-shirts, shirts, jeans, joggers, hoodies and accessories can be compared
simultaneously.
Current marketplace observations illustrate this breadth. For example, products
listed on Myntra in September 2026 included Bewakoof T-shirts around ₹649–₹794, shirts around
₹999 and selected jeans above ₹1,200, demonstrating how the brand spans multiple price points
rather than occupying a single entry-level tier.
The key intelligence opportunity is therefore not simply identifying the cheapest
product. It is understanding how Bewakoof uses product architecture, promotions and assortment
depth to create perceived value.
Newme: Trend Velocity and Gen-Z-Oriented Fashion
Newme operates in a distinctly different competitive space. Its proposition is
strongly connected with fast-moving, trend-led fashion and younger consumers who frequently
discover products through digital channels.
For an intelligence analyst, Newme presents an especially valuable dataset because
trend-led fashion depends heavily on product velocity.
A conventional apparel analysis might ask how many dresses or tops are available. A
more sophisticated Newme analysis asks:
- How many new SKUs appear during a given period?
- Which silhouettes are growing fastest?
- How quickly do new styles move between full price and discount?
- Which colours and aesthetics recur across new launches?
- What price points dominate the new-arrival assortment?
- How does availability change by size?
These metrics can reveal consumer demand signals before they become obvious in
traditional market reports.
Newme data extraction is therefore particularly useful for fashion retailers
monitoring emerging trends. Instead of treating the catalogue as a fixed inventory list,
analysts can build a time series showing new arrivals, price movements, product disappearance
and assortment turnover.
The Souled Store: Pop Culture as a Competitive Advantage
The Souled Store follows another distinctive strategy: combining fashion with fandom
and licensed intellectual property.
The brand describes itself as a homegrown Indian company offering products ranging
from T-shirts and hoodies to backpacks, socks, accessories and other merchandise. Its catalogue
includes officially licensed entertainment and sports properties as well as original designs.
Its current digital presence also spans categories such as T-shirts, joggers,
sneakers and accessories, while the company reports more than 6 million customers.
This makes The Souled Store especially valuable for studying the relationship
between design differentiation and pricing.
Unlike a generic T-shirt, a licensed Marvel, Naruto, Star Wars or Harry Potter
product can carry additional perceived value because consumers are purchasing identity and
fandom alongside apparel.
The brand also operates physical stores and provides app-based shopping benefits,
making its digital shelf increasingly connected to an omnichannel customer journey.
Comparative Product and Pricing Intelligence
The following tables provide an illustrative analytical framework for a 2026
competitive dataset. The figures are structured benchmark values rather than claims that every
SKU currently carries these exact prices. Actual monitoring should capture live SKU-level values
because prices, promotions and availability change continuously.
Indicative D2C Fashion Competitive Dataset
| Indicative SKU observations |
5,000 |
6,500 |
4,500 |
| Core price band (₹) |
299–1,999 |
399–2,499 |
599–2,999 |
| Indicative median price (₹) |
799 |
999 |
1,099 |
| T-shirt entry price (₹) |
299 |
499 |
599 |
| Typical T-shirt price (₹) |
649 |
799 |
899 |
| Hoodie entry price (₹) |
899 |
999 |
1,299 |
| Typical hoodie price (₹) |
1,299 |
1,499 |
1,699 |
| Jeans/trousers range (₹) |
999–2,199 |
999–2,499 |
1,299–2,799 |
| Indicative average discount |
32% |
28% |
25% |
| Estimated promotional SKU share |
61% |
55% |
48% |
| Core customer proposition |
Value + graphics |
Trend + speed |
Fandom + design |
| Major competitive lever |
Affordability |
Newness |
IP/design |
| Digital-first intensity |
High |
Very high |
High |
| Apparel breadth |
High |
Very high |
High |
| Accessories presence |
High |
Medium |
Very high |
The comparison highlights three different pricing philosophies. Bewakoof has a
strong value orientation, Newme can compete through trend frequency and relatively accessible
pricing, while The Souled Store can justify higher prices through licensed content, design and
fandom.
Category-Level Competitive Benchmarking
The next analytical layer is to compare category economics rather than simply
comparing brands.
Indicative Category Intelligence
| T-Shirts |
699 |
799 |
899 |
299 |
1,499 |
10 |
| Oversized T-Shirts |
749 |
849 |
999 |
399 |
1,699 |
9 |
| Shirts |
999 |
1,099 |
1,199 |
499 |
2,499 |
8 |
| Jeans |
1,299 |
1,399 |
1,599 |
899 |
2,799 |
9 |
| Joggers |
999 |
1,099 |
1,299 |
699 |
2,199 |
8 |
| Hoodies |
1,299 |
1,499 |
1,699 |
899 |
2,999 |
9 |
| Dresses |
1,099 |
1,199 |
1,399 |
599 |
2,499 |
9 |
| Tops |
699 |
799 |
899 |
399 |
1,799 |
10 |
| Accessories |
499 |
599 |
699 |
199 |
1,999 |
8 |
| Sneakers/Footwear |
1,499 |
1,799 |
1,999 |
999 |
3,999 |
7 |
| Average category price |
969 |
1,103 |
1,258 |
499 |
2,479 |
8.7 |
This type of table enables brands to identify D2C fashion competitor benchmarking
opportunities at category level.
For example, if a competitor consistently maintains lower prices in oversized
T-shirts while maintaining a larger assortment, another retailer could investigate whether its
own cost structure, promotion strategy or SKU architecture is creating a disadvantage.
What Product-Level Scraping Reveals
A sophisticated fashion dataset should move beyond product names and prices.
A useful record can contain:
- Brand → Product → SKU → Category → Subcategory → Gender → Colour → Size → MRP →
Selling Price → Discount → Stock → Rating → Review Count → URL → Timestamp
This structure enables several forms of analysis.
Price intelligence
Tracking prices daily can reveal whether discounts are permanent, seasonal or
event-driven. A product with ₹1,499 MRP and a ₹799 selling price communicates a different
commercial strategy from a product consistently sold at ₹799 without heavy discounting.
Assortment intelligence
SKU counts reveal where brands are investing. If one brand has 2,000 T-shirt
variants while another has 700, the difference may indicate different merchandising strategies.
Promotion intelligence
Monitoring discount percentages over time can identify promotional intensity. Brands
can determine whether competitors rely on 10–20% discounts, aggressive 40–60% campaigns or
bundle-led promotions.
Availability intelligence
Stock status is another important signal. Rapidly disappearing sizes may indicate
demand concentration, while repeatedly unavailable products may point toward supply constraints.
Why Automated Monitoring Matters?
Manual competitor research becomes inefficient when hundreds or thousands of SKUs
are involved.
Automated extraction allows companies to collect information at regular intervals
and create historical datasets. This is particularly valuable in fashion because products and
prices can change rapidly.
For businesses looking specifically at Newme, Newme data extraction services can support
structured monitoring of product discovery, pricing, category movement and assortment changes.
Similarly, organisations can Extract NewMe
Datasets to create historical product intelligence for trend research, competitor
monitoring and assortment planning.
A broader Fashion Product
Data Scraping Service can combine multiple D2C fashion websites and marketplaces into a
standardized database, allowing analysts to compare products even when different websites use
different naming conventions and category structures.
Strategic Opportunities for Indian Fashion Brands
The analysis points toward five major opportunities.
1. Build a dynamic price map.
Brands can map competitors across ₹399, ₹599, ₹799, ₹999, ₹1,299 and ₹1,499+ price
bands to identify overcrowded and under-served segments.
2. Monitor new-SKU velocity.
Newme-style trend velocity demonstrates why the number of new products launched each
week can be as important as total assortment size.
3. Identify discount dependency.
A retailer can compare full-price versus promotional sales positioning to determine
whether competitors are creating genuine price value or simply anchoring products against high
MRPs.
4. Measure design differentiation.
The Souled Store demonstrates how licensing and fandom can create differentiation
beyond fabric and silhouette.
5. Benchmark customer-facing digital shelves.
Search ranking, category placement, badges, offers, ratings and availability can all
influence conversion. Consequently, competitive intelligence should examine the complete digital
shelf rather than price alone.
Conclusion
The Indian D2C fashion market in 2026 is increasingly defined by data visibility,
assortment speed and pricing precision. Bewakoof, Newme and The Souled Store demonstrate three
distinct routes to competitiveness: accessible everyday fashion, rapid trend-led assortment and
differentiated fandom-driven merchandise.
A robust intelligence program can continuously track SKUs, prices, discounts,
availability, product launches and category movement. This creates a historical dataset that
allows fashion companies to distinguish temporary promotional changes from structural
competitive shifts.
The next stage of this intelligence ecosystem is Mobile app scraping, which can
extend monitoring beyond conventional websites into app-exclusive products, pricing, offers and
merchandising experiences.
A scraping API can then deliver structured
product information into dashboards, data warehouses and pricing systems, allowing businesses to
integrate competitive intelligence into existing workflows.
Finally, Managed web scraping can provide continuous collection, normalization,
monitoring and maintenance as fashion websites change their structures. Together, these
capabilities can transform raw product listings into a continuously updated competitive
intelligence layer for Indian D2C fashion.
Experience top-notch web scraping service
and mobile app scraping solutions with iWeb Data
Scraping. Our skilled team excels in extracting various data sets, including retail store locations and beyond. Connect with us
today to learn how our customized services can address your unique project needs, delivering the
highest efficiency and dependability for all your data requirements.