Introduction
Monitoring Seller Performance Across Marketplaces has become a strategic requirement
for brands, retailers, distributors, and marketplace operators competing in increasingly
fragmented e-commerce environments. Sellers may offer identical or closely related products
across Amazon, Walmart, eBay, Etsy, regional marketplaces, and specialist platforms, yet their
ratings, prices, assortment, stock positions, and customer feedback can vary significantly
between channels. Continuous monitoring transforms these scattered marketplace signals into
actionable commercial intelligence.
Marketplace seller performance data scraping enables businesses to systematically
collect seller-level information, including ratings, review counts, product listings, pricing,
availability, fulfillment indicators, promotional activity, assortment changes, and customer
feedback. Instead of manually checking hundreds or thousands of seller pages, automated
pipelines can capture structured information at predefined intervals and prepare it for
analysis.
Seller performance monitoring across multiple marketplaces also helps organizations
identify sellers gaining visibility, losing customer trust, changing prices aggressively,
expanding assortments, or improving their marketplace positioning. When these signals are
analyzed together, businesses can understand not only what competitors are selling but also how
effectively they are operating across different digital channels.
The objective is not simply to collect marketplace data. The real value comes from
converting seller activity into measurable indicators that support competitive benchmarking,
pricing decisions, assortment planning, vendor management, and marketplace strategy.
Why Seller Performance Monitoring Matters?
Marketplace competition operates at several levels simultaneously. A seller can
outperform a competitor through lower prices, broader assortment, stronger ratings, faster
fulfillment, better product availability, or more aggressive promotions. Monitoring only one
metric can therefore produce an incomplete picture.
A seller with 4.8 stars and 20,000 reviews may appear stronger than one with 4.6
stars and 100,000 reviews, but the larger review base may provide greater evidence of sustained
customer satisfaction. Similarly, a seller with the lowest listed price may not be the most
competitive when shipping charges, stock availability, bundle configuration, and seller
reputation are considered.
Cross-marketplace seller analytics brings these dimensions together. Organizations
can create seller scorecards that compare price competitiveness, rating quality, assortment
depth, listing activity, availability, review velocity, and marketplace visibility.
Historical data is particularly important. A single snapshot shows the current
situation, whereas a time series can reveal whether a seller is improving or deteriorating. A
rising review count combined with improving ratings may indicate stronger customer adoption. A
declining assortment with increasing prices could indicate supply constraints or a deliberate
premium strategy.
Core Data Points to Capture
A robust seller monitoring system should collect standardized fields across every
marketplace being analyzed. Depending on the marketplace, the available fields can include
seller name, seller ID, product title, SKU, product URL, category, brand, listed price,
discounted price, shipping cost, stock status, seller rating, review count, fulfillment method,
delivery estimate, badges, promotional offers, and seller location.
The same seller may also appear under slightly different names across marketplaces.
Entity matching and seller normalization are therefore essential. A unified seller identifier
can connect records belonging to the same commercial entity, allowing analysts to compare
performance across channels rather than treating each marketplace account as a separate
business.
Performance Metrics and Measurement Framework
Seller performance should be evaluated through a combination of absolute values and
derived indicators. Useful measures include average seller rating, rating change, review growth,
price index, assortment count, availability percentage, promotion frequency, product coverage,
and competitive ranking.
A seller price index can be calculated by comparing a seller's price with the median
price for the same product across competing sellers. For example, an index of 95 indicates that
the seller is priced approximately 5% below the benchmark, while 108 suggests a price
approximately 8% above it.
Review velocity is another valuable metric. If a seller receives 2,000 additional
reviews over a month while maintaining a high rating, it may indicate increasing sales momentum.
Conversely, a sharp increase in negative feedback can serve as an early warning signal for
fulfillment, product-quality, or customer-service problems.
Marketplace Seller Performance Snapshot
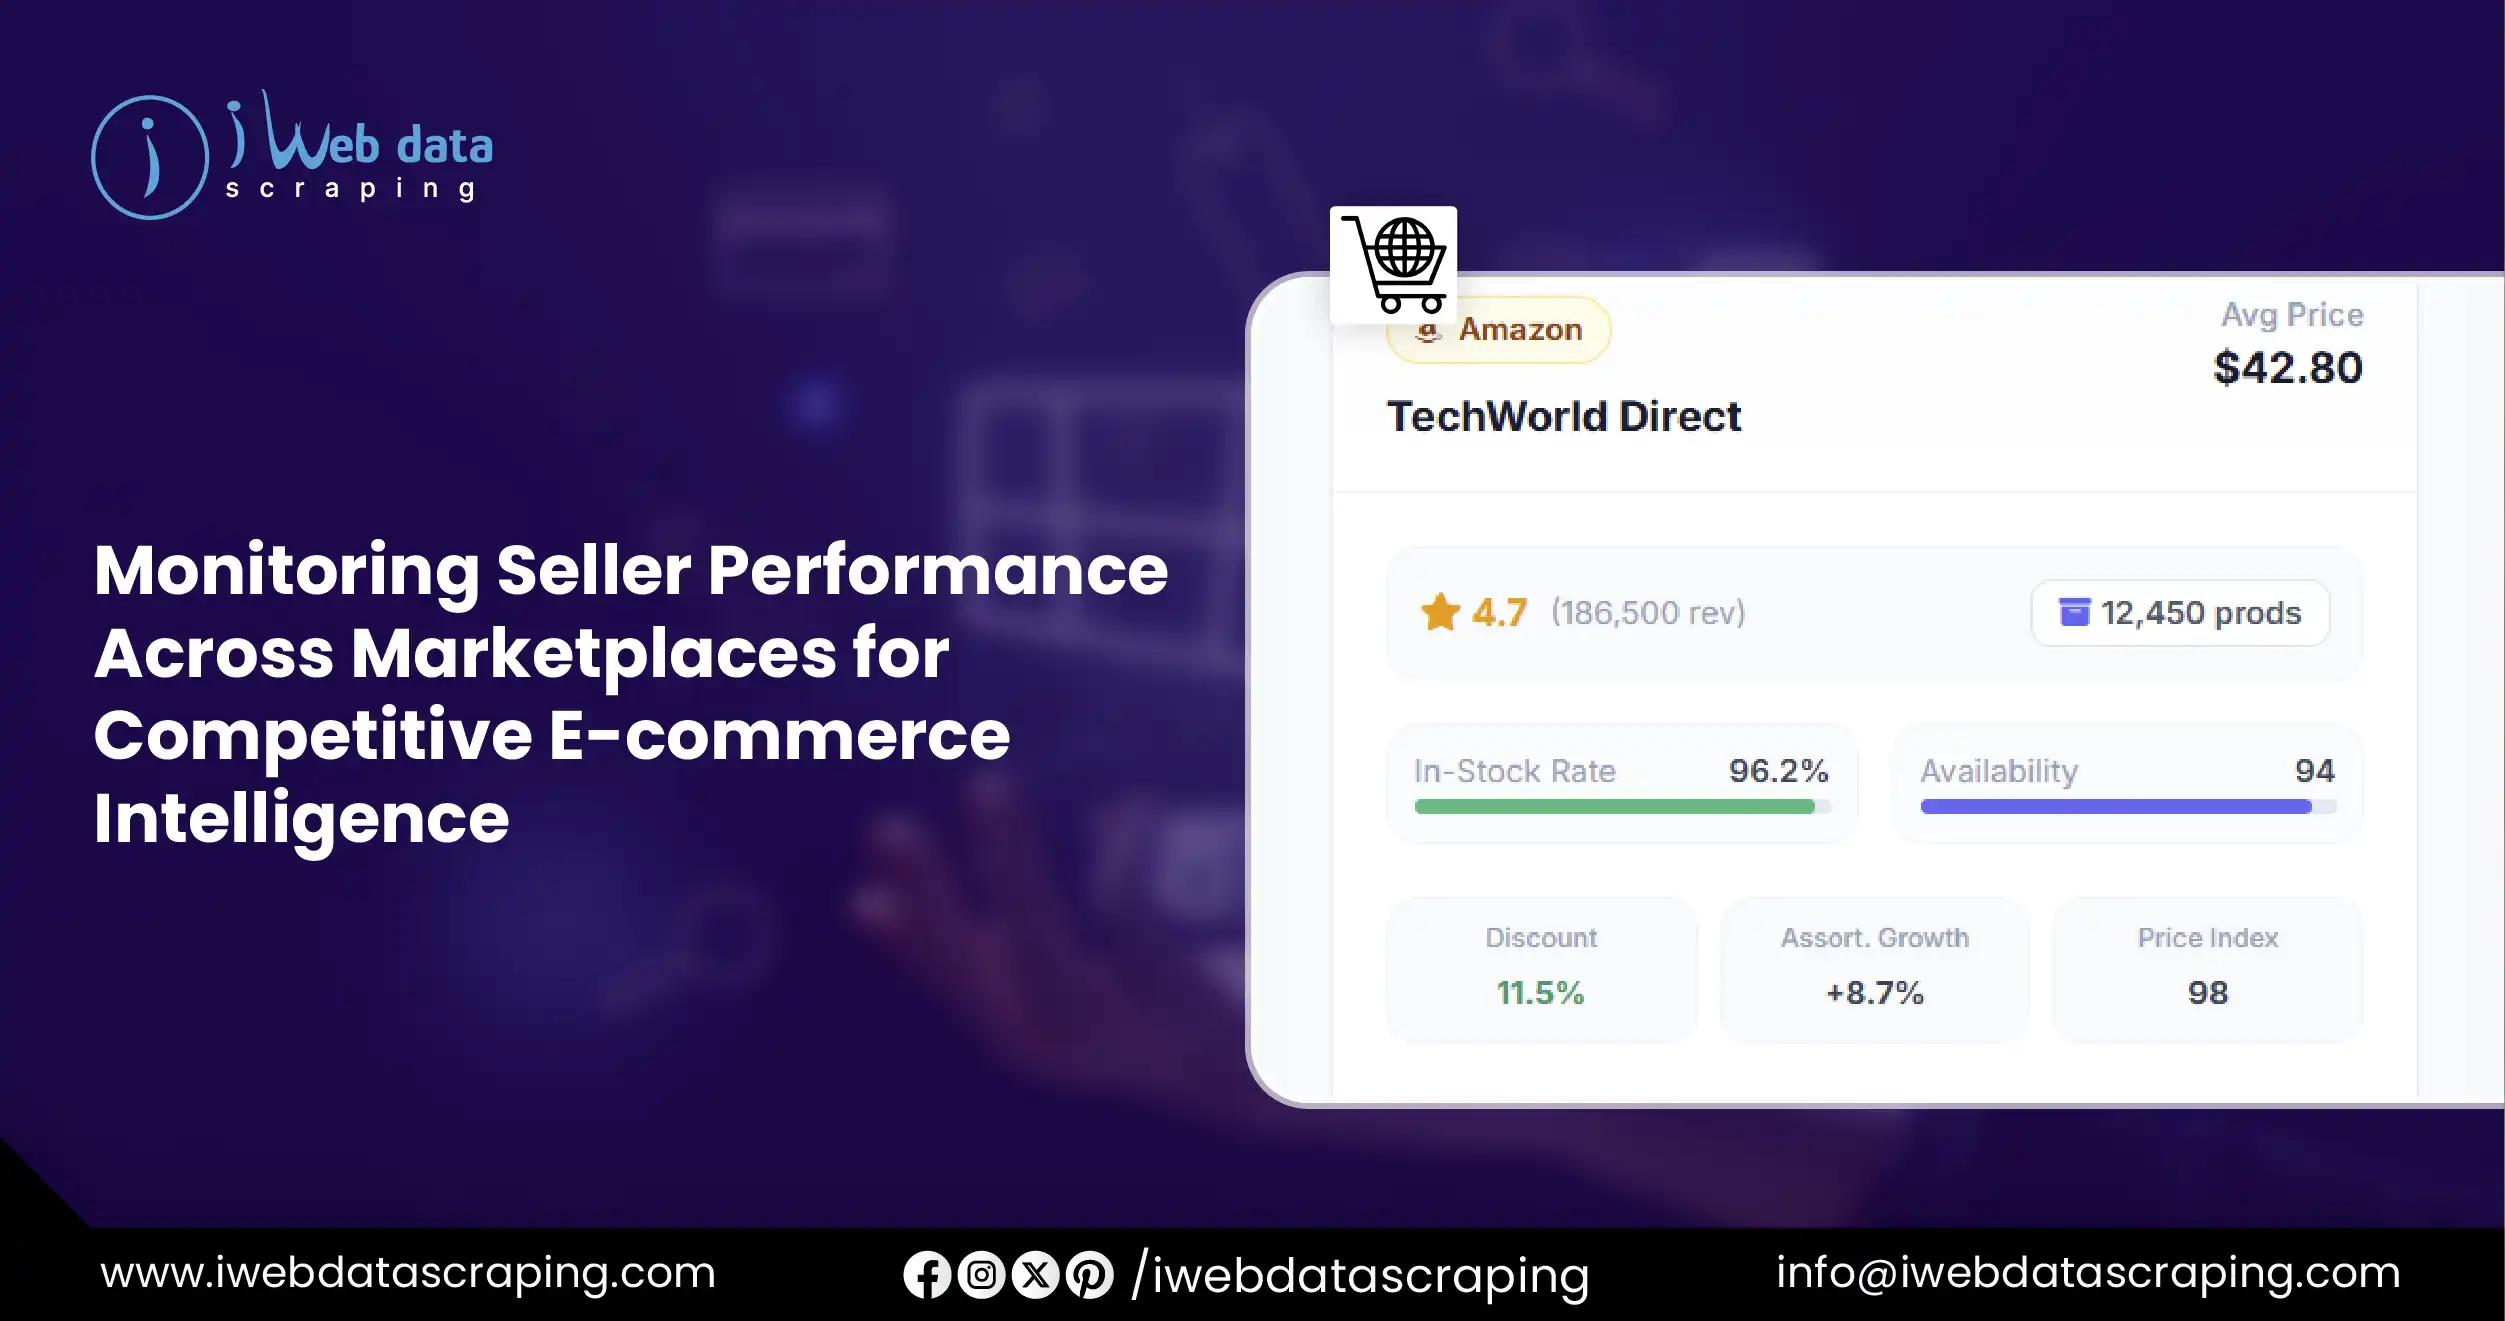
| TechWorld Direct |
Amazon |
12,450 |
4.7 |
186,500 |
42.80 |
11.5 |
96.2 |
8.7 |
98 |
14.2 |
94 |
| ValueMart Online |
Walmart |
9,860 |
4.5 |
121,300 |
40.90 |
14.8 |
92.7 |
12.4 |
94 |
18.6 |
90 |
| PrimeDeal Hub |
eBay |
7,420 |
4.6 |
88,750 |
39.70 |
9.2 |
89.4 |
5.9 |
91 |
10.8 |
87 |
| HomeStyle Studio |
Etsy |
5,180 |
4.8 |
74,600 |
47.30 |
6.5 |
97.8 |
15.1 |
109 |
21.7 |
96 |
| MegaChoice Store |
eBay |
15,240 |
4.4 |
210,800 |
41.60 |
17.3 |
86.5 |
19.6 |
97 |
16.4 |
82 |
| SmartBuy Retail |
Etsy |
8,930 |
4.7 |
132,900 |
43.10 |
10.7 |
94.1 |
10.3 |
101 |
13.9 |
92 |
| QuickValue Shop |
Target |
11,670 |
4.3 |
156,400 |
38.80 |
18.5 |
81.9 |
22.8 |
89 |
24.6 |
78 |
This type of dataset enables analysts to identify trade-offs. HomeStyle Studio, for
example, combines a high rating and availability score with a comparatively high price index,
suggesting a premium positioning strategy. QuickValue Shop has the lowest price index but weaker
rating and availability indicators, showing why price alone should not determine competitive
strength.
Tracking Product, Prices and Seller Data Across E-commerce Marketplace
Track Product,
Prices & Seller Data Across E-commerce Marketplace programs can connect product-level
intelligence with seller-level performance. This is particularly valuable when multiple sellers
compete for the same product listing.
Product matching establishes which seller records refer to identical or equivalent
products. Price monitoring then determines how each seller positions the item. Seller ratings
and review volumes provide a reputation layer, while availability data indicates whether a
competitive price can actually translate into sales.
Assortment analysis adds another dimension. A seller carrying 15,000 products may
have a substantially different strategic position from one carrying 3,000 products, even if both
compete in the same category. Tracking new listings, discontinued products, category expansion,
and SKU churn helps identify where competitors are investing.
Example Cross-Marketplace Monitoring Dataset
| P1001 |
Electronics |
TechWorld Direct |
Amazon |
129.99 |
134.99 |
-3.70 |
4.7 |
18,420 |
Yes |
2 |
3 |
8 |
126 |
2026-08-27 |
| P1001 |
Electronics |
ValueMart Online |
Walmart |
127.50 |
131.00 |
-2.67 |
4.5 |
12,850 |
Yes |
3 |
5 |
10 |
94 |
2026-08-27 |
| P1001 |
Electronics |
PrimeDeal Hub |
eBay |
124.99 |
129.99 |
-3.85 |
4.6 |
9,760 |
Yes |
4 |
7 |
12 |
71 |
2026-08-27 |
| P1002 |
Home |
HomeStyle Studio |
Etsy |
54.99 |
59.99 |
-8.33 |
4.8 |
7,420 |
Yes |
2 |
2 |
14 |
88 |
2026-08-27 |
| P1002 |
Home |
MegaChoice Store |
Marketplace X |
52.49 |
55.99 |
-6.25 |
4.4 |
5,680 |
No |
5 |
9 |
16 |
113 |
2026-08-27 |
| P1003 |
Beauty |
SmartBuy Retail |
Marketplace Y |
31.90 |
34.90 |
-8.60 |
4.7 |
6,230 |
Yes |
1 |
4 |
18 |
67 |
2026-08-27 |
| P1003 |
Beauty |
QuickValue Shop |
Marketplace Z |
29.99 |
32.99 |
-9.09 |
4.3 |
8,910 |
Yes |
3 |
6 |
20 |
142 |
2026-08-27 |
| P1004 |
Grocery |
TechWorld Direct |
Amazon |
18.75 |
19.99 |
-6.20 |
4.7 |
3,840 |
Yes |
1 |
2 |
9 |
55 |
2026-08-27 |
| P1004 |
Grocery |
MegaChoice Store |
Marketplace X |
17.90 |
20.50 |
-12.68 |
4.2 |
2,710 |
Yes |
2 |
11 |
21 |
176 |
2026-08-27 |
A dataset structured this way supports product-by-product competitive comparisons
while preserving the seller and marketplace dimensions required for deeper analysis. It can also
be refreshed daily, hourly, or according to business requirements.
Marketplace Seller Competitor Analysis
Marketplace seller competitor analysis becomes more powerful when historical
observations are stored rather than overwritten. Businesses can calculate weekly and monthly
trends for price changes, ratings, review growth, product launches, stock availability, and
promotional intensity.
Competitor analysis can reveal several strategic patterns. A seller repeatedly
lowering prices before weekends may be following a demand-based pricing strategy. Another seller
may maintain premium prices while investing heavily in reviews and assortment. A third may
rapidly expand its catalog but experience declining availability.
These patterns allow businesses to move from descriptive reporting to predictive
intelligence. Instead of simply stating that a competitor reduced prices, analysts can examine
how frequently that seller changes prices, which categories are affected, how competitors
respond, and whether those changes correlate with review growth or availability.
Building an Automated Monitoring Architecture
A scalable monitoring framework normally begins with marketplace discovery and data
collection. Automated crawlers or compliant marketplace APIs gather relevant seller and product
records. Extraction processes then normalize prices, ratings, dates, product identifiers, and
seller names into consistent structures.
A validation layer checks duplicate records, missing fields, malformed values,
unexpected price changes, and inconsistent seller identifiers. Data can then be stored in
relational databases, cloud storage, warehouses, or analytical formats such as Parquet.
Analytics layers calculate seller scores, price indices, assortment changes, review
velocity, and competitive rankings. Dashboards can expose these metrics through marketplace,
seller, category, brand, product, and date filters.
Alert systems add operational value. Businesses can receive notifications when a
major competitor drops a price by more than 10%, when a key seller goes out of stock, when
ratings fall sharply, or when a competitor introduces a large number of new products.
Challenges in Large-Scale Monitoring
Large marketplace environments create several technical and analytical challenges.
Product pages may change structure, sellers may use inconsistent naming conventions, and
marketplace-specific fields may not map directly to one another.
Scale is another concern. Monitoring 100 sellers across 10,000 products creates one
million potential product-seller relationships before accounting for multiple marketplaces and
historical snapshots. Efficient scheduling, incremental extraction, caching, deduplication, and
distributed processing therefore become important.
Data quality also requires continuous monitoring. A temporary page failure should
not automatically be interpreted as a product being unavailable. Similarly, a missing seller
rating should not be converted into a zero score. Robust pipelines need validation rules and
confidence indicators to distinguish genuine marketplace changes from collection anomalies.
Compliance should also be considered throughout the project. Data collection should
respect applicable laws, marketplace terms, access controls, privacy requirements, and
responsible crawling practices.
Strategic Applications
Organizations can apply seller intelligence across several functions. Marketplace
managers can identify underperforming sellers and improve channel strategy. Pricing teams can
benchmark seller prices against market medians. Category managers can identify assortment gaps
and emerging competitors.
Brand protection teams can detect unauthorized sellers, unusual pricing, and
inconsistent product information. Procurement teams can monitor supplier behavior and
marketplace expansion. Marketing teams can correlate promotional activity with rating and review
trends.
For executives, a consolidated seller score provides a concise view of marketplace
health. Instead of navigating multiple platforms independently, leadership can compare seller
performance across channels using standardized metrics and historical trends.
Conclusion
Effective seller intelligence requires more than periodically checking marketplace
listings. Businesses need a continuous framework that connects seller identity, product
assortment, pricing, ratings, reviews, promotions, availability, and historical changes. With
standardized data and reliable analytics, marketplace activity becomes measurable and
comparable.
Web Scraping API Services can support scalable
data collection when organizations need structured marketplace information delivered directly
into analytical workflows, dashboards, or internal systems.
Managed web scraping can further reduce the operational burden of maintaining large
monitoring programs by supporting extraction workflows, data validation, scheduling, and ongoing
pipeline maintenance.
Real-time web scraping becomes particularly
valuable for high-frequency use cases such as price changes, stock movements, seller ranking
shifts, and promotional monitoring where delayed information can reduce the value of competitive
intelligence.
Ultimately, a well-designed monitoring program helps businesses understand not only
which sellers are winning, but why they are winning, where performance is changing, and how
competitors are positioning themselves across marketplaces. That intelligence can turn
fragmented marketplace activity into a reliable foundation for pricing, assortment, seller
management, and long-term e-commerce strategy.
Experience top-notch web scraping service
and mobile app scraping solutions with iWeb Data
Scraping. Our skilled team excels in extracting various data sets, including retail store locations and beyond. Connect with us
today to learn how our customized services can address your unique project needs, delivering the
highest efficiency and dependability for all your data requirements.