

Introduction
Salvador is becoming an increasingly important mobility market where tourism, commuting, airport transfers, business travel, and app-based transportation intersect. With ride-hailing platforms continuously adjusting fares, ETAs, vehicle availability, and service categories, businesses need fresh mobility intelligence rather than static market reports.
Scrape Brazil Ride-Hailing API 2026 data to help organizations monitor these constantly changing signals and convert them into structured datasets for pricing, mobility research, fleet planning, and competitive analysis. Likewise, businesses can Scrape Brazil ride-hailing API for real-time fare & ETA data to understand how ride costs and pickup expectations change across locations and time periods.
Salvador already has substantial app-based mobility activity. Uber provides ride services throughout the city, while 99 offers categories including 99Pop, 99Táxi, and 99Plus. Uber's own Salvador information also provides indicative route prices, while noting that actual prices vary according to factors such as location and traffic conditions.
This makes real-time data particularly valuable. A single fare snapshot can become outdated within minutes, whereas continuously collected observations can reveal pricing patterns across neighborhoods, hours, vehicle categories, and demand conditions.
Why Salvador Needs Real-Time Ride-Hailing Intelligence?
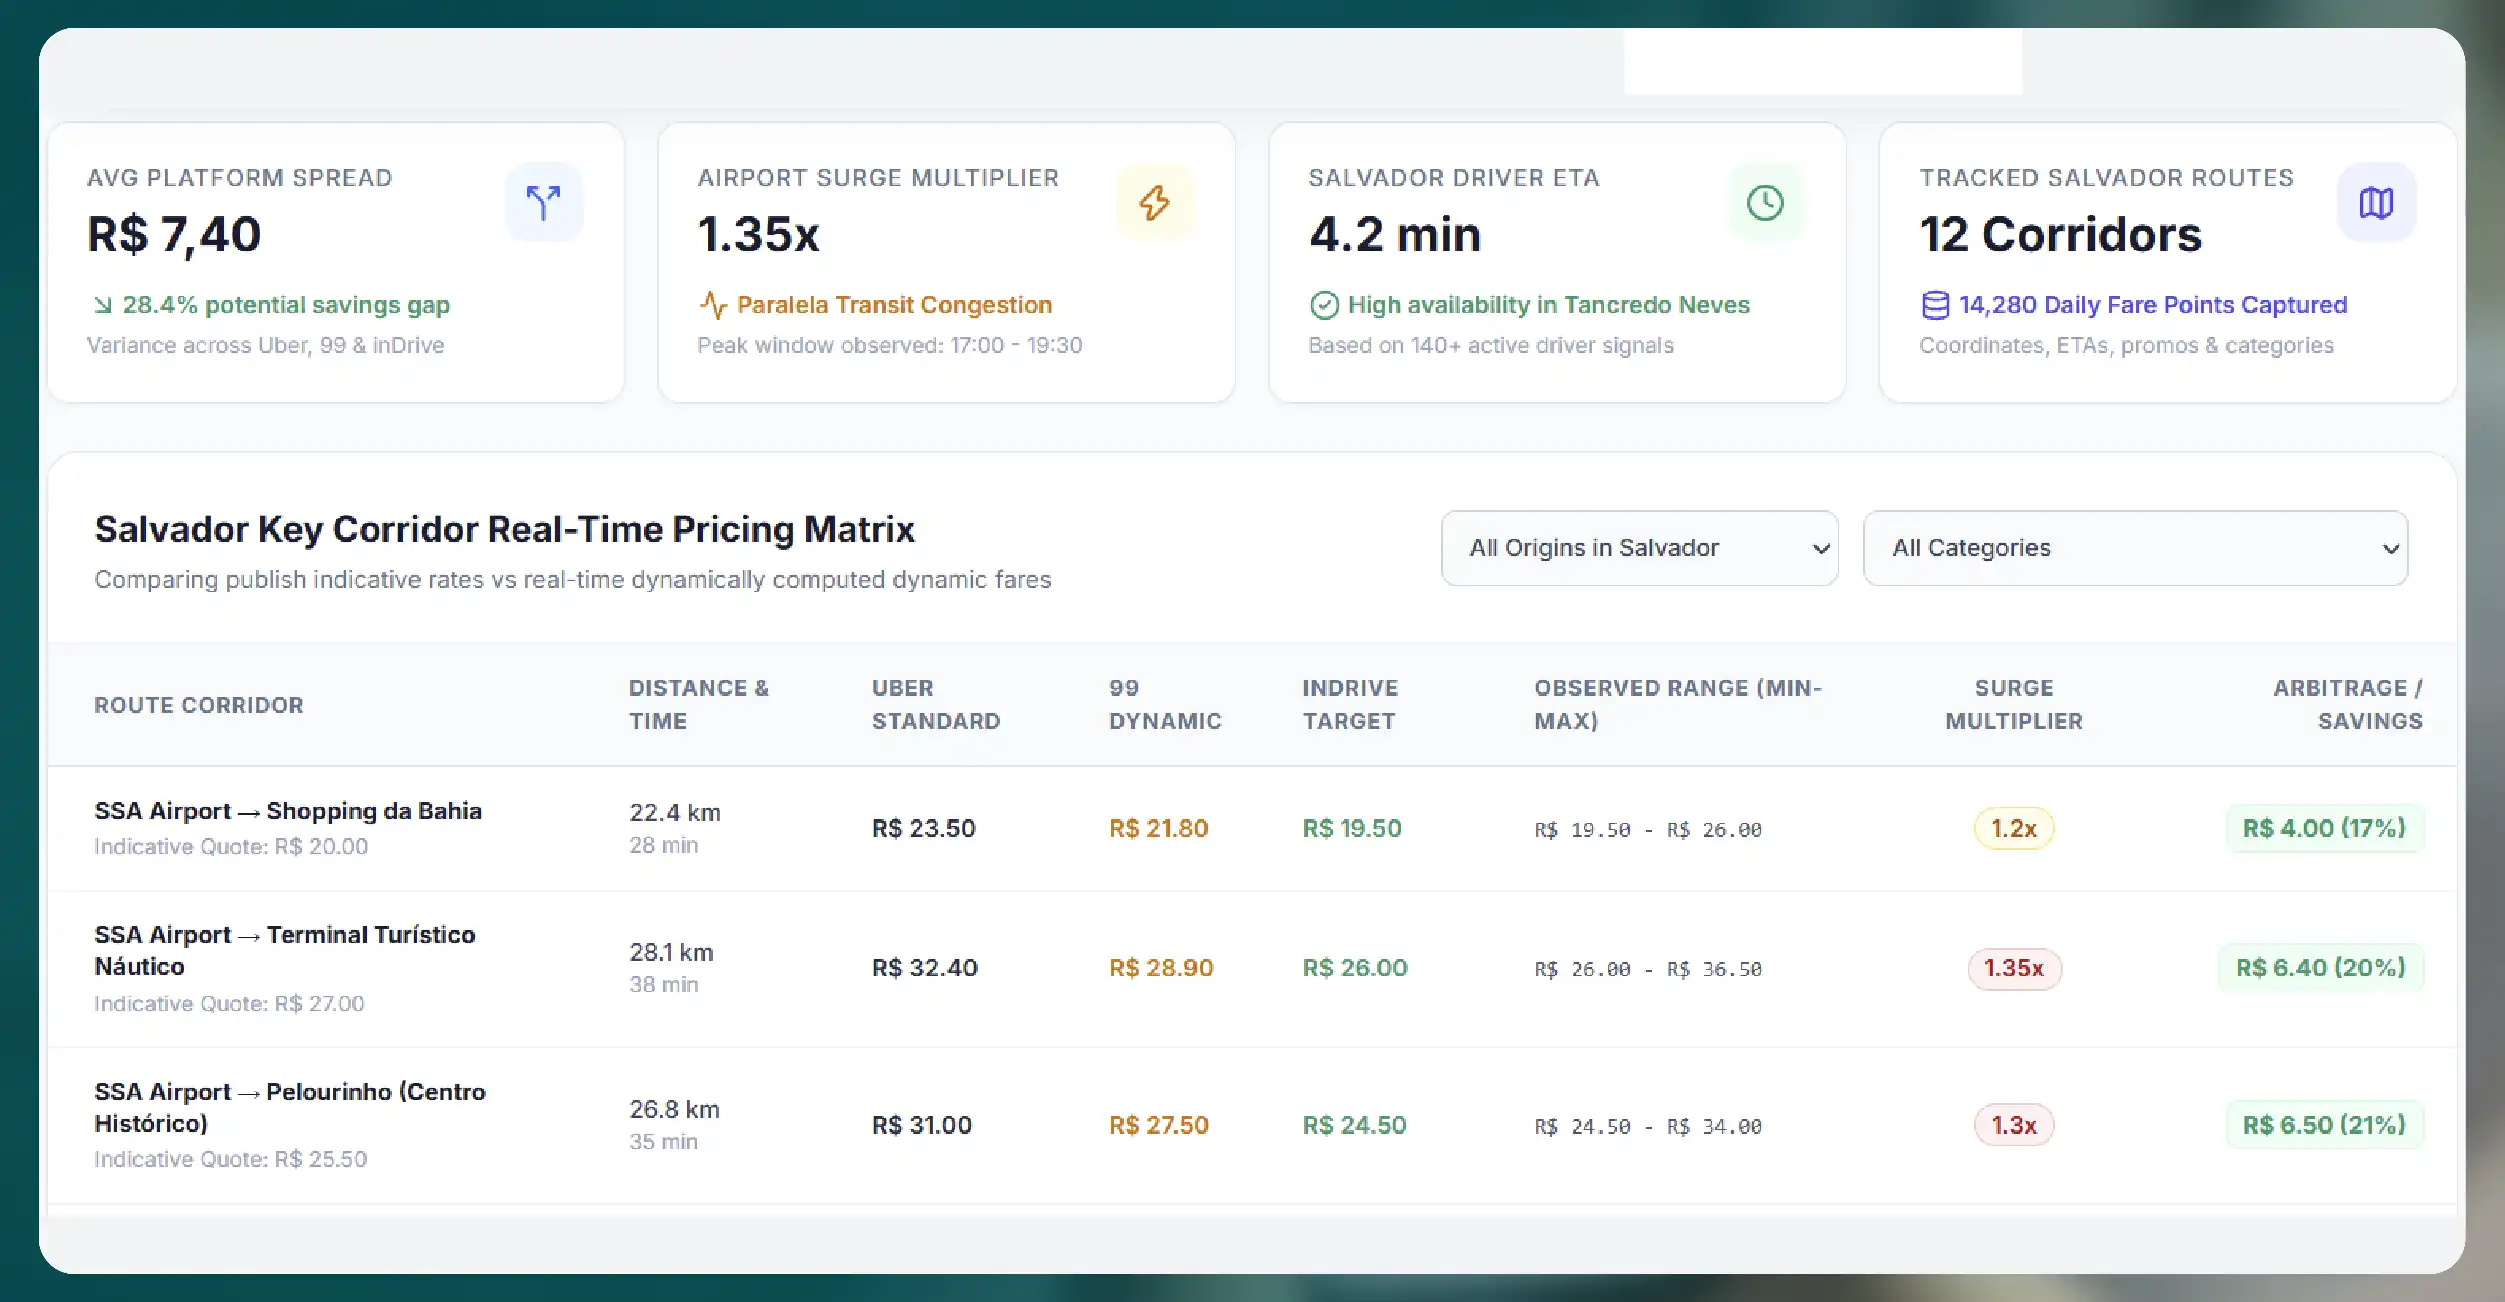
Ride-hailing pricing is not static. A trip between Salvador's airport and a central neighborhood can have a different price depending on time, demand, traffic, vehicle category, promotions, and driver availability.
For example, Uber currently publishes indicative Salvador route prices such as R$20 to Shopping da Bahia and R$27 to Terminal Turístico Náutico da Bahia, while emphasizing that actual fares can vary.
That variability creates a valuable opportunity for data-driven businesses.
A properly structured dataset can capture:
- Pickup and destination locations
- Estimated fare
- Minimum and maximum fare where available
- ETA
- Estimated trip duration
- Vehicle category
- Vehicle availability
- Distance
- Timestamp
- Surge or dynamic-pricing indicators
- Promotional pricing
- Service availability
- Route information
- Platform name
- Geographic coordinates
Businesses can then compare thousands of observations rather than relying on isolated manual checks.
What Data Can Be Extracted?
The biggest advantage of an automated ride-hailing data pipeline is breadth. Instead of recording only fare values, organizations can build a multidimensional mobility dataset.
Fare Data
Fare information is central to Extract Salvador ride-hailing fare &
vehicle data initiatives. Companies can monitor estimated trip prices across predefined routes and
locations.
For example, a business could repeatedly compare:
- Airport → Downtown
- Airport → Barra
- Pelourinho → Rio Vermelho
- Barra → Salvador Shopping
- Shopping da Bahia → Itapuã
Repeated collection makes it possible to calculate average prices, price volatility, peak-period premiums, and route-level differences.
ETA and Travel-Time Data
ETA provides another layer of intelligence. Two routes
with similar fares may offer dramatically different pickup times.
By collecting ETA at regular intervals, companies can identify:
- High-demand pickup zones
- Congestion-sensitive corridors
- Morning and evening peaks
- Airport demand patterns
- Weekend travel behavior
- Event-driven mobility changes
- Service availability gaps
This can support better transportation planning and customer experience strategies.
Vehicle and Service Data
Vehicle-category information helps analysts understand
how consumers choose between economical, premium, taxi, and other available services.
99 currently lists 99Pop, 99Táxi, and 99Plus among its Salvador categories.
A structured dataset can compare these categories with corresponding services where data is available, helping businesses study differences in fare, ETA, availability, and trip characteristics.
Dynamic Pricing: The Most Important Signal
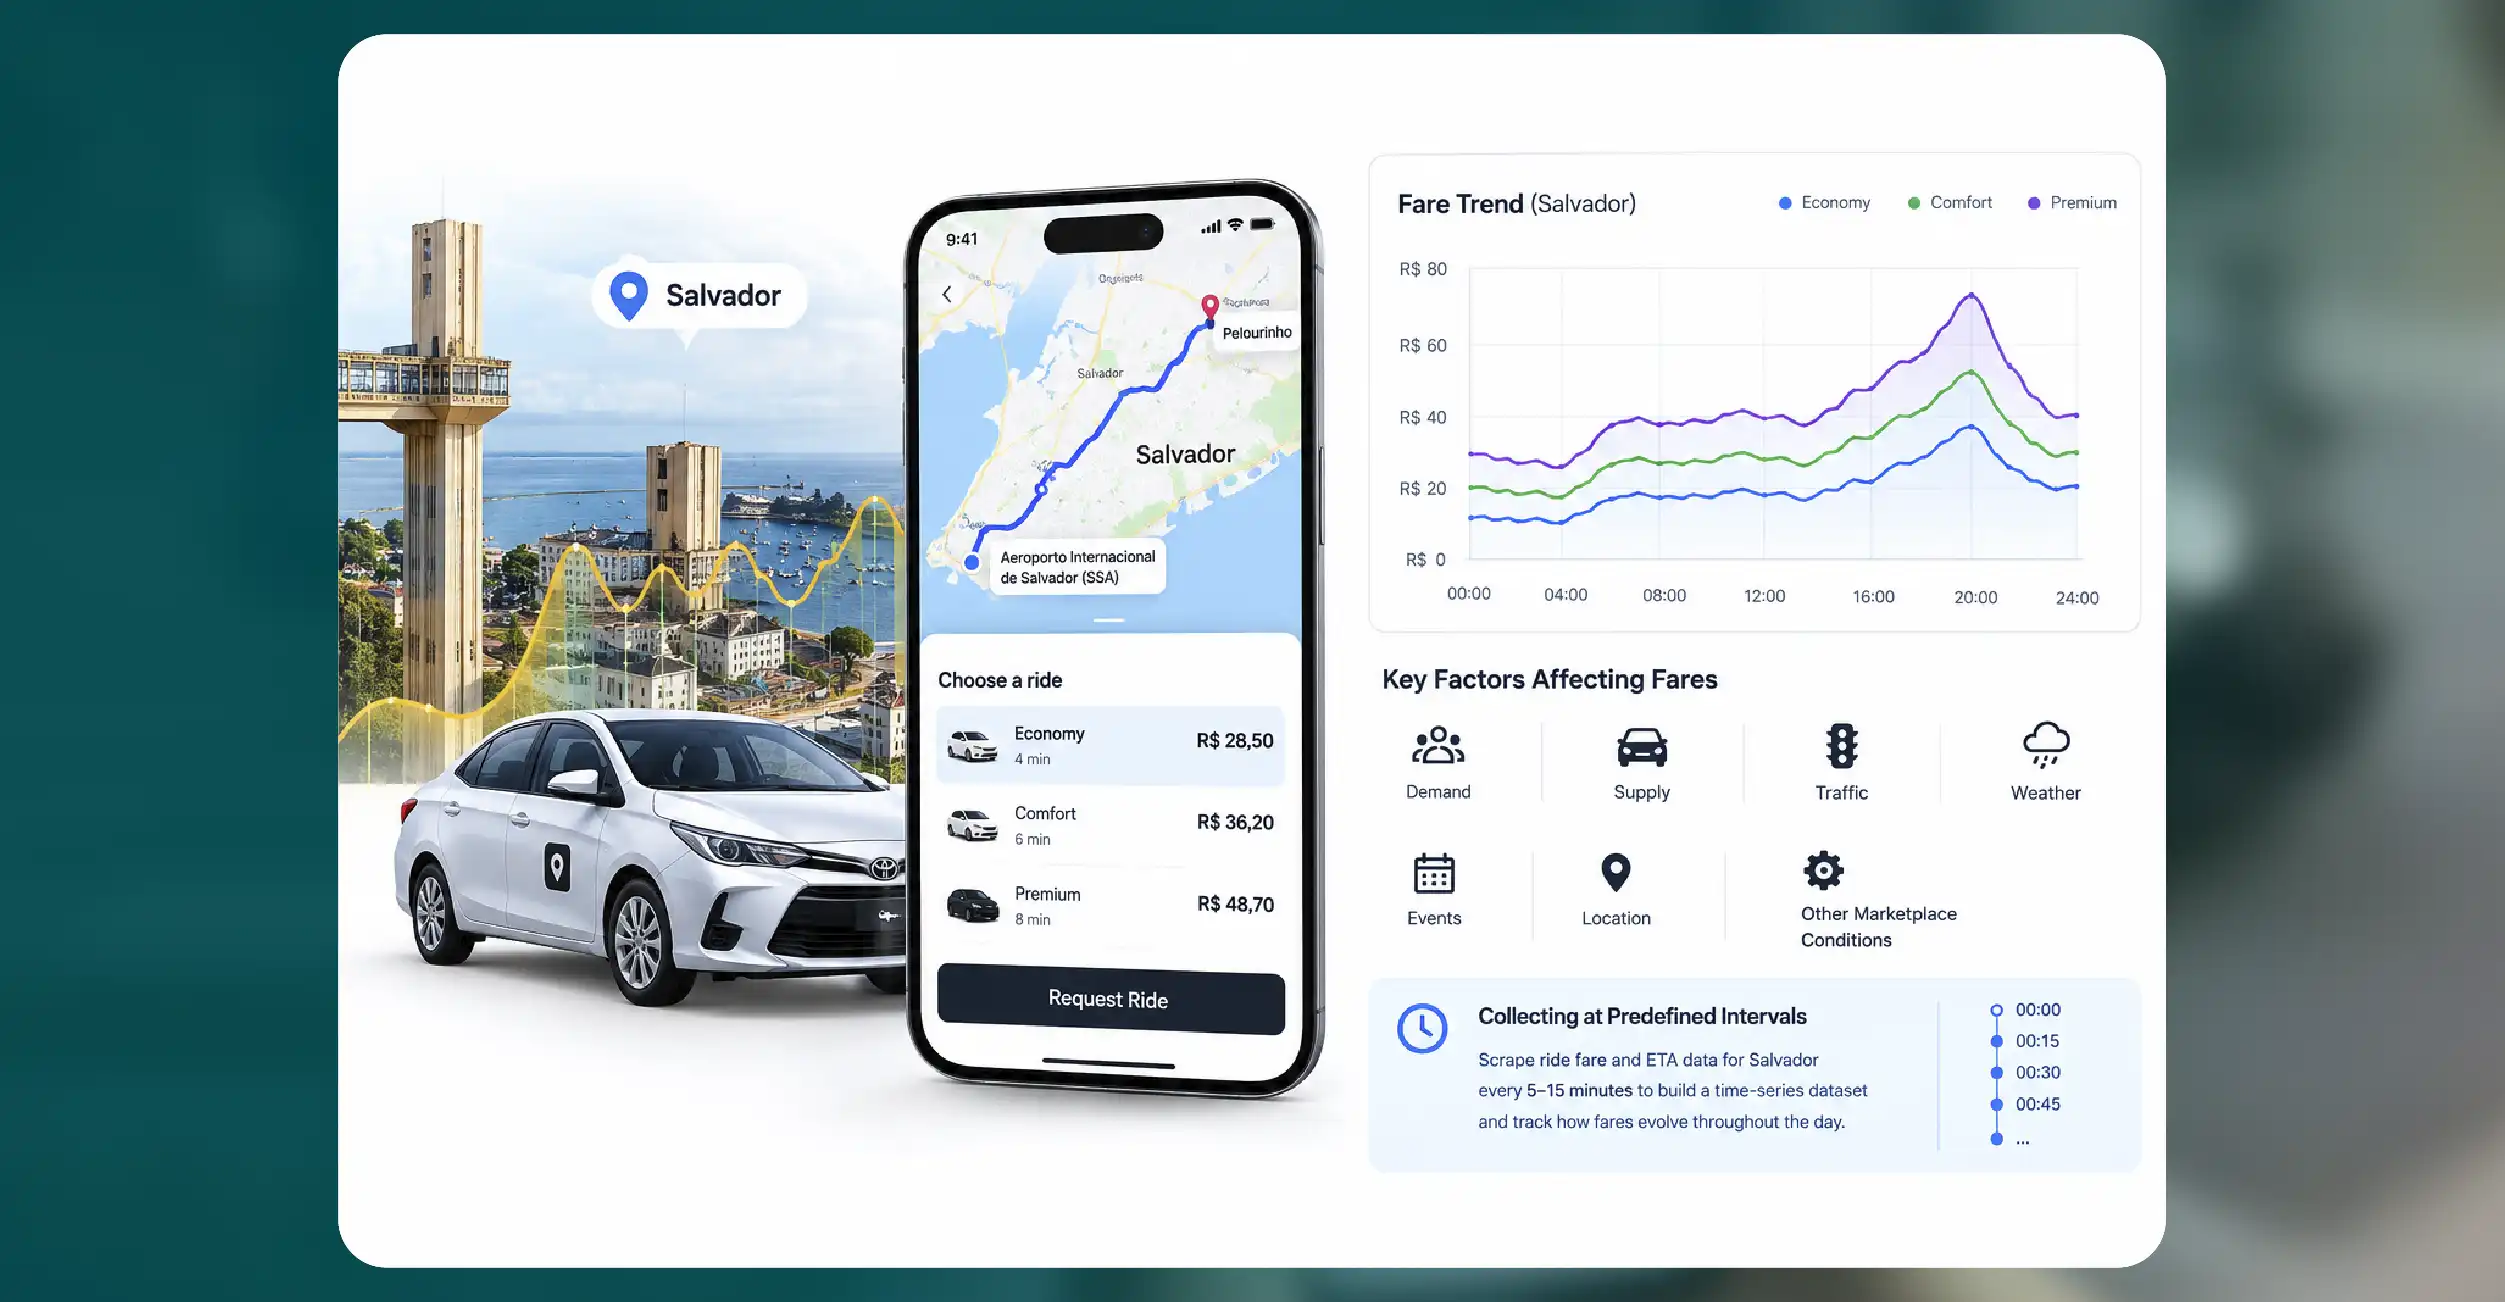
One of the strongest reasons to collect ride-hailing data continuously is dynamic pricing.
Prices can change because of demand, supply, traffic, weather, events, location, and other marketplace conditions. Consequently, collecting one price per route provides limited insight.
Instead, businesses can Scrape ride fare and ETA data for Salvador at predefined intervals.
For instance, collecting observations every 5–15 minutes could produce a time-series dataset showing how fares evolve throughout the day.
A simple analytical model could compare:
Fare Index = Observed Fare ÷ Baseline Route Fare
A value above 1 indicates that the current fare is higher than the selected baseline, while a value below 1 indicates a comparatively lower price.
This enables businesses to identify recurring pricing peaks and unusual fare movements.
Building Brazil Ride-Hailing Pricing Intelligence
Brazil ride-hailing pricing intelligence becomes significantly more useful when fare data is combined with location and time.
Instead of asking only, "What does a ride cost?", analysts can investigate:
- When do prices rise?
- Which neighborhoods experience higher fare volatility?
- Which routes have the highest average fare?
- How does ETA change alongside pricing?
- Which service categories remain available during high demand?
- How frequently do prices return to baseline?
- Which locations show recurring availability shortages?
This turns raw API or app-level observations into actionable commercial intelligence.
For mobility companies, this information can support pricing strategies. For travel companies, Mobile App Data Scraping Services can improve airport transfer recommendations. For mapping and navigation businesses, it can enhance transportation estimates.
Salvador Ride-Hailing Market Analytics
Salvador ride-hailing market analytics can also support broader urban mobility research.
Salvador combines residential districts, commercial areas, tourist attractions, beaches, airports, shopping destinations, and nightlife zones. Each creates different transportation demand patterns.
A geographic ride-hailing dataset can divide the city into analytical zones and compare:
| Metric | Example Analysis |
|---|---|
| Average Fare | Route-level price comparison |
| ETA | Pickup efficiency |
| Availability | Supply monitoring |
| Trip Duration | Traffic analysis |
| Vehicle Category | Consumer preference |
| Price Volatility | Dynamic-pricing intensity |
| Demand Period | Peak-hour identification |
This approach can reveal mobility patterns that traditional surveys may overlook.
The growing integration of mobility services also makes this analysis more interesting. In August 2026, 99 launched a pilot in Salvador allowing users to purchase metro tickets through its app, positioning the platform as a broader mobility ecosystem rather than simply a ride-hailing service.
How Businesses Can Track Dynamic Ride Prices?
Companies can Track Dynamic Ride-Hailing Prices by creating automated collection schedules around important routes and geographic zones.
A typical workflow can involve:
- Defining Salvador locations and routes.
- Capturing available ride categories.
- Recording fares and ETAs.
- Adding timestamps and coordinates.
- Standardizing vehicle and service names.
- Storing historical observations.
- Detecting significant price changes.
- Generating dashboards and alerts.
Over time, this creates a historical benchmark.
For example, a travel platform could discover that a particular airport route frequently becomes more expensive during specific periods. A corporate mobility provider could use similar intelligence to estimate transportation budgets more accurately.
Applications Across Multiple Industries
Ride-hailing intelligence is not limited to transportation companies.
Travel and Tourism
Hotels, travel agencies, airport-transfer providers, and
tourism applications can use fare and ETA information to estimate local transportation costs and
recommend convenient travel options.
Mobility Platforms
Mobility companies can compare service availability, pricing,
and pickup performance across geographic zones.
Automotive Companies
Automotive businesses can examine ride-hailing vehicle
categories and demand signals to understand where specific vehicle types may have commercial
opportunities.
Market Researchers
Research organizations can create longitudinal datasets to
study pricing behavior, mobility demand, and competitive positioning.
Location Intelligence Providers
Geospatial companies can combine ride-hailing
observations with POI, traffic, demographic, and geographic datasets to create richer mobility
models.
From Raw Data to a Decision-Ready Dataset
Automated extraction is only the beginning. Data quality determines whether the resulting intelligence is useful.
A professional pipeline should normalize currencies, timestamps, coordinates, route names, vehicle categories, and fare fields.
Duplicate records should be removed, missing values flagged, and unusual observations reviewed. Historical data should also retain timestamps so analysts can distinguish genuine price changes from data-quality anomalies.
The final dataset can be delivered through CSV, JSON, Excel, databases, cloud storage, dashboards, or an automated API depending on business requirements.
For high-frequency monitoring, an API-based architecture can continuously push new observations into analytics systems, enabling near-real-time dashboards and alerts.
Why Automation Matters in 2026?
The Brazilian app-based transportation ecosystem is evolving rapidly. Recent reporting indicates that approximately two million people worked through apps in Brazil in 2025, with passenger transportation representing the largest share of platform work.
At the same time, platforms are experimenting with new commercial models and broader mobility services. Recent developments involving Uber's driver programs and 99's expansion in Salvador demonstrate how quickly the operating environment can change.
For businesses, this means yesterday's market snapshot may not adequately represent today's competitive environment.
Automated data collection creates a continuous evidence layer that supports faster decisions and more reliable market analysis.
How iWeb Data Scraping Can Help You?
Real-Time Fare Monitoring
iWeb Data Scraping can collect structured fare observations across selected Salvador routes, helping businesses identify pricing changes, compare categories, and monitor recurring demand-driven fluctuations efficiently.
ETA Intelligence
Automated collection can capture pickup and journey estimates at scheduled intervals, allowing teams to benchmark service responsiveness, identify congestion-sensitive locations, and improve transportation planning decisions.
Vehicle Availability Analysis
Structured vehicle and service-category data can reveal where different ride options appear, helping mobility businesses understand supply distribution and identify potential service gaps.
Historical Market Datasets
iWeb Data Scraping can transform repeated observations into historical datasets, enabling organizations to study pricing trends, seasonal behavior, peak periods, route differences, and long-term mobility changes.
Scalable Data Delivery
Collected information can be cleaned, standardized, and delivered through preferred formats or automated pipelines, making ride-hailing intelligence easier to integrate with dashboards, databases, analytics platforms, and business workflows.
Conclusion
Brazil's ride-hailing ecosystem is increasingly data-driven, and Salvador offers a particularly interesting market for monitoring fare movements, ETAs, vehicle availability, and service categories. Businesses that systematically collect these signals can move beyond isolated price checks toward continuous mobility intelligence.
With automated Automotive data scraping, organizations can combine transportation observations with broader vehicle and mobility datasets, while a flexible scraping API can make continuously refreshed ride-hailing information easier to integrate into applications, dashboards, forecasting models, and analytical systems.
The real value lies not simply in collecting fares, but in understanding when, where, and why those fares and ETAs change. With historical and real-time data working together, businesses can develop stronger pricing benchmarks, improve transportation planning, identify market opportunities, and build smarter mobility products.
FAQs
Depending on availability and permitted access, datasets can include fares, ETAs, vehicle categories, availability, trip duration, routes, timestamps, and geographic information.
Ride-hailing prices can change according to demand, supply, traffic, promotions, and other conditions. Real-time collection helps businesses observe these changes instead of relying on outdated snapshots.
Yes. A monitoring system can be configured around selected neighborhoods, pickup zones, destinations, routes, or geographic coordinates to create localized mobility datasets.
Historical datasets can support price benchmarking, demand analysis, ETA comparisons, route analysis, market research, forecasting, competitive intelligence, and mobility planning.
Yes. Structured data can be delivered in formats and pipelines suitable for databases, analytics platforms, dashboards, cloud environments, and automated business applications, subject to applicable platform terms and laws.