

Introduction
The global ride-hailing industry is entering a more data-driven phase in 2026. Urbanization, smartphone adoption, digital payments, dynamic pricing, electric vehicles, and autonomous mobility are reshaping how passengers book rides and how operators compete for demand.
Market estimates vary considerably depending on how ride-hailing is defined. One 2026 estimate places the market at $213.2 billion, while another projects a broader $178.53 billion market for 2026. These differences highlight why businesses need consistent, granular datasets rather than relying on a single market-size figure.
For companies seeking granular mobility intelligence, Scrape Global ride-hailing market data 2026 can reveal fare movements, service availability, vehicle categories, trip characteristics, locations, competitors, and demand patterns. Businesses can also Extract average ride-hailing fare per trip across 50+ cities to benchmark transportation costs across major global markets.
Why Global Ride-Hailing Data Matters in 2026?
Ride-hailing has evolved from a convenient alternative to taxis into a sophisticated mobility ecosystem. Platforms increasingly compete on price, availability, pickup speed, vehicle categories, loyalty programs, subscriptions, and multimodal transportation.
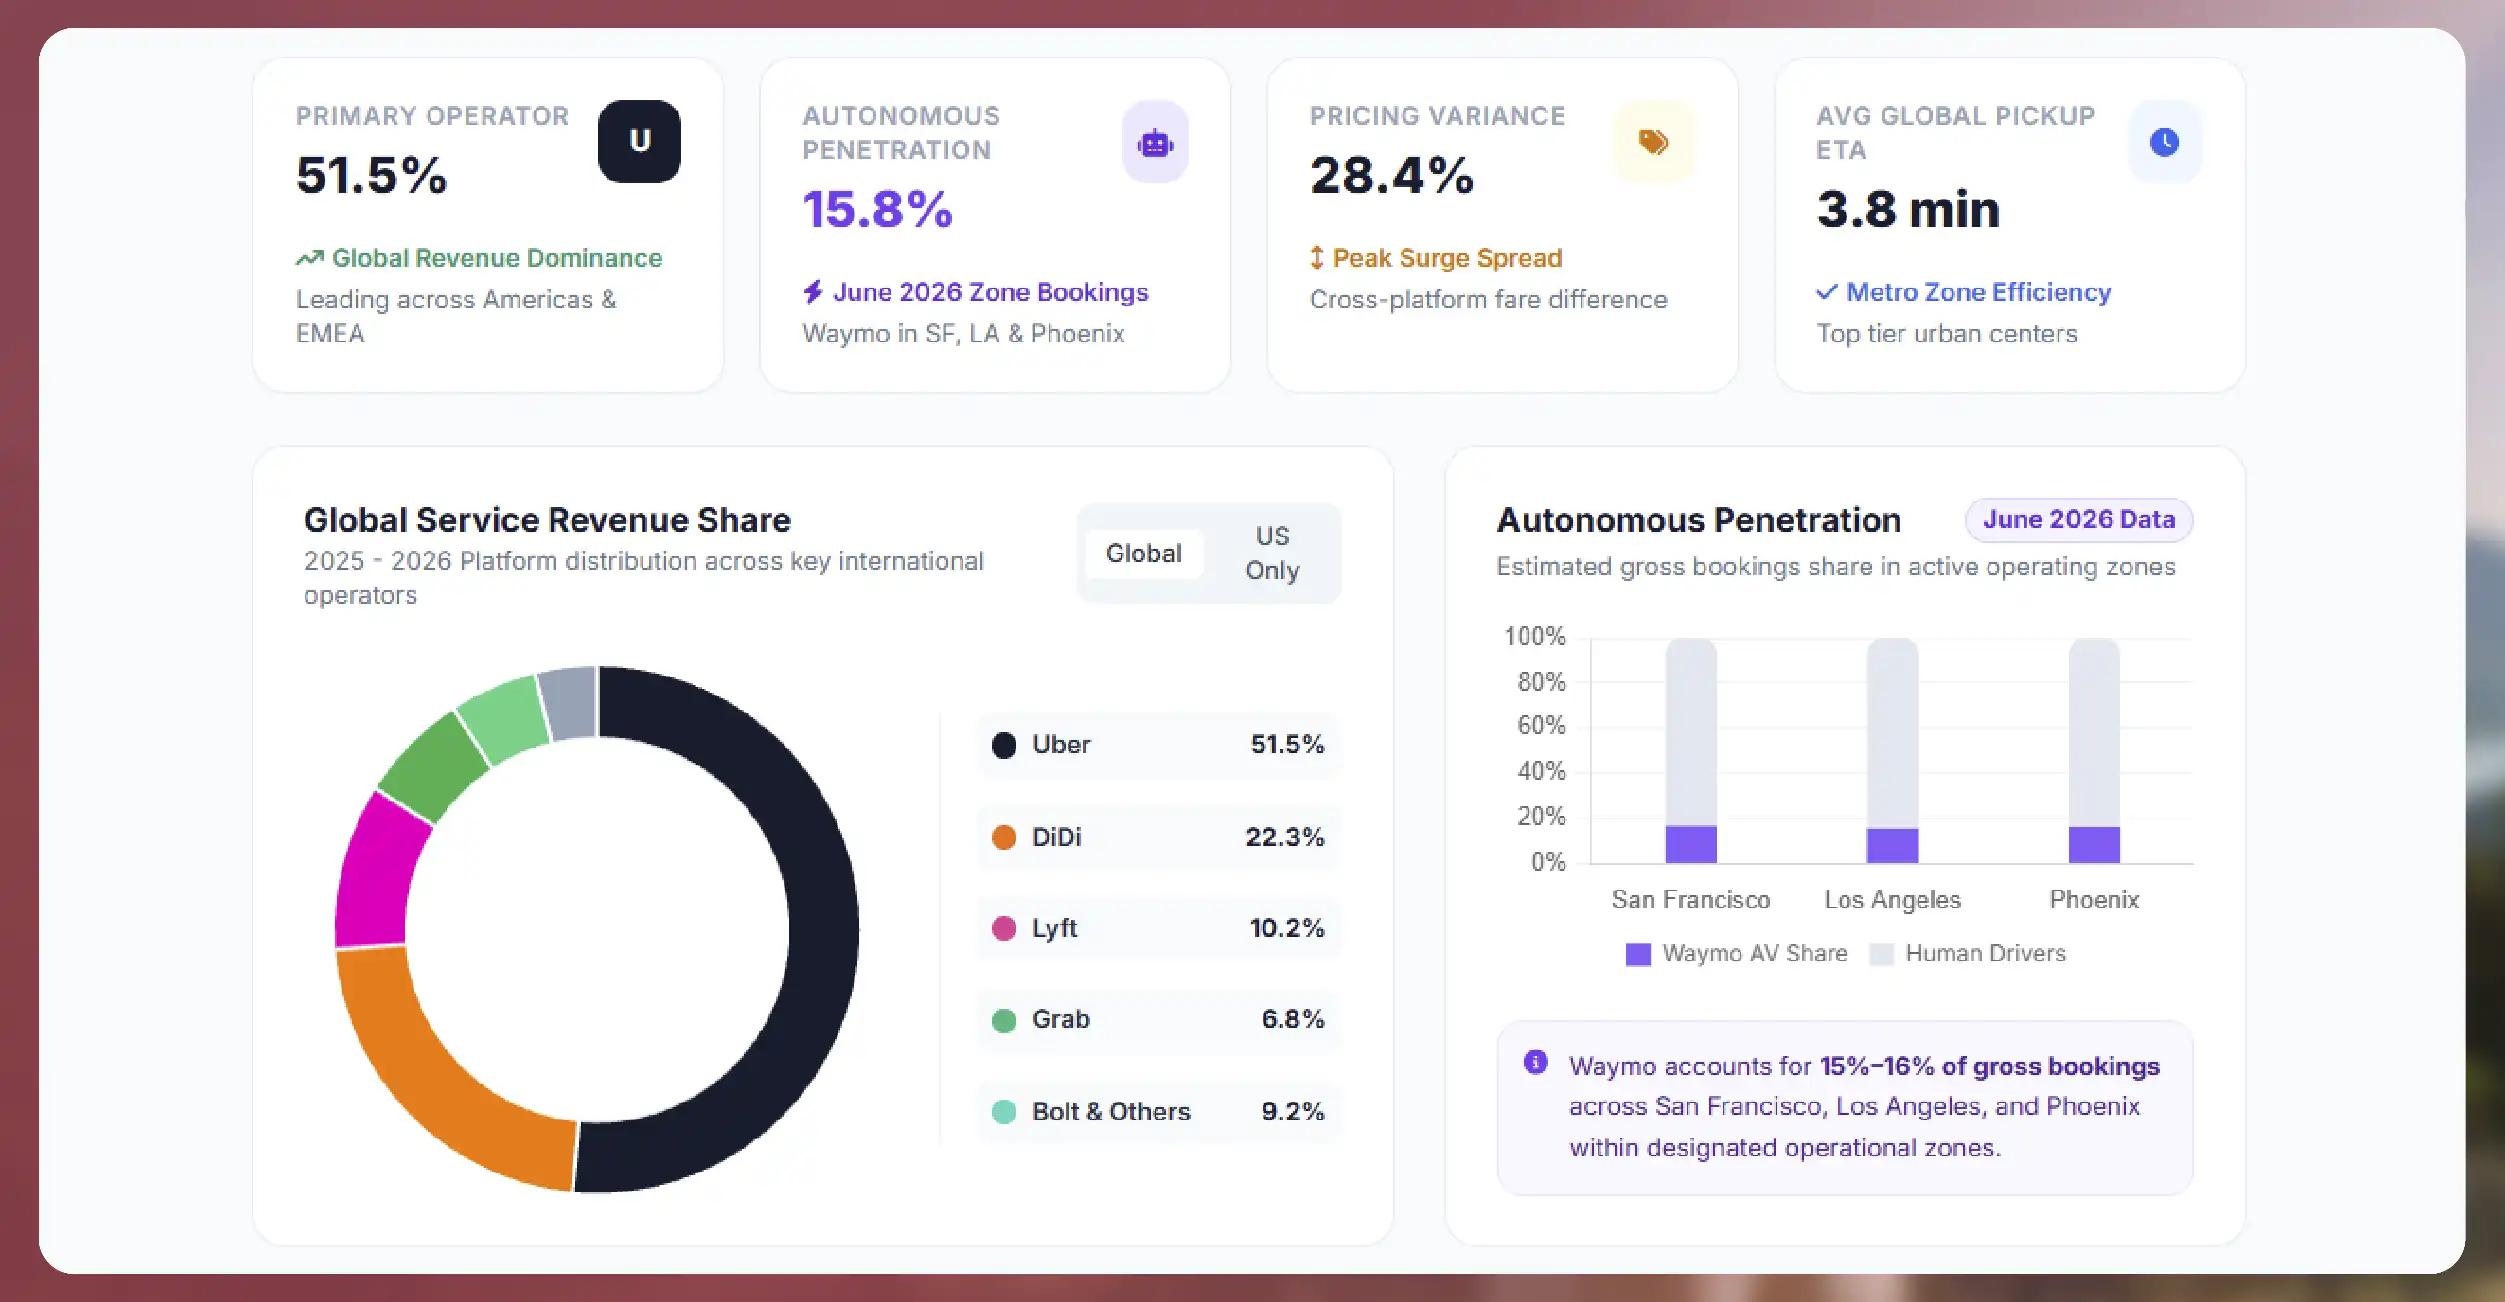
Major platforms include Uber, DiDi, Lyft, Grab, Bolt, inDrive, and numerous regional operators. One 2026 market analysis estimates that Uber accounted for 51.5% of global ride-hailing service revenue in 2025, followed by DiDi, Lyft, Grab, and Bolt.
At the same time, competitive boundaries are changing. Autonomous ride services are beginning to capture meaningful booking volumes in selected U.S. markets. Waymo, for example, was estimated to represent roughly 15–16% of gross bookings in San Francisco, Los Angeles, and Phoenix in June 2026 within the analyzed operating zones.
This makes market intelligence increasingly important. Companies cannot simply compare advertised base fares. They need to understand what passengers actually see at specific locations, times, vehicle types, and demand conditions.
Understanding Ride-Hailing Fare Dynamics
Ride-hailing prices are rarely static. A passenger requesting the same origin and destination at 8:00 AM and 11:00 AM can encounter significantly different fares.
Pricing may depend on:
- Pickup and destination
- Distance and estimated duration
- Vehicle category
- Local demand
- Driver availability
- Traffic conditions
- Weather
- Events and congestion
- Airport or toll charges
- Promotional discounts
- Surge or dynamic pricing
- Time of day and day of week
This makes Ride-hailing price comparison across global cities particularly valuable for transportation companies, travel platforms, mobility analysts, researchers, and investors.
For example, a business could compare standard rides, premium rides, SUVs, taxis, motorcycles, and electric vehicles across New York, London, Mumbai, Singapore, Dubai, Paris, São Paulo, Tokyo, Sydney, and dozens of other markets.
The resulting dataset can reveal not just which city is expensive, but why prices differ and how those differences change over time.
What Data Can Be Collected?
A comprehensive ride-hailing dataset can include far more than the displayed fare.
Businesses can Scrape ride-hailing fare data by city and structure information around specific geographic, temporal, and service-level dimensions.
Potential fields include:
| Data Category | Example Fields |
|---|---|
| Location | City, pickup area, destination, coordinates |
| Pricing | Base fare, displayed fare, surge multiplier, fees |
| Trip | Distance, duration, estimated arrival |
| Vehicle | Economy, premium, SUV, taxi, bike, EV |
| Availability | Available services, driver availability |
| Timing | Timestamp, weekday, peak/off-peak |
| Competition | Platform, vehicle category, fare difference |
| Promotions | Discounts, coupons, subscriptions |
| Market Signals | Price changes, availability changes, demand indicators |
When collected repeatedly, these fields transform isolated fare observations into a historical mobility intelligence database.
Ride-Hailing Market Analysis in 2026
A meaningful Ride-hailing market analysis 2026 should go beyond market size. It should evaluate how prices, supply, demand, technology, competition, and consumer behavior interact.
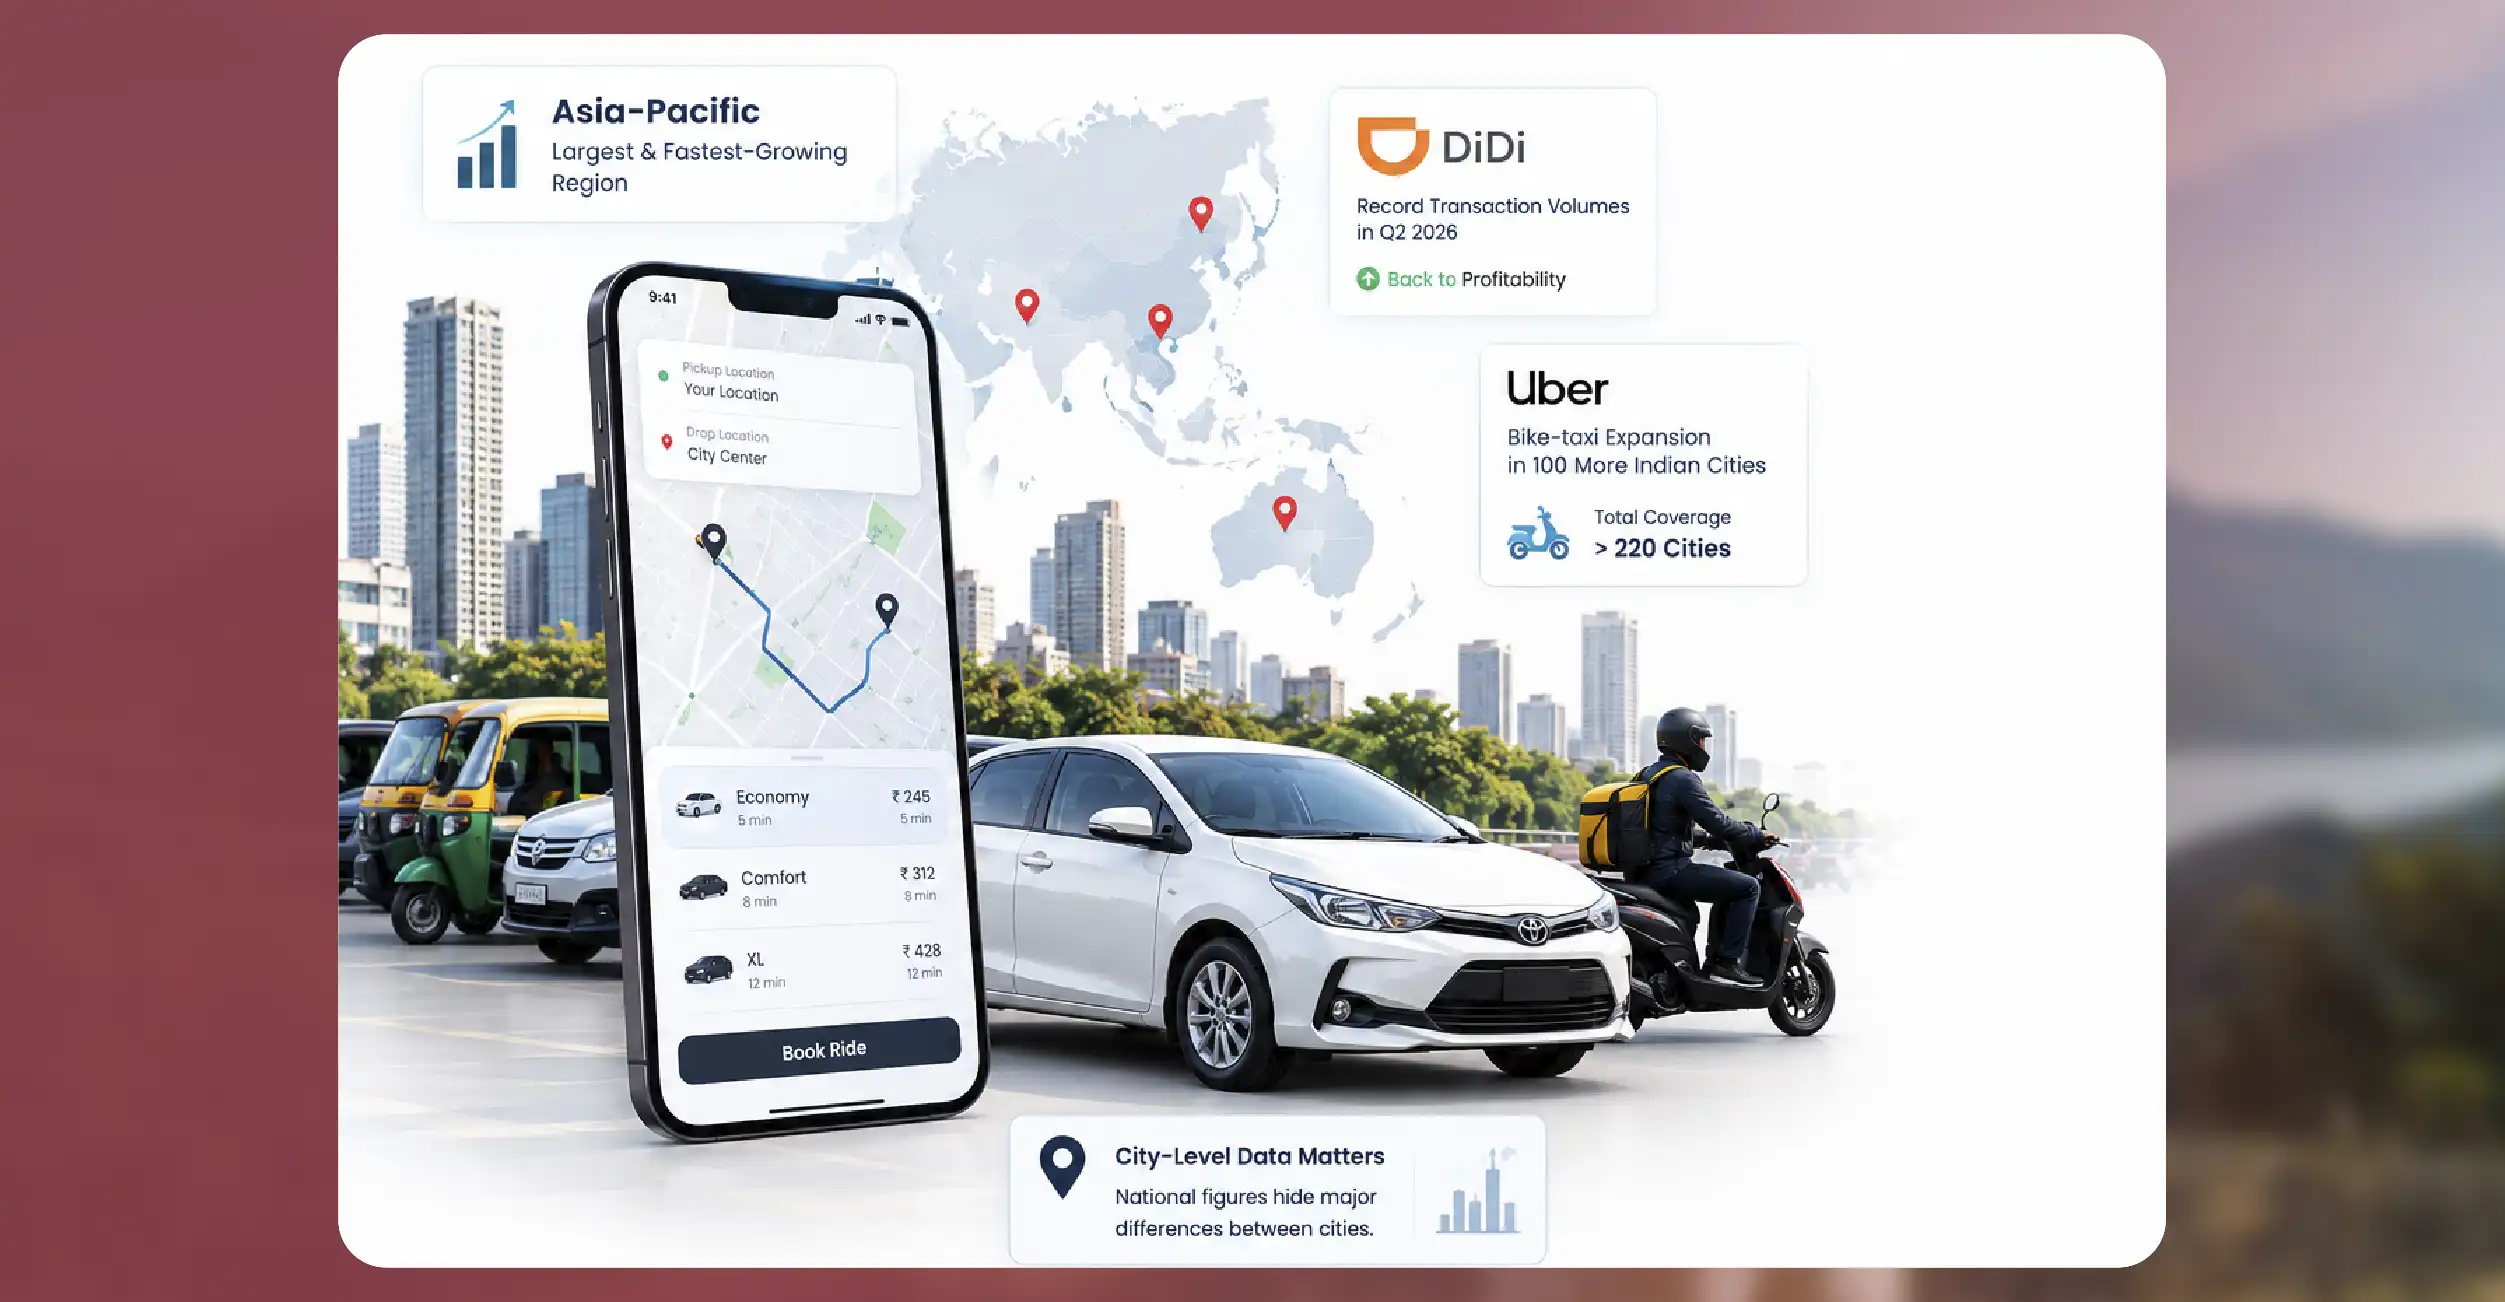
Asia-Pacific remains a particularly important region. Research published in 2026 identifies Asia-Pacific as the largest regional market and among the fastest-growing areas, although market rankings can vary according to methodology and segmentation.
China is also demonstrating strong mobility activity. DiDi reported record transaction volumes in its China mobility business during Q2 2026 while returning to profitability, alongside continued international expansion.
India represents another rapidly changing market. Uber expanded its bike-taxi services into 100 additional Indian cities in 2026, taking its reported coverage beyond 220 cities and intensifying competition with operators such as Rapido.
These developments demonstrate why city-level datasets are essential. National market figures can hide major differences between individual cities.
Competitive Fare Benchmarking
Transportation companies can use historical fare datasets to identify where competitors are cheaper, where premium pricing is accepted, and when dynamic pricing becomes most aggressive.
Suppose a mobility company monitors five platforms across 50 cities. It can calculate:
- Average fare per trip
- Fare per kilometer
- Fare per minute
- Minimum and maximum observed fares
- Average surge premium
- Peak-hour fare changes
- Weekend versus weekday differences
- Airport versus downtown pricing
- Premium versus economy price gaps
This enables companies to develop practical benchmarks instead of relying on occasional manual checks.
Travel companies can also use these insights to estimate transportation expenses for customers. Hotels, airlines, destination-management companies, and travel apps can incorporate ride estimates into itinerary planning and location intelligence.
Automating Data Collection Through APIs
Large-scale monitoring requires automation. Ride-hailing API data Scraping can help organizations collect structured mobility information at regular intervals rather than depending on manual observations.
An automated pipeline can capture requested routes across multiple cities, normalize currencies, standardize vehicle categories, timestamp each observation, and store historical records.
For example, an organization could monitor:
City → Pickup Zone → Destination → Platform → Vehicle Type → Fare → Distance → ETA → Timestamp
This structure makes it easier to compare thousands or millions of observations.
The resulting dataset can feed dashboards, forecasting systems, pricing engines, competitive intelligence platforms, or internal analytics environments.
Tracking Dynamic Pricing
One of the most valuable applications is the ability to Track Dynamic Ride-Hailing Prices throughout the day.
Dynamic pricing is particularly important because a single fare snapshot provides limited insight. Repeated collection can show how pricing changes during morning commutes, lunch periods, evening peaks, weekends, holidays, concerts, sporting events, airport rushes, or periods of limited driver supply.
Researchers can identify recurring pricing patterns and calculate the difference between normal and peak conditions.
Using Mobile App Data Scraping Services businesses can then develop models for expected fare ranges instead of treating displayed prices as fixed values.
Autonomous Mobility Is Changing the Competitive Landscape
Another major development in 2026 is the increasing interaction between conventional ride-hailing and autonomous vehicles.
Uber announced significant restructuring in September 2026 while emphasizing investment in autonomous vehicle technology, highlighting how robotaxis are becoming strategically important to established mobility platforms.
Meanwhile, Waymo's growing booking share in selected cities demonstrates that autonomous transportation is moving from experimentation toward direct competition with traditional ride-hailing.
For market researchers, this creates a new category of data to monitor: human-driver rides versus autonomous rides, pricing differences, availability, wait times, service zones, and customer adoption.
How iWeb Data Scraping Can Help You?
Global Fare Intelligence
iWeb Data Scraping can collect ride prices across multiple cities, platforms, routes, vehicle categories, and time periods, creating standardized datasets for global fare benchmarking.
Competitive Monitoring
Businesses can monitor competitor pricing, promotions, vehicle availability, estimated pickup times, and service categories to identify market opportunities and changing competitive positions.
Historical Price Analysis
Repeated collection creates historical datasets that reveal peak-hour pricing, seasonal fluctuations, surge patterns, city-level differences, and long-term changes in ride-hailing economics.
Scalable Data Delivery
iWeb can structure large ride-hailing datasets into formats such as JSON, CSV, Excel, databases, or cloud-ready pipelines for analytics, dashboards, forecasting, and business intelligence.
Customized Market Intelligence
Organizations can define cities, routes, platforms, vehicle types, collection frequencies, and required fields, enabling customized datasets aligned with specific transportation research and competitive intelligence goals.
Conclusion
The global ride-hailing industry is becoming increasingly competitive, dynamic, and technology-driven. In 2026, businesses need more than broad market estimates—they need granular information about fares, routes, vehicle categories, availability, pricing behavior, and emerging autonomous mobility.
By combining Automotive data scraping, companies can continuously collect and analyze mobility signals across markets. This supports better pricing intelligence, competitive benchmarking, travel planning, demand forecasting, and transportation strategy.
As ride-hailing expands into new cities and autonomous services increasingly enter the mobility ecosystem, reliable scraping API will become one of the most valuable assets for understanding where the market is heading.
FAQs
Global ride-hailing market data includes information about ride prices, trips, platforms, vehicle categories, availability, estimated travel times, locations, demand patterns, and competitive activity across international markets.
Monitoring fares helps companies understand competitor pricing, identify dynamic pricing patterns, compare cities, forecast transportation expenses, and develop more informed mobility and pricing strategies.
A dataset can cover major cities across North America, Europe, Asia-Pacific, Latin America, the Middle East, and Africa, depending on the required geographic scope and platforms.
Collection frequency depends on the use case. Competitive monitoring may require hourly or daily observations, while research projects may use scheduled sampling across specific peak and off-peak periods.
Yes. Historical fare, availability, route, timing, and demand-related observations can be used to identify trends, develop benchmarks, build forecasting models, and support transportation market intelligence.