Introduction
The UK electric mobility market is moving from early adoption toward mass-market
infrastructure requirements, making UK EV Charging Gap Analysis increasingly important for
investors, charging operators, retailers, fuel-station owners, fleet managers, and policymakers.
As of 1 April 2026, the UK had 119,080 public EV chargers, including 27,372 chargers rated at
50kW or above. By the end of July 2026, Zapmap reported 122,724 public EV chargers across 47,441
charging locations.
A robust assessment requires Regional EV charger and fuel station data analysis
because charger availability is not distributed evenly across population centres, transport
corridors, rural communities, and commercial destinations.
The strategic question is also increasingly focused on Compare EV charger density
with fuel station density UK, rather than simply counting chargers. The Department for Transport
estimated approximately 60,802 fuel pumps from 8,329 UK petrol stations, compared with 116,052
public EV chargers on 1 January 2026. However, the fuel-pump figure is an estimate rather than a
directly measured national dataset.
This makes EV charging station density vs Fuel stations an especially useful
analytical framework. A fuel station can contain several pumps and serve multiple vehicles
simultaneously, while EV chargers vary substantially by power, charging duration, and location.
The core purpose is to Identify EV charging infrastructure gaps in the UK by
examining population-adjusted availability, rapid-charging provision, urban-rural differences,
motorway access, and potential demand.
Ultimately, the analysis can reveal EV infrastructure expansion opportunities by UK
region, helping operators determine where additional standard, rapid, and ultra-rapid capacity
can create the greatest commercial and mobility impact.
The UK Infrastructure Baseline
The headline numbers suggest that the UK's charging network has already achieved
considerable scale. Official statistics recorded 119,080 public EV chargers in April 2026, while
Zapmap's July dataset reached 122,724. The difference is partly explained by reporting dates and
methodology, so datasets should always be compared using consistent collection dates and
definitions.
The composition of the network is equally important. In April 2026, approximately
50% of public chargers were standard units rated from 3kW to below 8kW, 27% were standard-plus
chargers from 8kW to below 50kW, 12% were rapid chargers from 50kW to below 150kW, and 11% were
ultra-rapid chargers at 150kW or above.
That means roughly half the public network is oriented toward slower charging. Such
infrastructure is valuable for residential streets, workplaces, destinations, and long
dwell-time locations, but it cannot directly substitute for the convenience of a conventional
fuel stop.
The same distinction appears geographically. London has by far the highest total
charger density at 340.0 chargers per 100,000 residents. Yet its rapid-or-above density is only
27.0 per 100,000, below the UK average of 39.5. Scotland, by contrast, has 228.5 total chargers
and 57.2 rapid-or-above chargers per 100,000 people.
This demonstrates why a simple charger-count ranking can produce misleading
conclusions.
Regional Density Reveals the Real Gaps
The regional picture becomes more meaningful when total charger density is compared
with rapid-charging density.
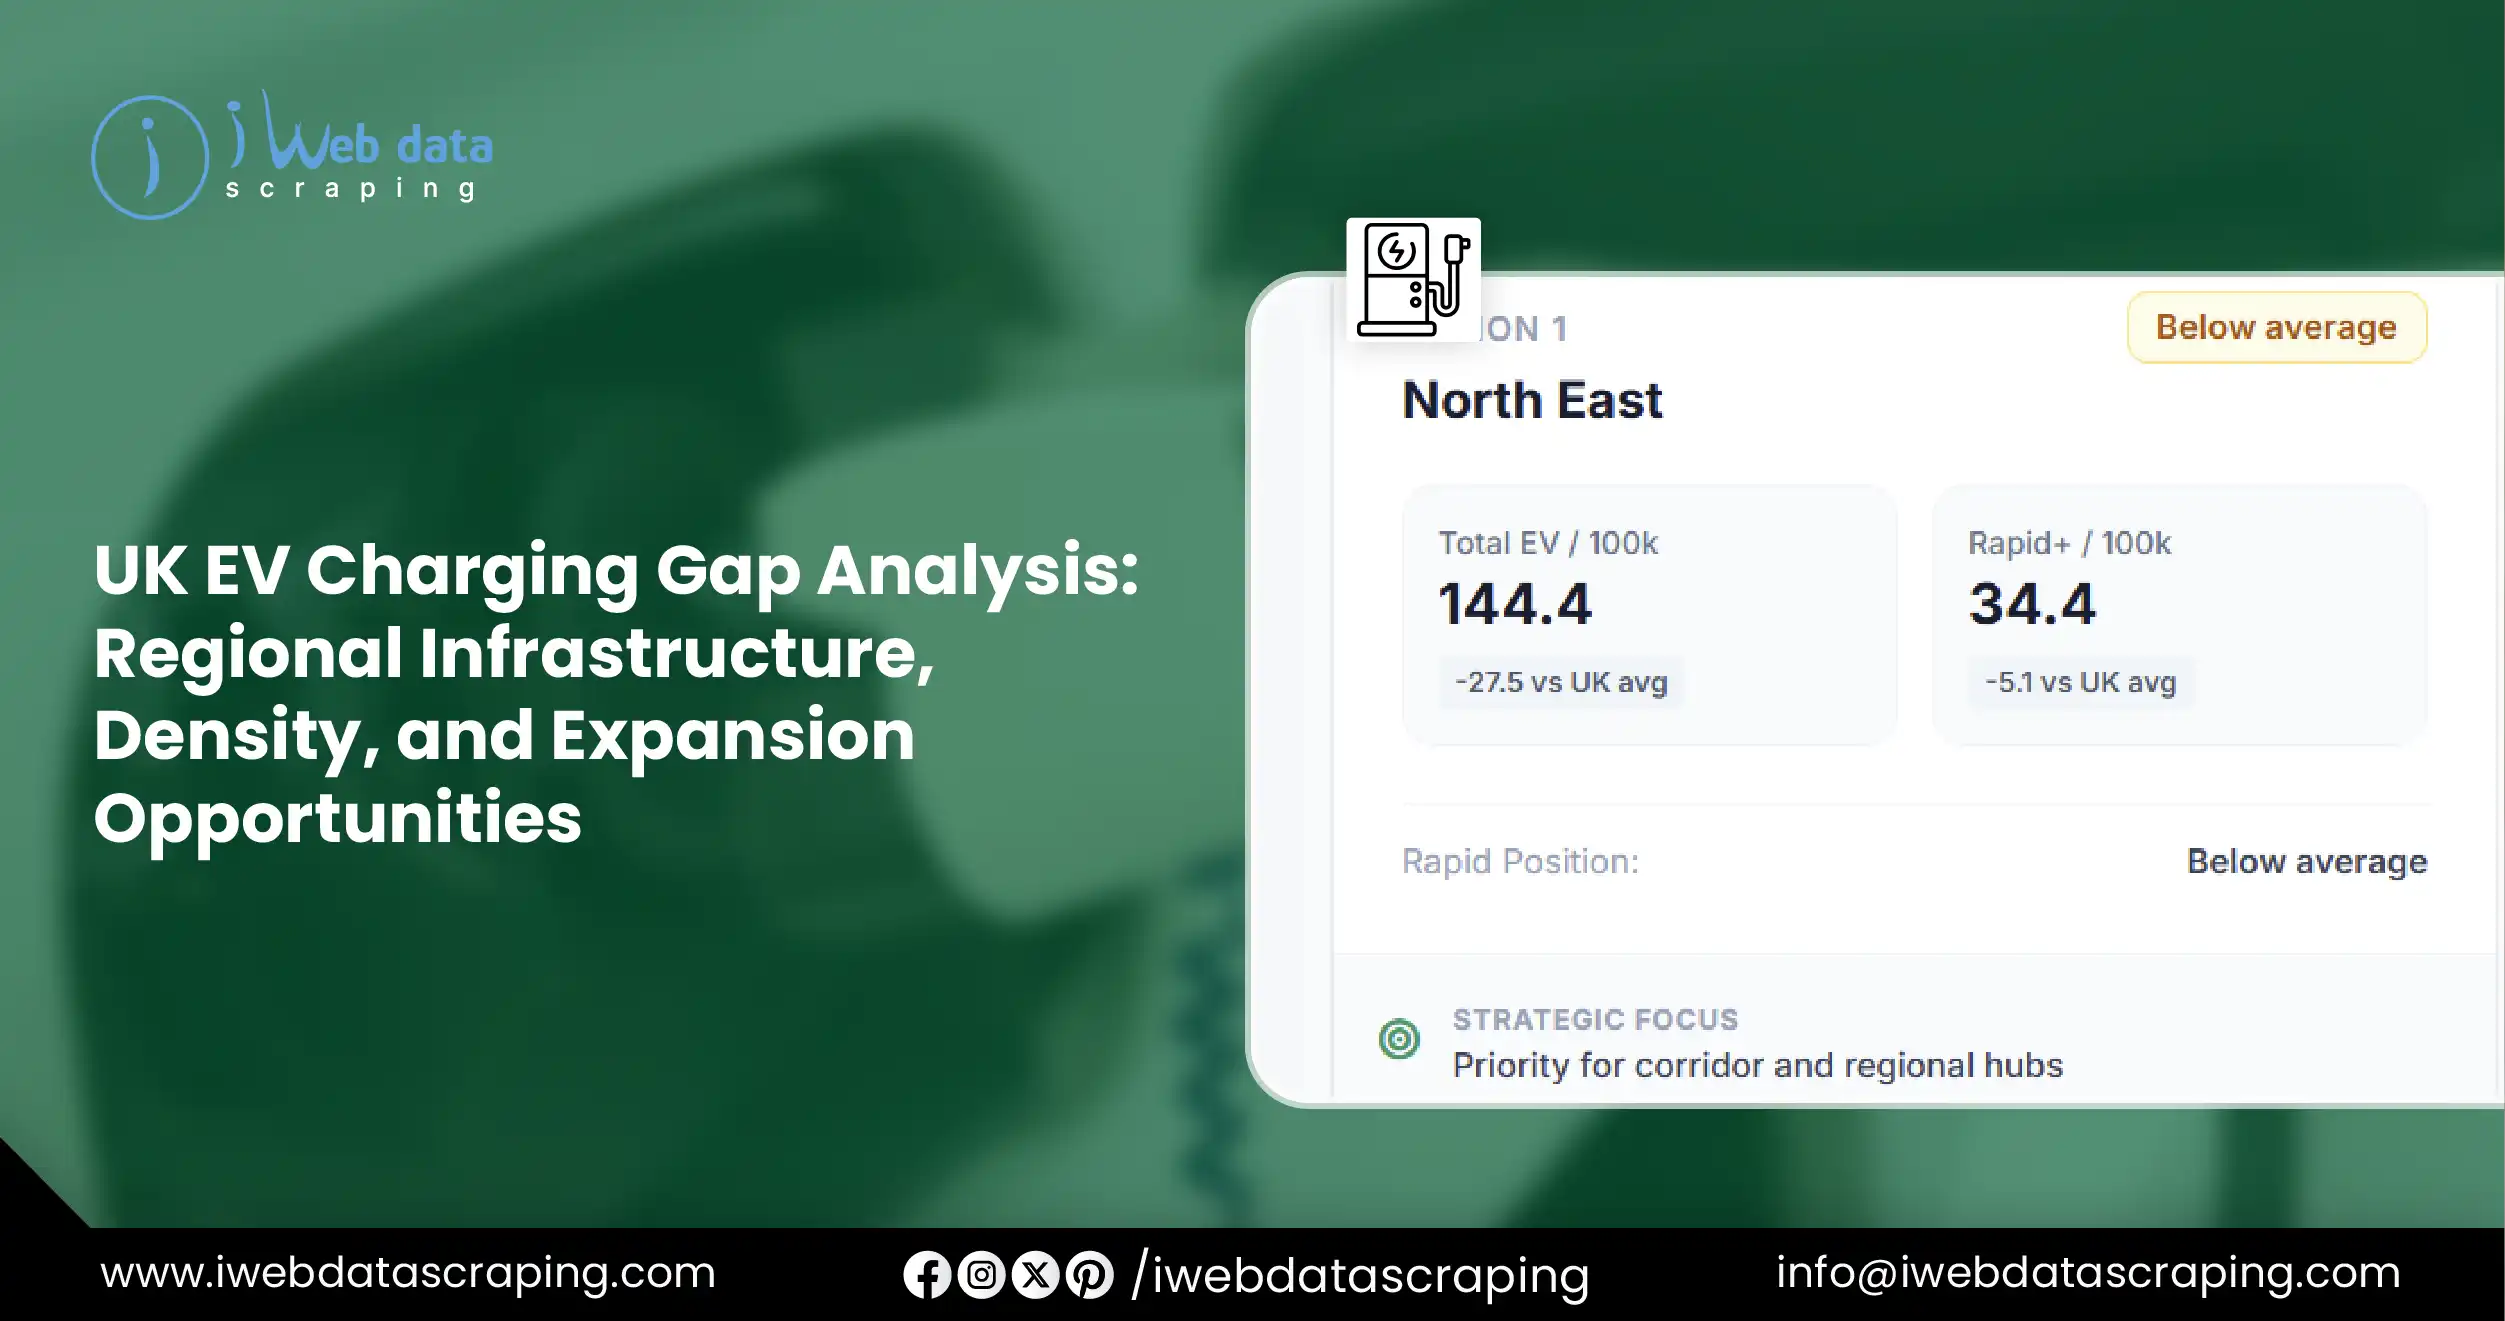
| North East |
144.4 |
34.4 |
-27.5 |
-5.1 |
Below average |
Below average |
Priority for corridor and regional hubs |
| North West |
108.3 |
37.9 |
-63.6 |
-1.6 |
Very low |
Slightly below |
Major population and motorway opportunity |
| Yorkshire & Humber |
110.2 |
34.7 |
-61.7 |
-4.8 |
Very low |
Below average |
Strong opportunity around urban and intercity routes |
| East Midlands |
123.7 |
44.2 |
-48.2 |
+4.7 |
Low |
Above average |
Good rapid base; expand destination coverage |
| West Midlands |
162.6 |
43.3 |
-9.3 |
+3.8 |
Near average |
Above average |
Fleet, logistics and urban expansion opportunity |
| East of England |
150.3 |
46.2 |
-21.6 |
+6.7 |
Below average |
Strong |
Excellent rapid-charging positioning |
| London |
340.0 |
27.0 |
+168.1 |
-12.5 |
Extremely high |
Very low |
Need faster charging and high-capacity hubs |
| South East |
153.0 |
37.3 |
-18.9 |
-2.2 |
Below average |
Slightly below |
High-demand commuter and motorway opportunity |
| South West |
153.9 |
46.4 |
-18.0 |
+6.9 |
Below average |
Strong |
Tourism and long-distance travel opportunity |
| Wales |
179.3 |
39.6 |
+7.4 |
+0.1 |
Above average |
Around average |
Rural and corridor coverage remains important |
| Scotland |
228.5 |
57.2 |
+56.6 |
+17.7 |
Very high |
Very high |
Strong network; geographic distance still matters |
| Northern Ireland |
59.4 |
18.4 |
-112.5 |
-21.1 |
Lowest |
Lowest |
Highest infrastructure expansion priority |
*Source: Department for Transport regional charger-density statistics, 1 April 2026.
Differences are calculated against UK averages of 171.9 total chargers and 39.5 rapid-or-above
chargers per 100,000 residents. *
The table highlights several distinct infrastructure problems. Northern Ireland is
the clearest statistical gap, with only 59.4 chargers per 100,000 residents and 18.4
rapid-or-above chargers. The North West and Yorkshire and the Humber also show comparatively low
total charger density.
London presents the opposite problem. Its 340 chargers per 100,000 people indicate
excellent overall availability, but its rapid density is only 27 per 100,000. Much of London's
infrastructure consists of standard on-street chargers, meaning a high charger count does not
necessarily translate into high-speed charging convenience.
Comparing Chargers With Traditional Fuel Infrastructure
The UK's transition can also be understood through the changing relationship between
EV charging and conventional forecourts. The Department for Transport estimated 60,802 fuel
pumps using 8,329 petrol stations and an historical average of 7.3 fuelling positions per
station. Against 116,052 public EV chargers on 1 January 2026, the public EV network was
approximately 1.91 times larger when comparing charger units with estimated fuel pumps.
However, this comparison should not be interpreted as EVs having nearly twice the
refuelling capacity. A 7kW charger and a 350kW ultra-rapid charger provide radically different
experiences. Likewise, an EV charger can remain occupied for much longer than a petrol pump.
The more useful approach is to compare infrastructure by capacity, utilisation,
dwell time, location, and demand.
| Public EV chargers, Apr 2026 |
119,080 |
Large national network |
Network maturity is increasing |
Optimise location and utilisation |
| Public EV chargers, Jul 2026 |
122,724 |
Continued expansion |
Growth remains active |
New hubs and site partnerships |
| Rapid+ chargers, Apr 2026 |
27,372 |
About 23% of total |
Faster charging capacity is substantial |
En-route and fleet charging |
| Rapid+ chargers, Jul 2026 |
29,246 |
About 24% of total |
Rapid infrastructure continues growing |
Highway and retail hubs |
| Charging locations, Jul 2026 |
47,441 |
Network spread |
Location coverage matters |
White-space mapping |
| Charging hubs, Jul 2026 |
1,056 |
Concentrated high-power supply |
Hub deployment is accelerating |
Large-scale site investment |
| Estimated fuel pumps |
60,802 |
Historical industry-based estimate |
Conventional network remains extensive |
Forecourt conversion |
| Petrol stations |
8,329 |
Traditional refuelling sites |
Potential EV-ready real estate |
Hybrid EV/fuel sites |
| Standard EV chargers |
~59,540* |
Long-dwell charging |
Useful for streets and destinations |
Residential/destination projects |
| Standard-plus chargers |
~32,150* |
Medium-speed charging |
Suitable for retail/workplace use |
Destination charging |
| Rapid chargers |
~14,290* |
Shorter dwell times |
Important for en-route travel |
Motorway and arterial hubs |
| Ultra-rapid chargers |
~13,100* |
Highest throughput |
Closest functional analogue to fast refuelling |
Premium charging hubs |
| Urban EV charger share |
82.8% |
Strong urban concentration |
Rural accessibility requires attention |
Rural destination sites |
| Rural EV charger share |
17.2% |
Similar to rural population share |
Distribution broadly tracks population |
Target specific underserved corridors |
*Approximate category counts derived from DfT's April 2026 percentage distribution;
rounded. DfT reports 50%, 27%, 12%, and 11% respectively. *
The comparison also creates an important opportunity for existing forecourts. Petrol
retailers already possess high-traffic locations, parking, grid connections, roadside
visibility, amenities, and customer familiarity. Converting selected forecourts into
mixed-energy mobility hubs could therefore accelerate charging deployment without requiring
entirely new sites.
Where Expansion Can Deliver the Most Value
A regional gap does not automatically mean that every low-density location requires
hundreds of chargers. Deployment should consider vehicle registrations, traffic volumes,
motorway and A-road flows, local housing patterns, parking availability, fleet demand, tourism,
commercial destinations, and grid capacity.
Northern Ireland represents a strong candidate for accelerated investment because
both total and rapid charging densities are substantially below the UK average. The North West
and Yorkshire and the Humber also warrant attention because large populations combine with
comparatively low total charger density.
Scotland illustrates a different challenge. Its density metrics are high, but
geography creates long-distance travel requirements. A national average can therefore hide the
importance of strategically placed chargers in remote communities, islands, tourist corridors,
and trunk-road routes.
The South West similarly has a strong rapid-charging profile, but tourism creates
seasonal demand spikes. Operators could benefit from analysing summer utilisation separately
from winter demand before sizing new facilities.
London requires a different strategy. Additional standard chargers may increase the
headline count without solving the most important operational problem. High-throughput rapid
hubs, taxi charging, fleet infrastructure, and strategically located fast chargers could
generate greater value.
Building a Data-Led Gap Detection Model
A sophisticated infrastructure study should combine several datasets rather than
relying on charger counts alone. EV charger locations can be mapped against population, EV
registrations, road networks, parking assets, retail centres, motorway services, fuel stations,
property availability, traffic volumes, and electricity-network constraints.
The model can calculate a regional gap score using weighted indicators such as
chargers per 100,000 EVs, rapid chargers per 100,000 residents, average distance to the nearest
rapid charger, chargers per major-road kilometre, charging capacity per traffic volume, and
charger-to-fuel-pump ratios.
Time-series monitoring is equally important. Zapmap reported 122,724 public chargers
at the end of July 2026 and 29,246 rapid or ultra-rapid chargers, with 1,056 open charging hubs.
Tracking these changes monthly can identify regions where infrastructure is expanding quickly
versus regions where demand is growing faster than supply.
This is where automated data collection becomes commercially valuable. Fuel Pricing Intelligence can be integrated with EV
charging-price monitoring to compare the cost of petrol, diesel, and electricity across
competing locations. Real-time pricing, availability, connector type, power rating, opening
hours, and occupancy indicators can create a much richer mobility-market dataset.
Likewise, Web Scraping
Electronics Product Data can support adjacent market research by tracking EV
accessories, home chargers, charging cables, adapters, batteries, and related equipment across
online retailers. Although this sits outside infrastructure mapping itself, it can help
businesses understand the broader EV ecosystem and consumer demand.
Commercial Expansion Opportunities
The strongest investment strategy is unlikely to be a uniform national rollout.
Instead, operators should segment opportunities into four categories: underserved regions,
high-demand urban locations, strategic highway corridors, and existing commercial sites.
A particularly attractive model is the conversion of selected fuel stations into
EV-ready mobility centres. These sites can combine ultra-rapid chargers with convenience retail,
food, rest areas, vehicle services, and conventional fuel during the transition period.
Retail parks and supermarkets are another major opportunity because destination
charging can align vehicle dwell time with shopping duration. Hotels, tourist attractions,
workplaces, hospitals, universities, and residential developments can provide additional demand
pools.
The network should also be evaluated by reliability and accessibility rather than
simply installed capacity. A location with ten chargers but frequent outages may deliver less
practical value than a smaller site with dependable availability.
Conclusion
The UK's EV charging network has reached a scale where the central challenge is no
longer simply installing more chargers. The next phase is about putting the right charger, at
the right speed, in the right location, at the right time.
Official data shows 119,080 public EV chargers as of April 2026, while the latest
Zapmap figures indicate 122,724 by July. Yet regional differences remain substantial: Northern
Ireland has the lowest total and rapid charger densities, while London has exceptionally high
total density but relatively low rapid-charger density.
A robust EV Charging
Infrastructure Data Scraping strategy can continuously collect charger locations, power
ratings, connector types, prices, availability, operating networks, opening hours, and site
characteristics. Combined with fuel-station, traffic, population, EV-registration, and
commercial-location datasets, this creates a continuously updated infrastructure intelligence
layer.
Web Scraping API Services can then deliver
structured regional datasets to dashboards, investment models, mapping applications, and
competitive-intelligence systems.
For businesses managing large and frequently changing datasets, Managed web scraping
can provide scheduled collection, validation, deduplication, monitoring, and structured delivery
without requiring internal teams to maintain the entire data pipeline.
The ultimate goal of UK EV charging analysis is therefore not simply to count
infrastructure. It is to identify where charging demand is underserved, understand why the gap
exists, measure the economics of closing it, and continuously monitor how the market changes.
That approach can help charging operators, fuel retailers, mobility platforms, investors, local
authorities, and energy businesses make more precise infrastructure decisions as the UK's
electric-vehicle transition accelerates.
Experience top-notch web scraping service
and mobile app scraping solutions with iWeb Data
Scraping. Our skilled team excels in extracting various data sets, including retail store locations and beyond. Connect with us
today to learn how our customized services can address your unique project needs, delivering the
highest efficiency and dependability for all your data requirements.