Introduction
The UK fitness industry is undergoing continuous transformation as consumers
increasingly prioritize accessible gyms, specialized training facilities, affordable
memberships, boutique fitness concepts, and convenient locations. UK gym locations Insights and
market analysis 2026 can help brands understand where fitness demand is concentrated, how
competitors are distributed, and which geographic areas may offer expansion opportunities.
Location-level data provides a practical foundation for understanding gym density,
brand presence, catchment areas, and local competition. By using structured datasets, businesses
can Scrape UK gym chain location data across cities, regions, postcodes, and neighborhoods to
identify patterns that are difficult to evaluate through manual research.
The broader UK Gym Chains Market Analysis 2026 can combine location information with
attributes such as gym type, membership positioning, opening hours, facilities, ratings,
reviews, addresses, coordinates, and surrounding commercial activity. This creates a detailed
market intelligence framework for fitness operators, investors, property consultants, and
site-selection teams.
Why UK Gym Location Data Matters in 2026?
Gym performance is closely connected to geography. A fitness facility can have
strong demand in one neighborhood and face intense competitive pressure only a few miles away.
Population density, employment centers, residential development, transport connectivity, student
populations, income levels, and commercial activity can all influence potential demand.
A location dataset makes it possible to compare these variables systematically.
Instead of evaluating individual gyms manually, analysts can create a geographic view of the
market and identify clusters, underserved areas, competitive hotspots, and emerging fitness
corridors.
Location analysis can also support decisions around new gym openings. Brands can
examine competitor proximity, existing gym density, local amenities, and accessibility before
investing in a new property.
Building a UK Gym Chain Location Dataset
A comprehensive gym dataset should extend beyond business names and addresses. For
meaningful market analysis, every location can be enriched with multiple attributes.
Typical fields may include:
- Gym or fitness brand
- Facility name
- Full address
- City
- County
- Postcode
- Latitude and longitude
- Gym category
- Opening hours
- Membership information
- Available facilities
- Customer rating
- Review count
- Website
- Contact information
- Nearby competitors
- Shopping and commercial surroundings
- Public transport proximity
- Data collection date
The resulting dataset can be structured for analysis, dashboards, geographic
information systems, or internal business intelligence platforms.
Competitive Geographic Mapping
One of the most valuable applications of gym location data is understanding
competitive concentration. A map containing hundreds or thousands of facilities can reveal where
major fitness operators have established strong geographic footprints.
Gym chain competitor location analysis UK can compare the distribution of national
chains, regional operators, independent gyms, boutique studios, and specialist facilities.
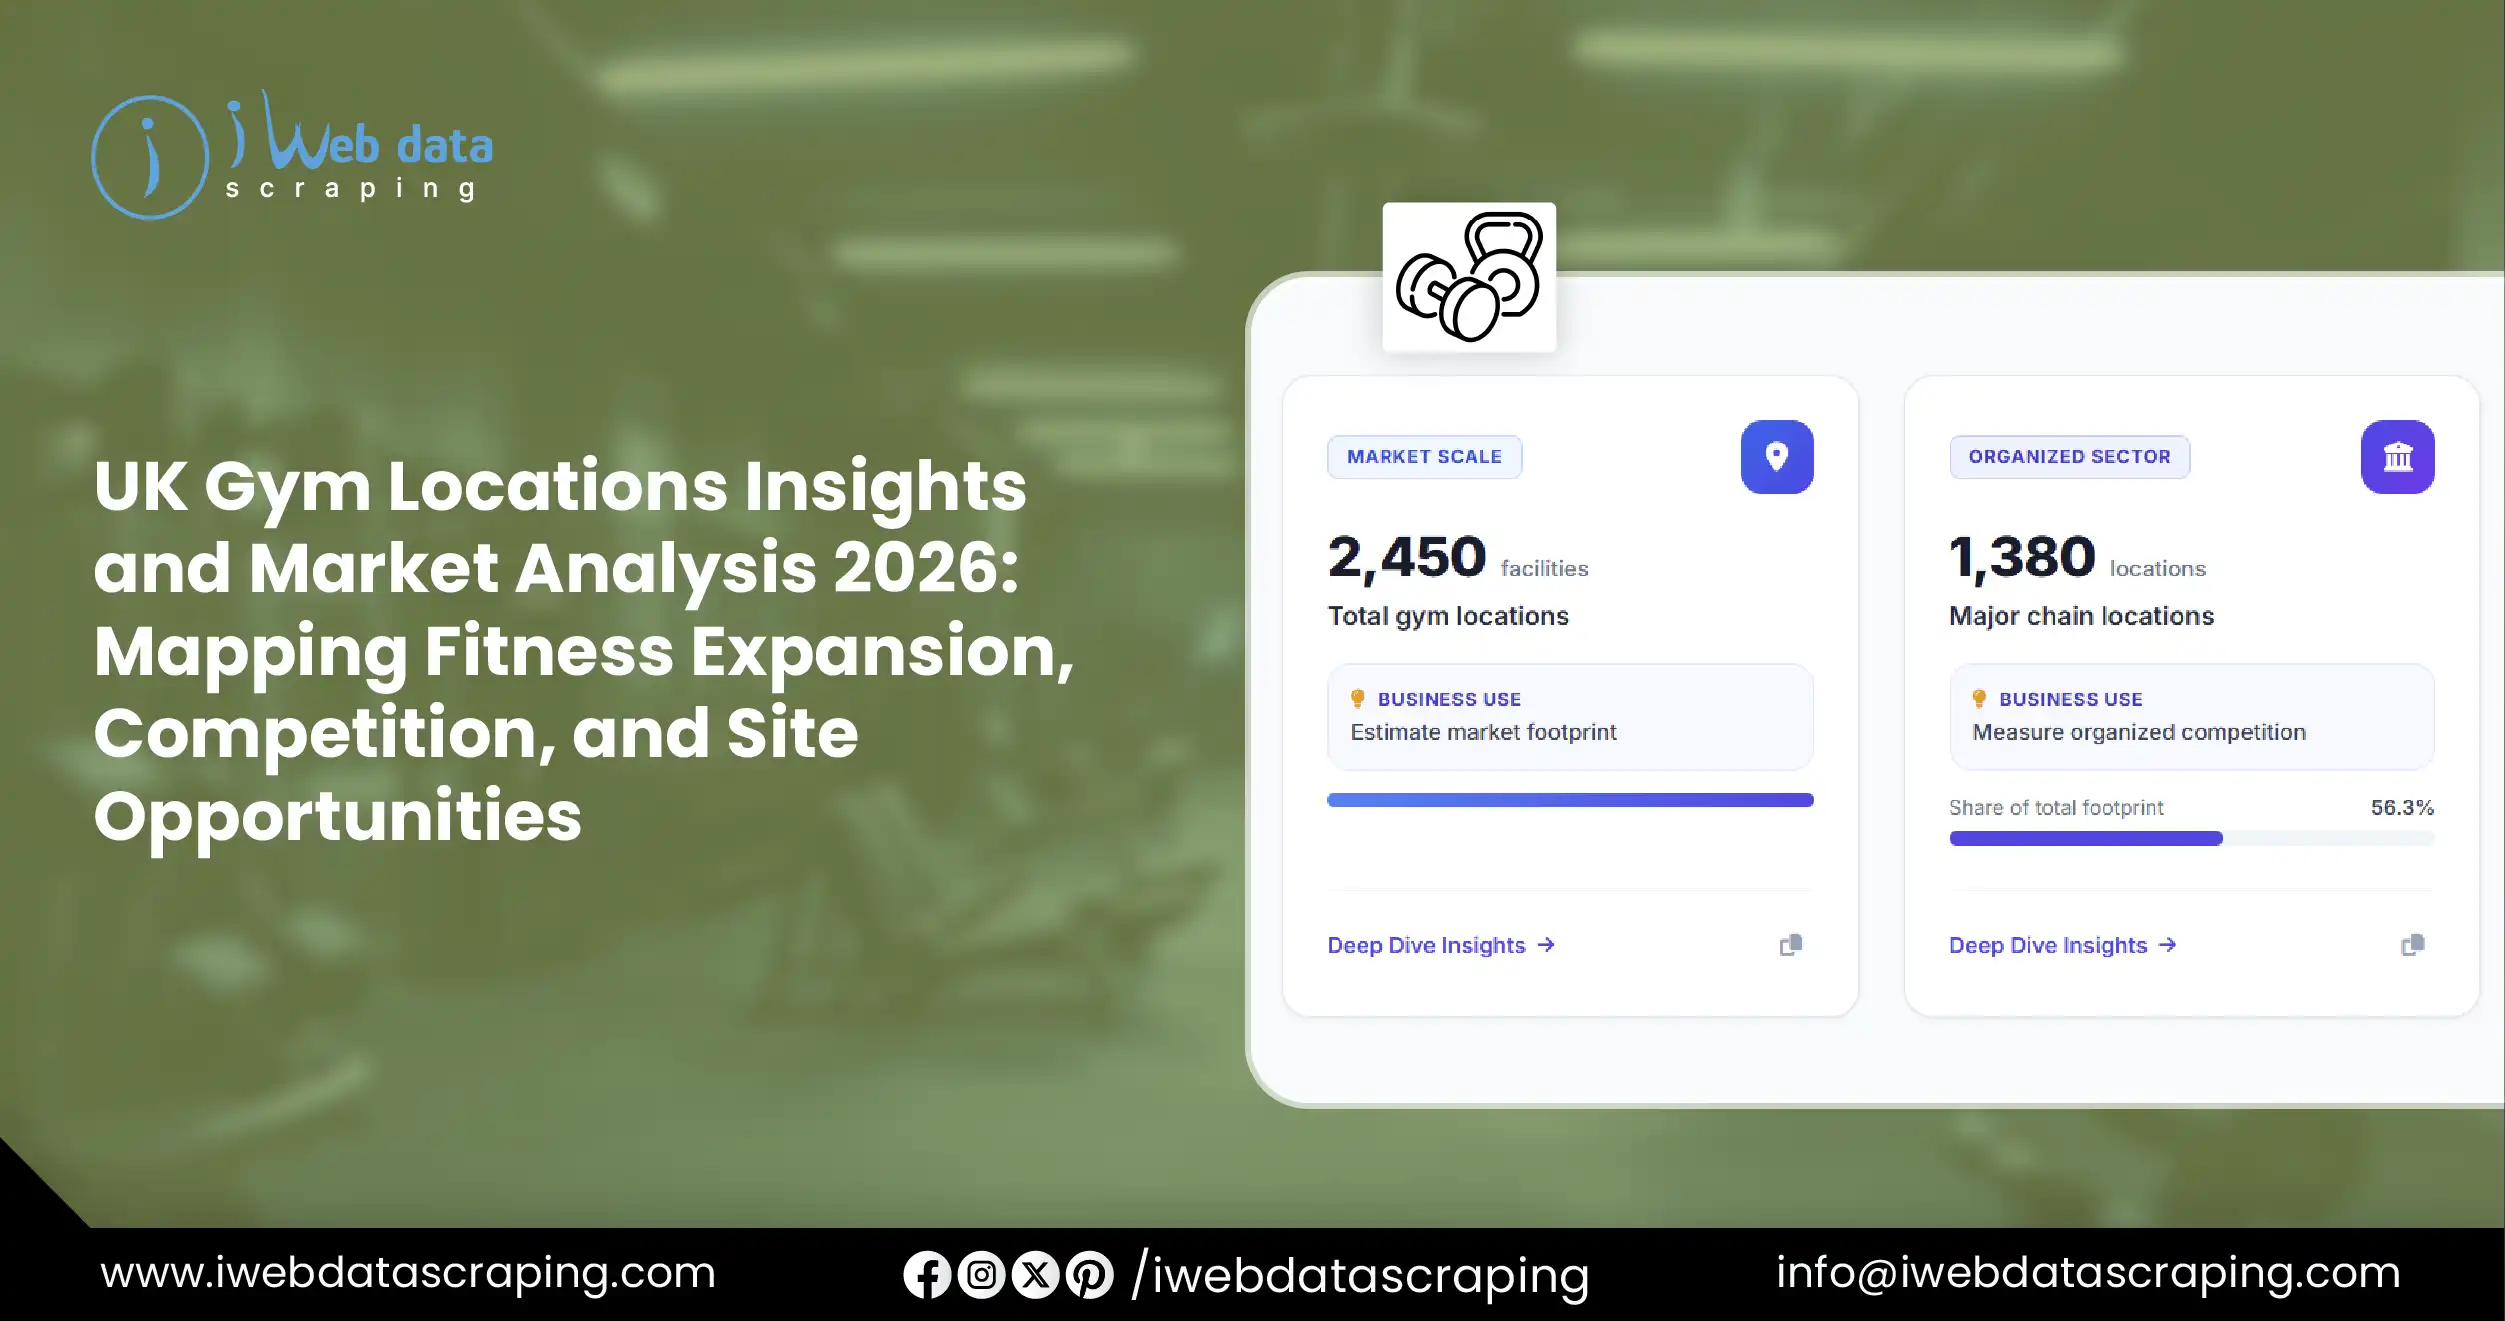
For example, analysts can calculate:
| Total gym locations |
2,450 |
Estimate market footprint |
| Major chain locations |
1,380 |
Measure organized competition |
| Independent facilities |
1,070 |
Identify fragmented markets |
| Average competitor distance |
2.8 km |
Assess local saturation |
| High-density areas |
185 |
Identify competitive clusters |
| Low-density areas |
240 |
Investigate underserved zones |
| Average rating |
4.2/5 |
Compare customer perception |
| Average reviews |
610 |
Estimate engagement |
| Facilities with 24-hour access |
520 |
Analyze convenience positioning |
These figures are illustrative examples of how a location dataset can be structured
rather than claims about the current UK market.
Gym Brand Footprint Analysis
Different fitness brands often follow different expansion strategies. Some
prioritize large metropolitan areas, while others target suburban communities, retail parks,
business districts, or residential catchments.
A location dataset allows analysts to examine these strategies at scale.
For each brand, businesses can compare the number of locations, geographic coverage,
average distance between branches, concentration by region, and presence within major cities.
| Premium gyms |
320 |
12 |
26.7 |
4.4 |
118 |
| Budget gyms |
740 |
13 |
56.9 |
4.1 |
286 |
| Boutique studios |
410 |
11 |
37.3 |
4.5 |
12 |
| Community gyms |
360 |
13 |
27.7 |
4.2 |
45 |
| Specialist fitness centers |
220 |
10 |
22.0 |
4.3 |
8 |
Again, these values demonstrate a possible analytical dataset structure and should
be replaced with collected observations for production research.
Site Selection Through Fitness Market Data
Opening a gym requires substantial investment in property, equipment, staff,
marketing, and customer acquisition. Location selection therefore becomes a critical strategic
decision.
UK fitness market data Extraction for site selection can bring together geographic
and commercial indicators into a single analytical framework.
Site-selection teams can evaluate:
- Existing gym density
- Residential population
- Local employment concentration
- Competitor distance
- Transport accessibility
- Retail activity
- Parking availability
- Commercial property availability
- Nearby complementary businesses
- Local demographic characteristics
Instead of choosing a site based solely on footfall, analysts can create a broader
location score using multiple measurable variables.
Understanding UK Fitness Market Intelligence
UK fitness market intelligence becomes more valuable when location information is
connected with business and consumer indicators.
A gym with a high rating and large review volume may indicate strong customer
engagement, while a facility with lower visibility but a strategically attractive location may
represent a different competitive opportunity.
Market intelligence can also track changes over time. Newly opened facilities,
relocated gyms, permanently closed branches, changes in operating hours, and changes in
facilities can all be incorporated into historical datasets.
This creates an evolving market-monitoring system rather than a one-time directory.
Fitness and Sports Retail Ecosystem
The fitness economy extends beyond gyms. Fitness sports Stores can provide another layer of
geographic information for understanding consumer ecosystems.
Sports retailers, running stores, nutrition outlets, equipment suppliers, wellness
centers, physiotherapy clinics, sports clubs, and gyms may form geographic clusters.
Analyzing these businesses together can help identify areas where health, wellness,
sports, and fitness demand is already commercially established.
Sports and Fitness Data Scraping for Market Monitoring
Sports and fitness data scraping can
automate the collection of publicly available business information from relevant digital
sources.
A structured scraping workflow can capture location information at regular intervals
and standardize the resulting records. Data validation can then remove duplicates, normalize
addresses, verify coordinates, and identify changes.
A typical workflow includes:
- Source Discovery: Identify relevant gym chains, fitness businesses, sports
facilities, and location sources.
- Data Extraction: Collect business names, addresses, coordinates, facilities,
ratings, reviews, and other relevant fields.
- Data Cleaning: Standardize spelling, addresses, categories, and geographic
fields.
- Deduplication: Identify duplicate locations appearing across multiple sources.
- Geocoding: Convert addresses into latitude and longitude where appropriate.
- Validation: Check records against available source information.
- Storage: Deliver the dataset through CSV, JSON, database, dashboard, or
API-ready formats.
Regional Gym Density Analysis
Regional analysis can reveal differences between major metropolitan areas and
smaller towns.
London, Birmingham, Manchester, Glasgow, Liverpool, Leeds, Bristol, Edinburgh,
Cardiff, and other major urban centers can be examined alongside suburban and regional markets.
A regional dataset may include:
| London |
520 |
310 |
210 |
4.3 |
825 |
92 |
| Greater Manchester |
185 |
104 |
81 |
4.2 |
670 |
78 |
| West Midlands |
172 |
96 |
76 |
4.1 |
590 |
74 |
| West Yorkshire |
128 |
70 |
58 |
4.2 |
560 |
68 |
| Merseyside |
104 |
57 |
47 |
4.1 |
520 |
63 |
| South West |
190 |
101 |
89 |
4.3 |
510 |
61 |
| Scotland |
230 |
128 |
102 |
4.3 |
575 |
65 |
| Wales |
112 |
61 |
51 |
4.2 |
480 |
58 |
The figures above are illustrative for demonstrating how regional benchmarking can
be presented; a live market study should use validated location records.
Using Location Data for Competitor Benchmarking
Competitive benchmarking becomes easier when every facility follows the same data
structure. Analysts can compare brands using standardized indicators rather than relying on
inconsistent manual observations.
Potential measures include location count, geographic coverage, average branch
spacing, ratings, review volumes, operating hours, premium facilities, and proximity to
competitors.
This approach can help businesses understand whether a competitor is pursuing broad
geographic coverage or concentrated expansion.
It can also identify areas where multiple brands are competing for the same customer
catchment.
Catchment and Proximity Analysis
Distance is an important variable in fitness because customers often prefer
facilities that are convenient to their home, workplace, or daily travel route.
Using geographic coordinates, analysts can create catchment zones around each
facility. For example, a dataset could calculate the number of competing gyms within 1 km, 3 km,
or 5 km.
| 1 km |
2.4 |
3.1 |
1.2 |
Medium |
| 2 km |
5.8 |
7.4 |
2.8 |
High |
| 3 km |
9.6 |
12.7 |
4.1 |
High |
| 5 km |
18.4 |
24.9 |
7.3 |
Very High |
Such analysis can be customized according to business requirements and geographic
market conditions.
How Businesses Can Use the Dataset
A structured gym location dataset can support several business functions:
- Expansion Planning: Identify potential geographic markets for new facilities.
- Competitive Research: Monitor competitor openings, closures, and geographic
expansion.
- Property Strategy: Evaluate locations before commercial property investments.
- Market Research: Understand gym concentration across cities and regions.
- Investment Analysis: Support fitness-sector due diligence.
- Dashboard Development: Track locations and competitive movements visually.
- Sales Planning: Identify businesses and markets for B2B outreach.
- Consumer Research: Study fitness availability across different catchment areas.
Automating Gym Market Monitoring
A one-time dataset provides a snapshot, but recurring collection can provide much
greater value. Fitness markets change continuously as new facilities launch, existing locations
close, and businesses modify their services.
Automated data pipelines can schedule recurring collection, compare new records
against historical data, and flag meaningful changes.
For example, a monthly monitoring system could identify:
- Newly opened gyms
- Closed facilities
- New competitors
- Address changes
- Rating changes
- Review growth
- Facility additions
- Opening-hour changes
- New sports retailers
- Geographic expansion
This transforms static location research into an ongoing market intelligence
program.
Data Quality and Compliance Considerations
High-quality market intelligence depends on reliable and consistently collected
information. Address normalization, duplicate detection, timestamping, source tracking, and
validation are important parts of a production-grade dataset.
Organizations should also design collection systems responsibly, respect applicable
website terms and access controls, and follow relevant privacy and data-protection requirements.
Business-location intelligence should prioritize appropriate public and commercially usable
information.
Conclusion
The UK fitness sector presents a geographically diverse landscape where gym
operators, investors, property teams, and market researchers need detailed location-level
information to understand competitive conditions and expansion opportunities. A structured
dataset can connect gym locations with ratings, facilities, geographic coordinates, competitor
proximity, sports businesses, and regional indicators.
Location intelligence can turn raw gym
addresses into actionable geographic insights for market mapping, competitive benchmarking, and
site-selection analysis.
A scalable scraping API can further automate
recurring collection and make standardized location records accessible to dashboards, analytics
systems, and business applications.
For organizations that need continuously refreshed datasets across multiple fitness
and sports sources, Managed web scraping can provide an
ongoing approach to collection, validation, monitoring, and structured data delivery.
Experience top-notch web scraping service
and mobile app scraping solutions with iWeb Data
Scraping. Our skilled team excels in extracting various data sets, including retail store locations and beyond. Connect with us
today to learn how our customized services can address your unique project needs, delivering the
highest efficiency and dependability for all your data requirements.