Introduction
Britain's grocery market is the most physically saturated corner of UK retail. Between them, Tesco, Sainsbury's, Asda, Morrisons and the Co-op operate well over ten thousand shopfronts, and on most high streets you are never more than a few minutes from at least two of them. That density is a triumph of distribution — and a growing problem. When two stores from rival chains, or even from the same chain, sit inside the same catchment, every new opening risks splitting demand rather than growing it.
This report maps the 2026 UK footprint of the country's leading grocers and turns raw store counts into something more useful: a view of where those networks overlap and cannibalize one another. It draws on iWebDataScraping's UK supermarket store location data — a fully geocoded dataset covering brand, address, postcode, store format and coordinates — and pairs the national picture with the catchment-overlap methodology that competitive-intelligence and site-selection teams rely on. Unlike a static store count, this is a decision-grade map of where the grocery market is already full, and where genuine white space still exists.
The UK grocery landscape in 2026
The shape of UK grocery in 2026 is defined by two forces pulling in opposite directions. At the top, the traditional 'Big Four' — Tesco, Sainsbury's, Asda and Morrisons — still command the largest share of spend, with Tesco alone holding roughly 28.5% of the grocery market at the start of 2025. Below them, the German discounters Aldi and Lidl continue to expand aggressively, opening in towns the majors had long treated as saturated and forcing a rethink of what 'full' really means.
Store networks have also fragmented by format. The big-box superstore that defined 1990s grocery has given way to a mix of full-size supermarkets, compact high-street convenience shops and franchised forecourt outlets. Tesco Express, Sainsbury's Local, Morrisons Daily and the Co-op's convenience estate now account for a large share of each brand's shopfronts. This matters for any overlap analysis: a Tesco Extra and a Tesco Express two streets apart serve very different missions, yet both appear as 'a Tesco' in a simple count. Reliable supermarket store location data has to capture format, not just brand, to separate genuine cannibalization from complementary coverage.
National footprint: the numbers
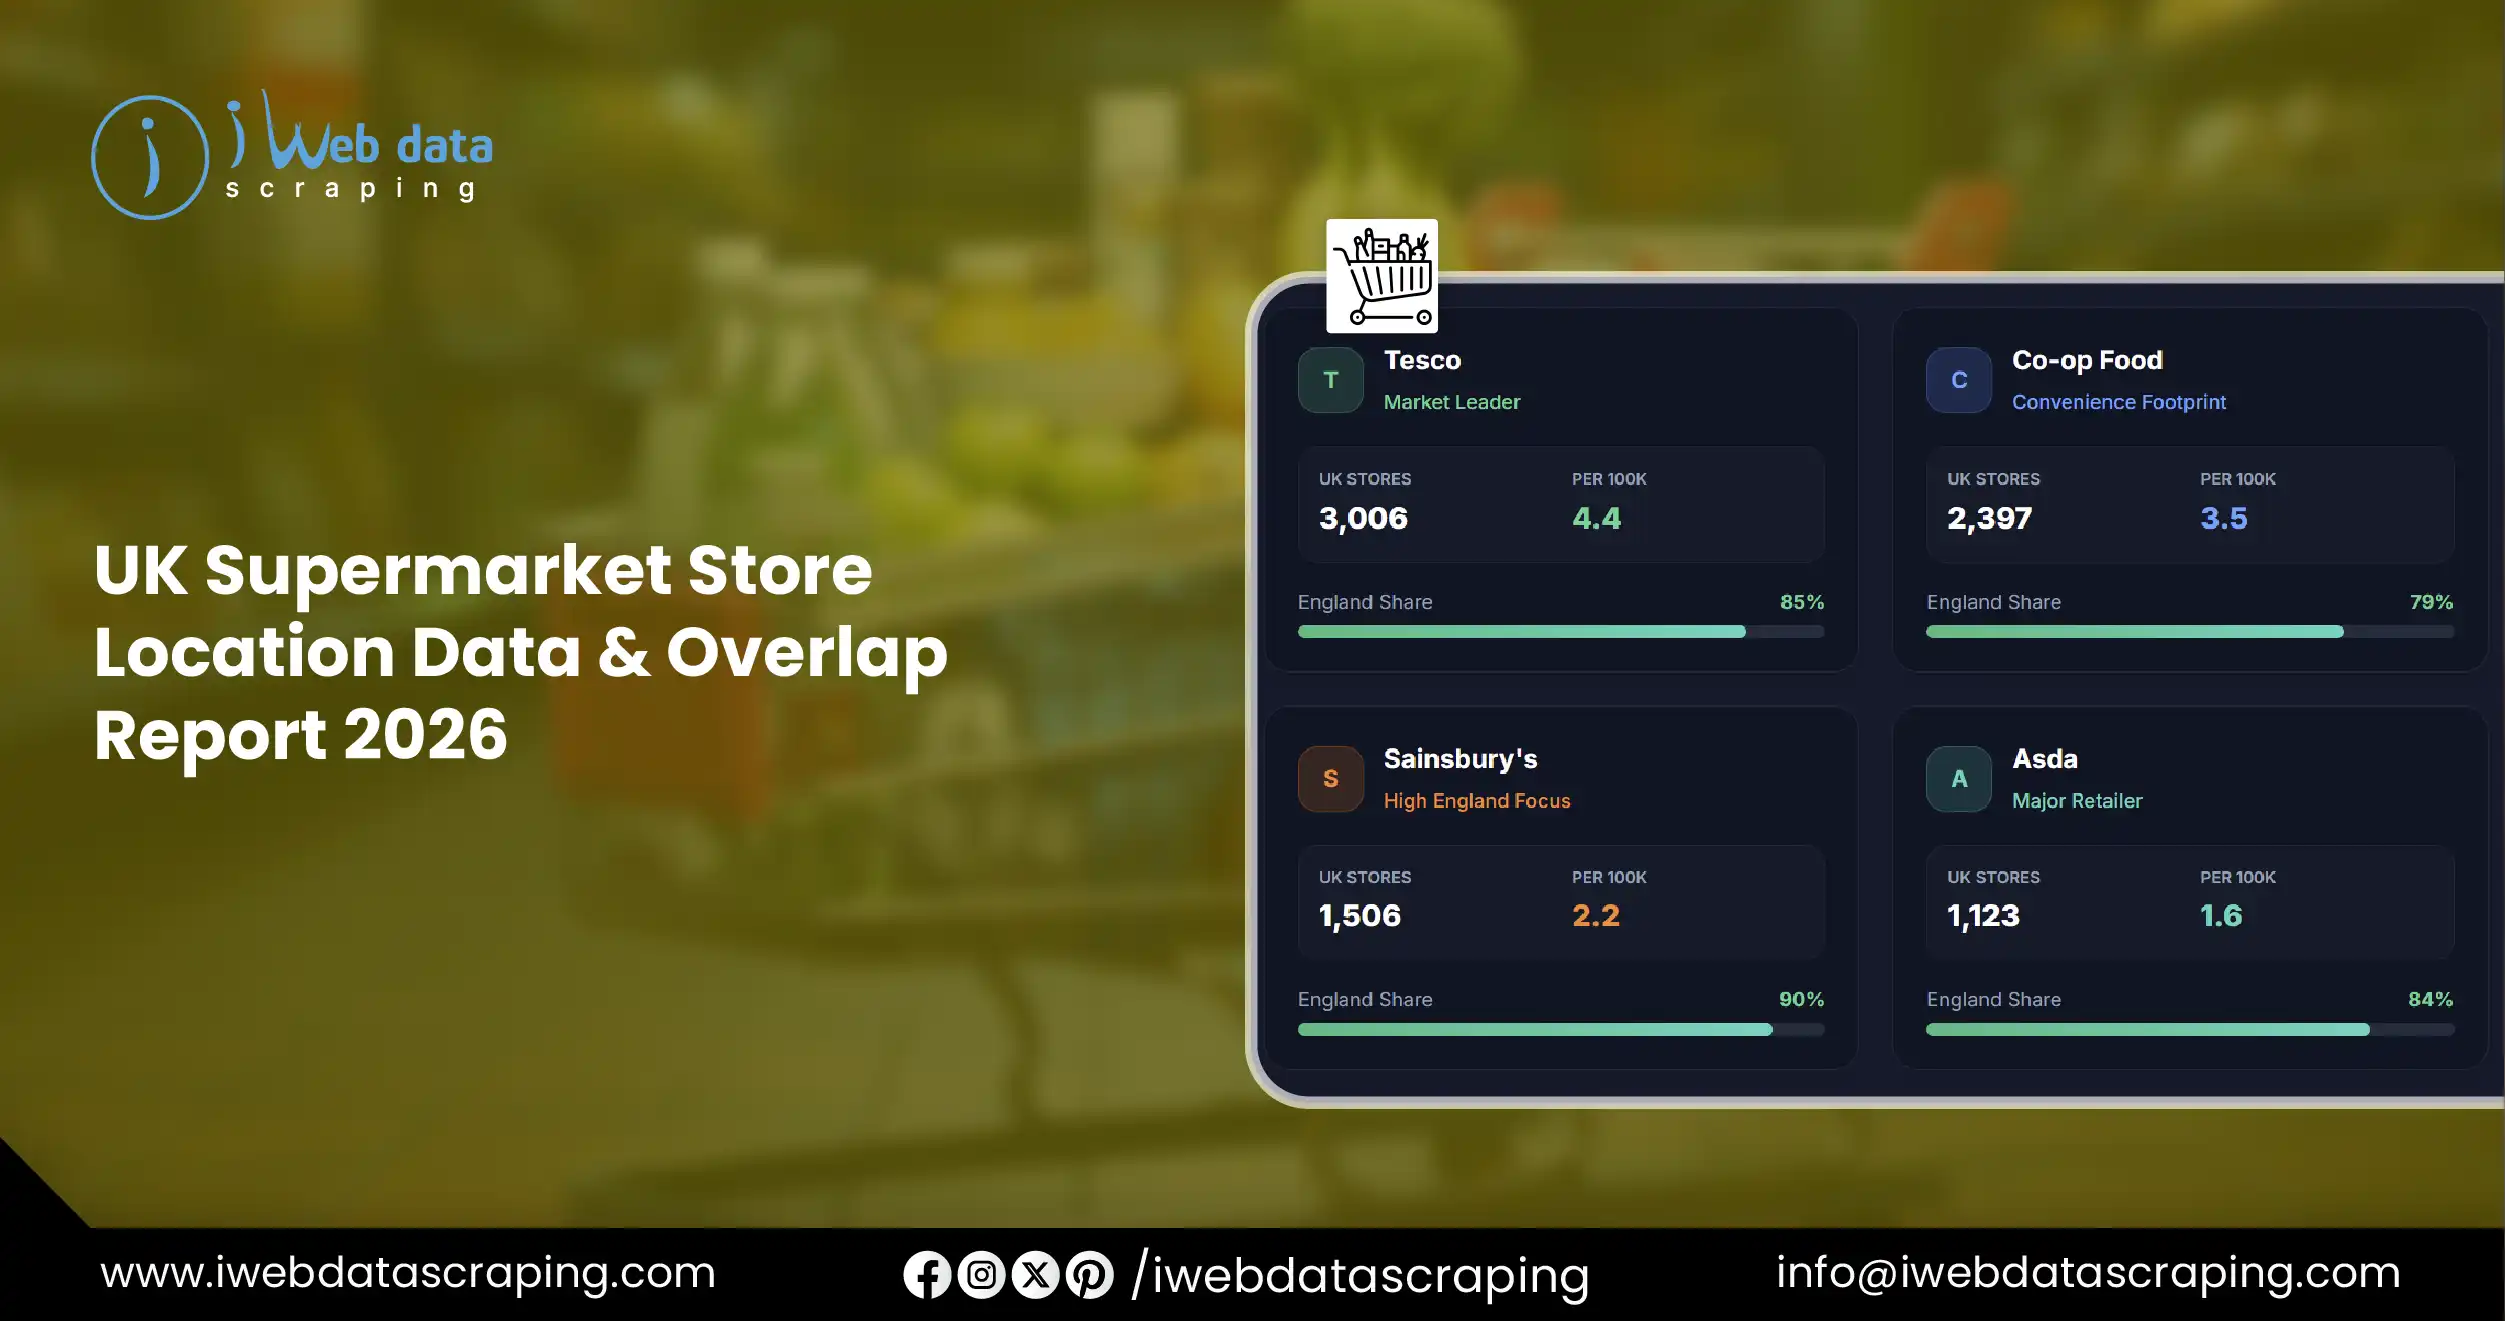
The table below sets the 2026 baseline. Store-per-100,000 figures are derived from national counts against a UK population of roughly 68.9 million — a like-for-like density measure a plain count can't provide.
| Tesco |
3,006 |
85% |
4.4 |
| Co-op Food |
2,397 |
79% |
3.5 |
| Morrisons |
1,865 |
81% |
2.7 |
| Sainsbury's |
1,506 |
90% |
2.2 |
| Asda |
1,123 |
84% |
1.6 |
Two things stand out. First, Tesco's lead is structural, not marginal: it operates roughly twice as many shopfronts as Sainsbury's and close to three times as many as Asda, which compounds its buying power and its promotional reach. Second, the Co-op — often overlooked in market-share tables because of its smaller average store — quietly runs the second-largest number of locations in the country, a convenience-led network that reaches deep into neighbourhoods the superstores skip. Anyone who scrapes supermarket store locations for competitive analysis and filters on brand share alone will miss that entirely.
A note on counting: totals vary between data providers because of format definitions. Tesco's UK figure ranges from around 3,000 core-banner shops to nearly 4,900 once every subsidiary and forecourt is included. Being explicit about what is and isn't in the count is itself a credibility edge over the count-only location reports that dominate search results.
Methodology: how overlap is measured
Store density tells you how much supply exists; catchment tells you whether that supply competes. iWebDataScraping models catchment as a radius or drive-time band that flexes by area type, because a one-mile circle means something completely different in central Birmingham than in rural Cumbria:
- Urban core — a 0.5–1.0 mile catchment. Overlap here is the norm, so the analytical question is severity, not presence.
- Suburban — a 1.5–3.0 mile catchment. This is the primary battleground where Big-Four overlap decides local market share.
- Rural — a 5.0-mile-plus catchment. These areas are typically served by a single brand and represent the clearest white space.
Against that model, every store in the geocoded dataset is tested for the presence of rival and own-brand stores inside its catchment. The output is three headline metrics — a Competitor Overlap Index, an Own-Brand Cannibalization Rate, and a count of contested postcodes. The inputs are simple and public (store coordinates and population), but the value comes from applying them consistently across the entire national estate rather than cherry-picking a single town.
Store density and catchment
Converting counts into density reveals patterns that market-share tables hide. Tesco's 4.4 stores per 100,000 people is more than double Asda's 1.6, but that gap narrows sharply once floorspace is considered: Asda's big-box model means fewer, larger stores with wider catchments, so its effective coverage is higher than store count alone suggests. Sainsbury's, at roughly one store per 41,000 people in England, sits in the middle — dense enough to compete in cities, thin enough to cede ground in smaller towns.
Regional concentration sharpens the picture. Because each major carries between 79% and 90% of its estate in England, overlap and cannibalization risk is overwhelmingly an English-market problem. Scotland, Wales and Northern Ireland show markedly lower density and, in many rural districts, single-brand dominance. For a retailer or investor, that regional skew is where the strategic questions live: crowded English suburbs are where cannibalization erodes returns, while the thinner devolved nations hold the last pockets of uncontested growth.
Overlap and cannibalization hotspots
This is where the analysis earns its keep. Applying the catchment model to the full estate produces three metrics a store count cannot:
- Competitor Overlap Index — the share of a brand's stores with at least one rival Big-Four store inside catchment.
- Own-Brand Cannibalization Rate — the share of a brand's stores with another of its own stores inside catchment.
- Contested Postcodes — postcode districts where three or more major grocers share a catchment.
The table below is an illustrative sample of the contested-postcode output. The figures are worked examples that show the shape of the analysis; in a live report they are replaced with values computed from the current dataset.
Sample / illustrative — contested-postcode analysis output
| M1 — Manchester |
Tesco, Sainsbury's, Asda, Co-op |
11 |
~3,900 |
| B1 — Birmingham |
Tesco, Sainsbury's, Morrisons |
8 |
~4,600 |
| LS1 — Leeds |
Tesco, Asda, Co-op |
7 |
~5,100 |
| G1 — Glasgow |
Tesco, Sainsbury's, Co-op |
6 |
~5,800 |
| BS1 — Bristol |
Tesco, Sainsbury's, Co-op |
5 |
~6,200 |
Read this as a heat map of risk. A district like M1, with four brands and eleven combined stores serving fewer than four thousand people per store, is effectively closed: a new entrant would almost certainly cannibalize rather than capture. By contrast, a suburban or semi-rural district with one brand and a large population per store is where a strategically placed opening still grows the market. Publishing the full ranked list of contested districts — with brands present, combined store count and population per store — is the single highest-engagement element of a report like this, because it hands analysts something they cannot assemble from a plain count.
Regional patterns and white space
Zoom out from the hotspots and a national pattern emerges. Overlap clusters tightly around the major conurbations — Greater London, the West Midlands, Greater Manchester, West Yorkshire and central Scotland — where decades of competitive expansion have left almost no un-contested ground. Between those cores lie corridors of thinner coverage: market towns, coastal districts and rural counties where a single brand, often Tesco or the Co-op, holds an effective local monopoly.
For expansion planning, those thin corridors are the prize. They combine adequate population with low competitive density — the two conditions under which a new store adds rather than divides sales. Identifying them at scale is impossible by eye; it requires geocoded UK grocery store location data cross-referenced with population, which is exactly the workflow this dataset is built to support. The same data flags the opposite signal too: over-served districts where a rival is exposed to cannibalization and therefore vulnerable to a well-timed promotion or format switch.
Sample data: what the dataset looks like
Every figure in this report traces back to a single underlying asset: a geocoded record for each store. When you scrape Tesco store locations — or any other grocer — the useful output is not a headline number but a clean, structured row per shopfront. The sample below shows the core fields in an iWebDataScraping supermarket store-location dataset (values are illustrative).
Sample / illustrative — dataset record structure
| Tesco |
Tesco Extra Manchester |
10 Cheetham Hill Rd |
M4 4FB |
Extra |
53.4934, -2.2361 |
| Sainsbury's |
Sainsbury's Local Leeds |
22 Briggate |
LS1 6HD |
Local |
53.7975, -1.5430 |
| Asda |
Asda Bristol Superstore |
1 Bedminster Rd |
BS3 5NF |
Superstore |
51.4408, -2.5975 |
| Morrisons |
Morrisons Daily Glasgow |
5 Argyle St |
G2 8AH |
Daily |
55.8600, -4.2570 |
| Co-op |
Co-op Food Cardiff |
8 Queen St |
CF10 2BX |
Convenience |
51.4816, -3.1763 |
Each record can be enriched with town, region, opening hours, phone number, in-store services (pharmacy, petrol, click-and-collect) and a last-verified date. Delivered as CSV, Excel or via API, this is the raw material for every downstream map, catchment model and overlap index in this report.
Who uses this data, and why
The buyers of supermarket store location data fall into four broad groups, each with a distinct question:
- Site-selection and property teams — screen out cannibalizing locations and prioritise genuine white space before committing capital to a new lease.
- Competitive-intelligence and strategy teams — quantify exactly where a rival is exposed to head-to-head overlap, informing pricing and promotion.
- FMCG brands and suppliers — align distribution, field-sales routing and promotional spend to true store density rather than headline counts.
- Investors and analysts — track network expansion, saturation and closure risk as an alternative-data signal on retailer performance.
What unites them is a need for data that is current, complete and geocoded. A count that is six months stale, or that silently mixes formats, leads to the wrong decision — which is why refresh cadence and clear methodology matter as much as raw coverage.
How iWebDataScraping builds it
Behind the report sits a straightforward pipeline. iWebDataScraping's store location data scraping process collects every shopfront from official store-locator sources, standardises and validates the address, geocodes it to latitude and longitude, tags the format, and cross-checks against secondary sources to catch closures and new openings. The result is a retail store location dataset refreshed on the client's schedule — weekly, monthly or quarterly — so the numbers never drift into the stale territory that undermines count-only competitors. The same pipeline extends to any UK retail category, from grocery to pharmacy to quick-service restaurants.
Conclusion
The UK grocery map looks finished, but the interesting questions all live beneath the surface count. Where do the giants overlap? Where does one more Tesco simply steal from the last one? And where, in the thinning corridors between the cities, does real growth still exist? Answering them takes more than a number — it takes complete, current, geocoded supermarket store location data and a consistent method for turning it into a map of risk and opportunity. That is what this report, and the dataset behind it, is built to deliver.
Experience top-notch web scraping service and mobile app scraping solutions with iWeb Data Scraping. Our skilled team excels in extracting various data sets, including retail store locations and beyond. Connect with us today to learn how our customized services can address your unique project needs, delivering the highest efficiency and dependability for all your data requirements.