Introduction
The US home improvement market in 2026 is shaped by changing construction costs, renovation demand, seasonal promotions, private-label products, and increasingly price-conscious consumers. From power tools and lumber to paint, plumbing supplies, lighting, storage, and garden equipment, shoppers compare multiple retailers before deciding where to purchase materials for residential projects. Home Depot, Lowe’s, Menards, and Walmart represent four distinct retail models, making their pricing strategies valuable benchmarks for understanding competition across the American home improvement landscape.
The US home improvement price index provides a structured framework for evaluating how product prices differ across retailers, categories, locations, and promotional periods. Rather than measuring a single store’s overall affordability, a useful index compares equivalent products using consistent specifications, quantities, and availability criteria.
Through Home Depot data scraping, analysts can collect product prices, model numbers, package sizes, discounts, and stock information. A Lowe’s price scraper can capture comparable listings, promotional offers, and regional pricing differences, while Menards product data extraction helps extend the analysis to another major home improvement retailer. Together, these datasets can support more consistent benchmarking across participating retailers.
For this report, the index is treated as a research framework for 2026, not as an officially published national statistic. The numerical tables below use illustrative research values to demonstrate how an index and retailer comparison can be structured. They are not verified live prices or measured market averages.
1. Understanding the US Home Improvement Price Index
A home improvement price index tracks the movement of a representative basket of products over time. The basket might include a cordless drill, interior paint, lumber, electrical components, plumbing fixtures, fasteners, and common renovation materials.
A well-designed index establishes a baseline period, assigns weights to product categories, and measures subsequent price changes. For example, if the baseline index is 100 and a comparable basket rises to 104, its weighted cost has increased by 4% relative to the baseline.
Retailers must be compared on a like-for-like basis. A 20-volt cordless drill sold with two batteries should not be compared directly with a tool-only version. Similarly, lumber prices require consistent dimensions, grade, treatment, and quantity.
The most useful index therefore combines several indicators:
- Price movement: Changes in comparable product prices over time.
- Promotional intensity: Discounts, coupons, clearance offers, and temporary markdowns.
- Product availability: In-stock status and delivery or pickup eligibility.
- Regional variation: Differences across ZIP codes and store markets.
- Value consistency: Price differences adjusted for size, quantity, and specifications.
2. Four Major Retailers and Their Competitive Positions
The Home Depot
Home Depot is a major destination for contractors, property maintenance teams, and do-it-yourself customers. Its extensive building-material, tool, appliance, and installation-related assortment makes it an important benchmark for project-based purchasing.
Lowe's
Lowe’s competes across renovation supplies, appliances, tools, paint, flooring, and outdoor products. Comparing its listings with Home Depot can help reveal category-specific price differences and promotional positioning.
Menards
Menards offers a broad assortment of building materials, hardware, home goods, and seasonal merchandise. Its regional footprint and promotional offers make it useful for studying localized competition and project-basket affordability.
Walmart
Walmart provides a broad general-merchandise assortment, including selected tools, hardware, lighting, paint accessories, storage products, and basic maintenance supplies. Its role is especially relevant for everyday essentials rather than every specialized construction category.
The comparison should reflect differences in assortment and retail strategy. A missing product does not necessarily mean a retailer is more expensive; it may simply have a different product range. Consequently, analysts should report product coverage alongside the index.
3. Market Conditions Influencing Home Improvement Prices in 2026
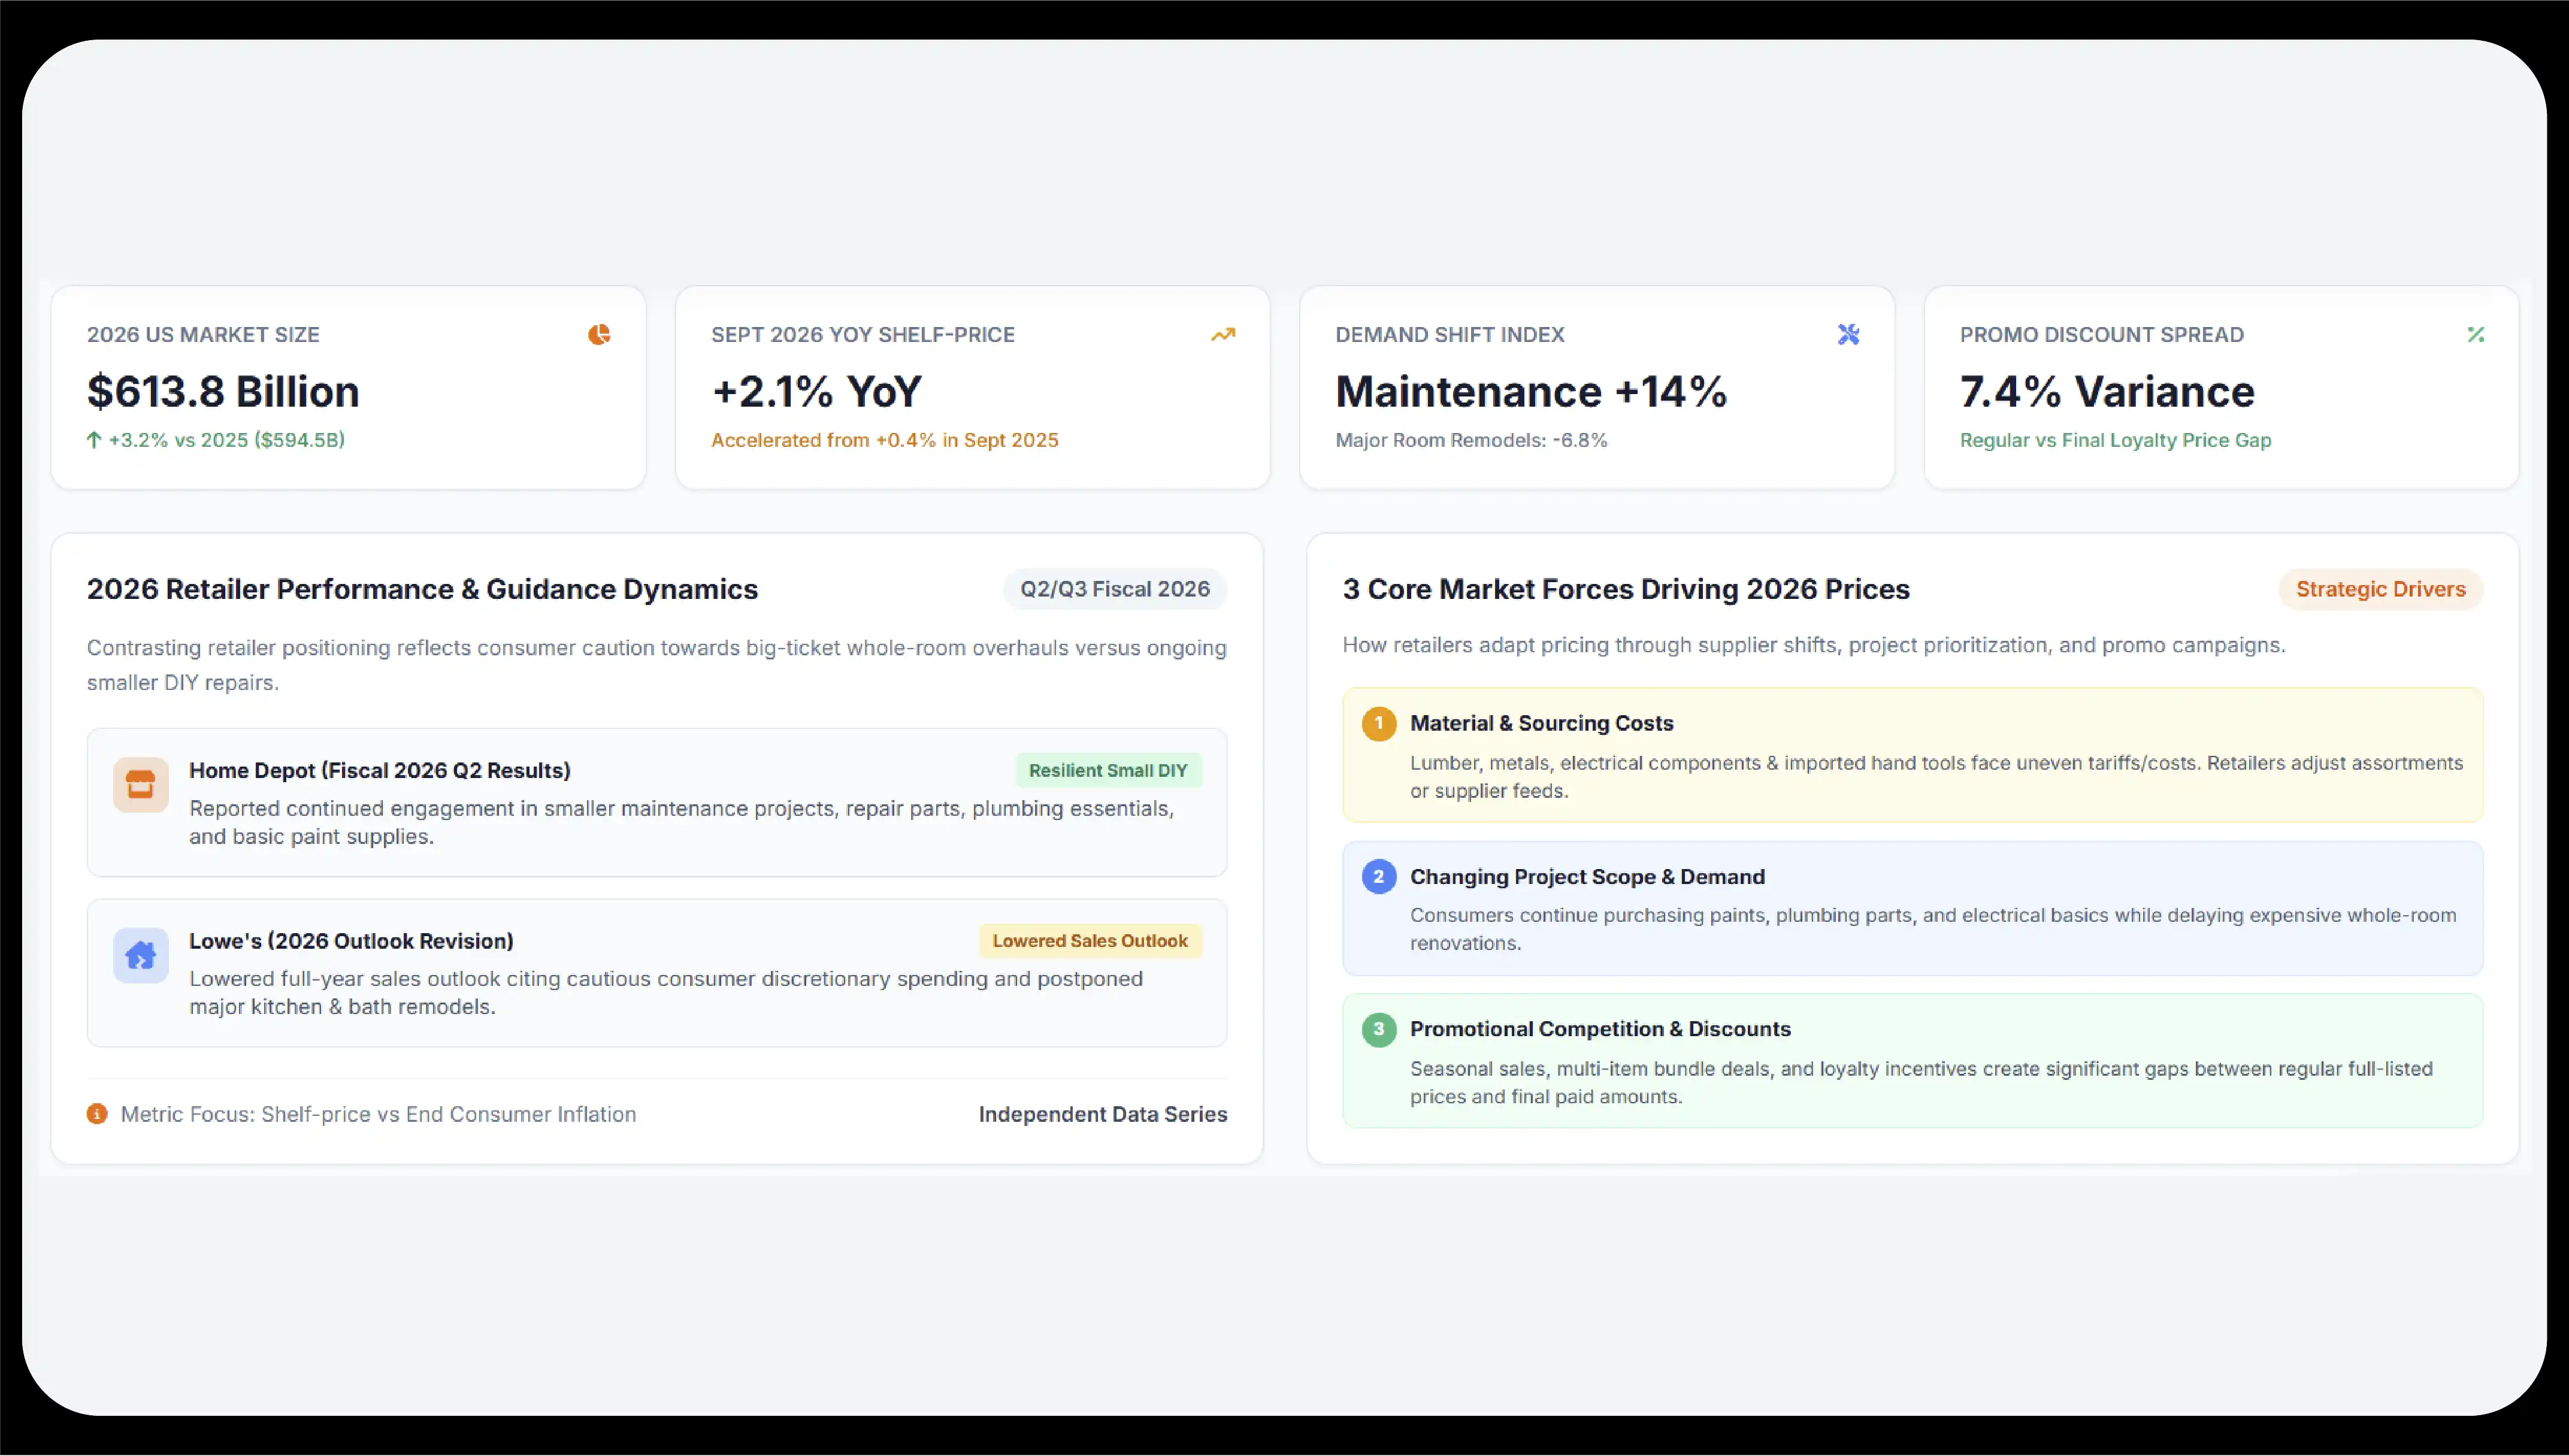
The market outlook reflects a combination of renovation demand, affordability pressures, product sourcing costs, and retailer competition. Grand View Research estimates the US home improvement market at $613.8 billion in 2026, following an estimated $594.5 billion in 2025. Its forecast reflects continued demand for repairs, remodeling, and property upgrades.
An independent online shelf-price series also reported that prices of matched home improvement products were 2.1% higher year over year in September 2026, compared with 0.4% in September 2025. This measures full listed prices across the provider’s covered online retailers, not the four retailers’ combined average or a complete measure of consumer inflation.
Three market forces deserve particular attention.
- Material and sourcing costs: Lumber, metals, electrical components, imported tools, and other building supplies can experience different cost pressures. Retailers may respond through selective price adjustments, alternative suppliers, assortment changes, or promotions.
- Changing project demand: Consumers may continue buying paint, repair parts, plumbing essentials, and maintenance supplies while postponing expensive kitchen, bathroom, or whole-room renovations. Lowe’s lowered its 2026 sales outlook amid cautious consumer spending and weaker demand for larger DIY projects, while Home Depot reported continued engagement in smaller projects in its second-quarter fiscal 2026 results.
- Promotional competition: Retailers compete through seasonal sales, multi-item offers, loyalty benefits, and selected category discounts. A product’s regular price may therefore tell a different story from the amount a customer ultimately pays.
4. Table One — Illustrative Retailer Price Index by Product Category
The following table demonstrates how a weighted index can compare the four retailers. The values are illustrative, not observed 2026 retailer prices. The base index is 100, with Home Depot used as the reference for each category. A value below 100 indicates a lower hypothetical price for the matched basket; a value above 100 indicates a higher one.
| Power tools |
15 |
100 |
98 |
96 |
94 |
| Lumber and timber |
18 |
100 |
102 |
97 |
N/A |
| Paint and coatings |
12 |
100 |
99 |
96 |
98 |
| Plumbing supplies |
10 |
100 |
101 |
97 |
95 |
| Electrical supplies |
10 |
100 |
98 |
97 |
96 |
| Fasteners and hardware |
10 |
100 |
97 |
95 |
93 |
| Lighting products |
8 |
100 |
99 |
98 |
95 |
| Storage and organization |
7 |
100 |
101 |
96 |
92 |
| Garden and outdoor supplies |
10 |
100 |
102 |
98 |
97 |
| Total basket weight |
100 |
100 |
— |
— |
— |
Methodological note: N/A means the hypothetical basket does not contain a sufficiently comparable Walmart item. It must not be treated as a zero price or automatically assigned the cheapest score.
To calculate an overall retailer index, multiply each category index by its weight and divide the sum by the total weight of categories with valid comparable data. The weights should then be normalized consistently across retailers or the comparison should explicitly disclose differences in coverage.
For instance, if power tools account for 15% of a basket and the hypothetical index is 96, that category contributes 14.4 weighted index points. This allows analysts to assess whether a retailer’s apparent price advantage is concentrated in a few products or distributed across the assortment.
The table also illustrates why Walmart should not automatically be ranked against the specialist chains on every category. Its assortment may cover common household tools and accessories but lack equivalent options for certain lumber dimensions, contractor-grade supplies, or specialized construction materials.
5. Table Two — Illustrative Product-Level Price and Promotion Comparison
The next table demonstrates a practical SKU-level comparison model. Prices are hypothetical US dollars, selected to show how product matching, discount calculations, and unit pricing can work. They are not current quotations from retailer websites.
| 20V cordless drill kit, equivalent configuration |
129.00 |
124.00 |
119.00 |
109.00 |
Walmart |
| Interior paint, 1 gallon, comparable finish |
38.98 |
39.98 |
35.98 |
32.97 |
Walmart |
| Construction lumber, 2 × 4 × 8 ft, matching grade |
4.25 |
4.35 |
4.05 |
N/A |
Menards |
| LED bulb, 4-pack, equivalent brightness |
12.98 |
11.98 |
10.98 |
9.97 |
Walmart |
| Standard faucet, equivalent specification |
79.00 |
74.00 |
69.00 |
59.00 |
Walmart |
| Electrical outlet, single unit, matching rating |
2.48 |
2.38 |
2.18 |
1.97 |
Walmart |
| Interior door handle, equivalent finish |
24.98 |
22.98 |
21.98 |
19.97 |
Walmart |
| Deck screws, 1 lb, matching type and finish |
8.98 |
8.48 |
7.98 |
7.47 |
Walmart |
| Storage tote, 27-gallon equivalent capacity |
12.98 |
13.98 |
11.98 |
10.97 |
Walmart |
| Garden hose, 50 ft, equivalent construction |
34.98 |
32.98 |
29.98 |
27.97 |
Walmart |
These examples demonstrate how a product-level database can identify potential price gaps. However, the lowest listed price is not necessarily the lowest total purchase cost. Shipping fees, delivery thresholds, store availability, taxes, bundle contents, warranties, and product quality may change the final decision.
For larger purchases, analysts should also calculate project-level totals. A contractor buying 40 lumber boards, 12 gallons of paint, 200 fasteners, and multiple electrical components needs an accurate basket cost rather than a ranking based on one inexpensive item.
Menards product data extraction can help capture comparable specifications, promotional conditions, and package quantities. Combining those records with the other retailers’ product feeds makes it possible to compare normalized prices, detect outliers, and flag changes that may affect project budgets.
6. How Home Improvement Pricing Intelligence Supports Retail Decisions?
Effective home improvement pricing intelligence goes beyond collecting individual product prices. It combines structured product attributes, price histories, promotional data, availability records, and location-level observations into a consistent decision-making framework.
Product matching and normalization
Retailers often describe equivalent products differently. A drill may be listed by voltage, battery count, included accessories, and model number. A paint listing may specify coverage, finish, color, and container size. A robust matching process identifies equivalent products before calculating price differences.
Promotion and discount analysis
A regular price of $100 discounted to $80 represents a 20% markdown. However, analysts should distinguish temporary promotions from permanent reductions and compare the same promotional conditions across retailers. Coupon eligibility, membership requirements, and multibuy offers should be recorded separately.
Regional price intelligence
Prices and availability may vary by store, ZIP code, fulfillment method, and delivery distance. Location-level data helps retailers understand where competitors are offering better value and where local assortment differences influence purchasing decisions.
Monitoring availability alongside price
A low-priced product that is unavailable for immediate pickup may not be a practical alternative for a contractor. Monitoring inventory status, estimated delivery dates, and pickup eligibility alongside price produces a more useful comparison.
Building a repeatable index
A reliable US home improvement price index should use a defined product basket, stable category weights, consistent observation intervals, and documented rules for missing or discontinued products. Separate regular-price and promotional-price indices can help distinguish underlying price movements from short-term discounting.
Retailers should also maintain historical snapshots so that analysts can identify unusual price changes, measure promotional effectiveness, and evaluate whether pricing decisions are improving competitiveness.
7. Conclusion
The US home improvement market in 2026 requires a more detailed understanding of prices than a simple comparison of advertised offers. Home Depot, Lowe’s, Menards, and Walmart serve overlapping but distinct customer needs, and the most competitive retailer may differ by product category, location, project size, and purchase timing.
A structured monitoring program should combine Walmart price scraping with comparable data from specialist home improvement retailers to assess common products, discounts, availability, and regional differences. For businesses conducting US retail price monitoring 2026, consistent product matching and historical records can reveal price movements, competitive gaps, and opportunities to improve purchasing decisions.
Ultimately, effective hardware retail price comparison depends on more than identifying the lowest displayed number. Accurate specifications, comparable package sizes, promotion rules, and fulfillment costs are essential for trustworthy results. With transparent methodology and validated retailer data, businesses can turn product-level observations into actionable pricing benchmarks and more informed market strategies.
Experience top-notch web scraping service and mobile app scraping solutions with iWeb Data Scraping. Our skilled team excels in extracting various data sets, including retail store locations and beyond. Connect with us today to learn how our customized services can address your unique project needs, delivering the highest efficiency and dependability for all your data requirements.