
41.7K+
TOTAL RETAIL REVIEWS ANALYZED

Google Maps Reviews Data Scraping for Retail Stores to Improve Customer Experience and Strengthen Brand Reputation Across India.
This case study explores how a retail intelligence organization can transform customer feedback from Google Maps listings into structured business intelligence. By systematically collecting publicly accessible review information, ratings, review dates, and relevant store details, the organization can understand customer experiences across retail locations and identify operational improvements. The case focuses on a scalable approach to retail reputation analytics across India's diverse markets, from metropolitan shopping destinations to regional outlets and emerging urban centers.
The case study is designed for:
The initiative demonstrates how Google Maps Reviews Data Scraping for Retail Stores can help retail organizations convert dispersed customer opinions into standardized datasets that support measurable, evidence-based decisions.
It also illustrates how All-India retail store review data can support comparisons across geographic markets, store formats, and customer experience indicators without depending exclusively on isolated surveys or manual review collection.
For retail groups with extensive physical footprints, Google Maps reviews scraping for retail chains provides a framework for consolidating location-specific feedback and identifying differences between individual outlets, regional clusters, and the wider brand experience.
The central objective is to establish a reliable intelligence layer that helps retailers understand what customers appreciate, where service expectations are not being met, and which improvements should receive priority.
Google Maps reviews provide retailers with valuable public feedback about shopping experiences, store accessibility, staff interactions, product availability, billing processes, cleanliness, and overall customer satisfaction. However, extracting meaningful insights from hundreds or thousands of store listings requires systematic collection, data normalization, and consistent analytical methods.
In this illustrative case study, an enterprise retail analytics team implemented a structured framework for collecting publicly available review information across selected Indian retail locations. The pipeline organized review text, star ratings, timestamps, store identifiers, and location attributes into a unified dataset suitable for analysis and reporting.
Using Store-level ratings and sentiment analysis, the team could compare customer experiences across individual outlets and identify recurring themes behind positive and negative feedback.
The framework supported Multi-location retail reputation monitoring, enabling stakeholders to examine rating movements, emerging complaints, and variations in customer satisfaction across store networks.
Through India retail brand review benchmarking, the organization could compare participating brands and locations using consistent indicators rather than relying on disconnected reports or anecdotal observations.
Automated data cleaning reduced duplication, standardized location information, and improved the consistency of review records. Sentiment classification and topic extraction helped categorize feedback into operational themes, including staff behavior, product selection, store cleanliness, waiting times, pricing transparency, and service responsiveness.
Dashboards presented findings through location comparisons, sentiment distributions, review-volume trends, and recurring customer concerns. Store managers could investigate specific issues, while regional teams could identify patterns affecting multiple outlets.
The client was a retail intelligence and analytics organization supporting businesses operating across India's competitive physical retail landscape. Its objective was to understand customer perceptions across numerous store locations while providing decision-makers with consistent, timely, and comparable information.
Retailers frequently receive reviews at different times and across listings with varying levels of activity. Without a standardized collection framework, comparing customer experiences across cities, brands, and individual outlets becomes difficult.
The client encountered several challenges:
Fragmented Review Collection: Manual inspection of individual Google Maps listings made it difficult to consolidate feedback across large store networks. Analysts needed a repeatable method to gather eligible public information while maintaining consistent records.
Inconsistent Location Records: Store names, addresses, categories, and listing details varied across locations. Duplicate or ambiguous records created difficulties when associating reviews with the correct outlet and geographic market.
Competitive Benchmarking Difficulties: Comparing brands across different cities required consistent definitions, review periods, location matching, and analytical methods. Unstructured data made fair comparisons challenging.
To address these issues, the client required a scalable Google Maps Reviews Data Scraper capable of organizing review records into a consistent analytical structure.
The organization also needed an India Retail Brand Reputation Index to compare rating distributions, sentiment patterns, review activity, and customer experience indicators across participating retail brands.
Finally, it required a standardized Google Maps Review Intelligence Report to communicate findings through clear dashboards, comparable metrics, geographic summaries, and operational recommendations.
The client also struggled to answer several operational questions:
By replacing disconnected manual collection with an automated, quality-controlled pipeline, the client established a consistent process for reviewing public feedback across multiple retail locations. The framework improved data organization and enabled repeatable analysis across stores, cities, and brands.
| Dimension | Manual Review Tracking | Structured Data Scraping System |
|---|---|---|
| Data collection | Individual listings checked manually | Automated collection from eligible, accessible sources |
| Geographic coverage | Limited to selected outlets | Expandable coverage across defined store networks |
| Data structure | Separate spreadsheets and notes | Standardized records with store and review identifiers |
| Rating analysis | Occasional manual comparisons | Consistent rating distributions and location-level summaries |
| Sentiment analysis | Subjective reading of selected reviews | Categorized sentiment with quality checks |
| Trend identification | Problems identified during periodic reviews | Scheduled monitoring of changes and recurring themes |
| Competitive benchmarking | Inconsistent comparison criteria | Shared metrics and standardized reporting periods |
| Reporting | Manually assembled summaries | Repeatable dashboards and analytical reports |
| Operational response | Reactive investigation | Prioritized investigation based on recurring issues |
The structured approach does not eliminate the need for human judgment. Instead, it allows analysts to spend less time assembling records and more time interpreting customer feedback, validating unusual findings, and recommending practical improvements.
The brand in focus is a retail intelligence organization working with businesses that operate physical stores across multiple Indian markets. Its analytical priorities include customer satisfaction, local reputation, service quality, store-level performance, and competitive positioning.
As retail networks expand, customer experiences can vary considerably between locations. An outlet in a high-footfall metropolitan shopping district may face different challenges from a neighborhood store or a branch serving a smaller regional market. Differences in staffing, inventory, accessibility, store layout, and service procedures can influence how customers describe their experiences.
The organization needed a consolidated view of these differences without treating every store as identical. It also needed to distinguish isolated negative reviews from recurring patterns that might indicate a broader operational problem.
The proposed intelligence framework linked review records with standardized store identifiers and geographic attributes. It then combined rating analysis, sentiment classification, topic extraction, and review-frequency monitoring to generate comparable insights.
We designed an end-to-end workflow to transform eligible public Google Maps review information into standardized retail intelligence. The process combined source discovery, location matching, data extraction, quality validation, sentiment analysis, and reporting.
Step 1 — Store Discovery and Location Mapping
The first stage identified target retail brands, store categories, and geographic coverage. Each eligible listing was mapped to a standardized store record using available identifiers, business names, addresses, and location attributes. Ambiguous matches were flagged for review rather than automatically merged.
Step 2 — Structured Review Collection
The collection layer captured permitted review fields and relevant listing information from accessible sources, subject to applicable platform terms, access restrictions, and data-use requirements. Collection schedules and available review history depended on the selected access method.
Step 3 — Data Cleaning and Validation
Raw records were checked for missing values, inconsistent timestamps, duplicate entries, malformed text, and incorrect store associations. Standardized fields made it easier to compare locations and maintain reliable reporting periods.
Step 4 — Sentiment and Topic Classification
Review text was categorized into positive, neutral, or negative sentiment where the language and context supported classification. Topic extraction identified themes such as staff behavior, cleanliness, product availability, billing, parking, accessibility, and service speed. Ambiguous or mixed-sentiment reviews were flagged for additional validation.
Step 5 — Dashboard Development and Benchmarking
The final stage presented rating distributions, sentiment patterns, review volumes, geographic comparisons, and recurring customer concerns. Stakeholders could examine individual locations, compare regional performance, and prioritize operational investigations.
The solution also incorporated Retail Data Intelligence Services to organize store information into a reusable analytical framework. Automated validation and normalization improved consistency across records and supported comparable reporting.
The final analytical layer enabled Customer Experience Analytics Solutions to translate review language into operational themes. This helped teams distinguish feedback about staff interactions from concerns involving inventory, cleanliness, accessibility, and checkout experiences.
Through scheduled collection and quality-controlled processing, Retail Review Data Extraction Services supported repeatable reporting and trend monitoring, subject to source availability and permitted access.
A typical normalized record contained:
After collection, the raw records passed through several processing stages.
Store Normalization: Store names and identifiers were standardized so that equivalent locations could be mapped consistently across listings.
For example, variations in store naming, address formats, and location descriptions were normalized to reduce duplicate records.
Topic Normalization: Review themes were standardized to ensure that comparable feedback could be analyzed consistently across stores and regions.
Sentiment Classification: The system categorized observations into states such as positive, neutral, negative, or mixed, depending on the data returned during collection.
Duplicate Removal: Repeated records generated during overlapping collection cycles were identified and handled using store, review, and timestamp combinations.
Historical Storage: Each observation was timestamped, enabling the client to calculate rating movements and sentiment changes over time.
Alert Prioritization: The analytics layer identified high-priority situations, including stores showing significant rating declines or repeated negative themes across regions.
The final dataset was connected to dashboards where analysts could filter information by store, city, region, sentiment, topic, and time period.
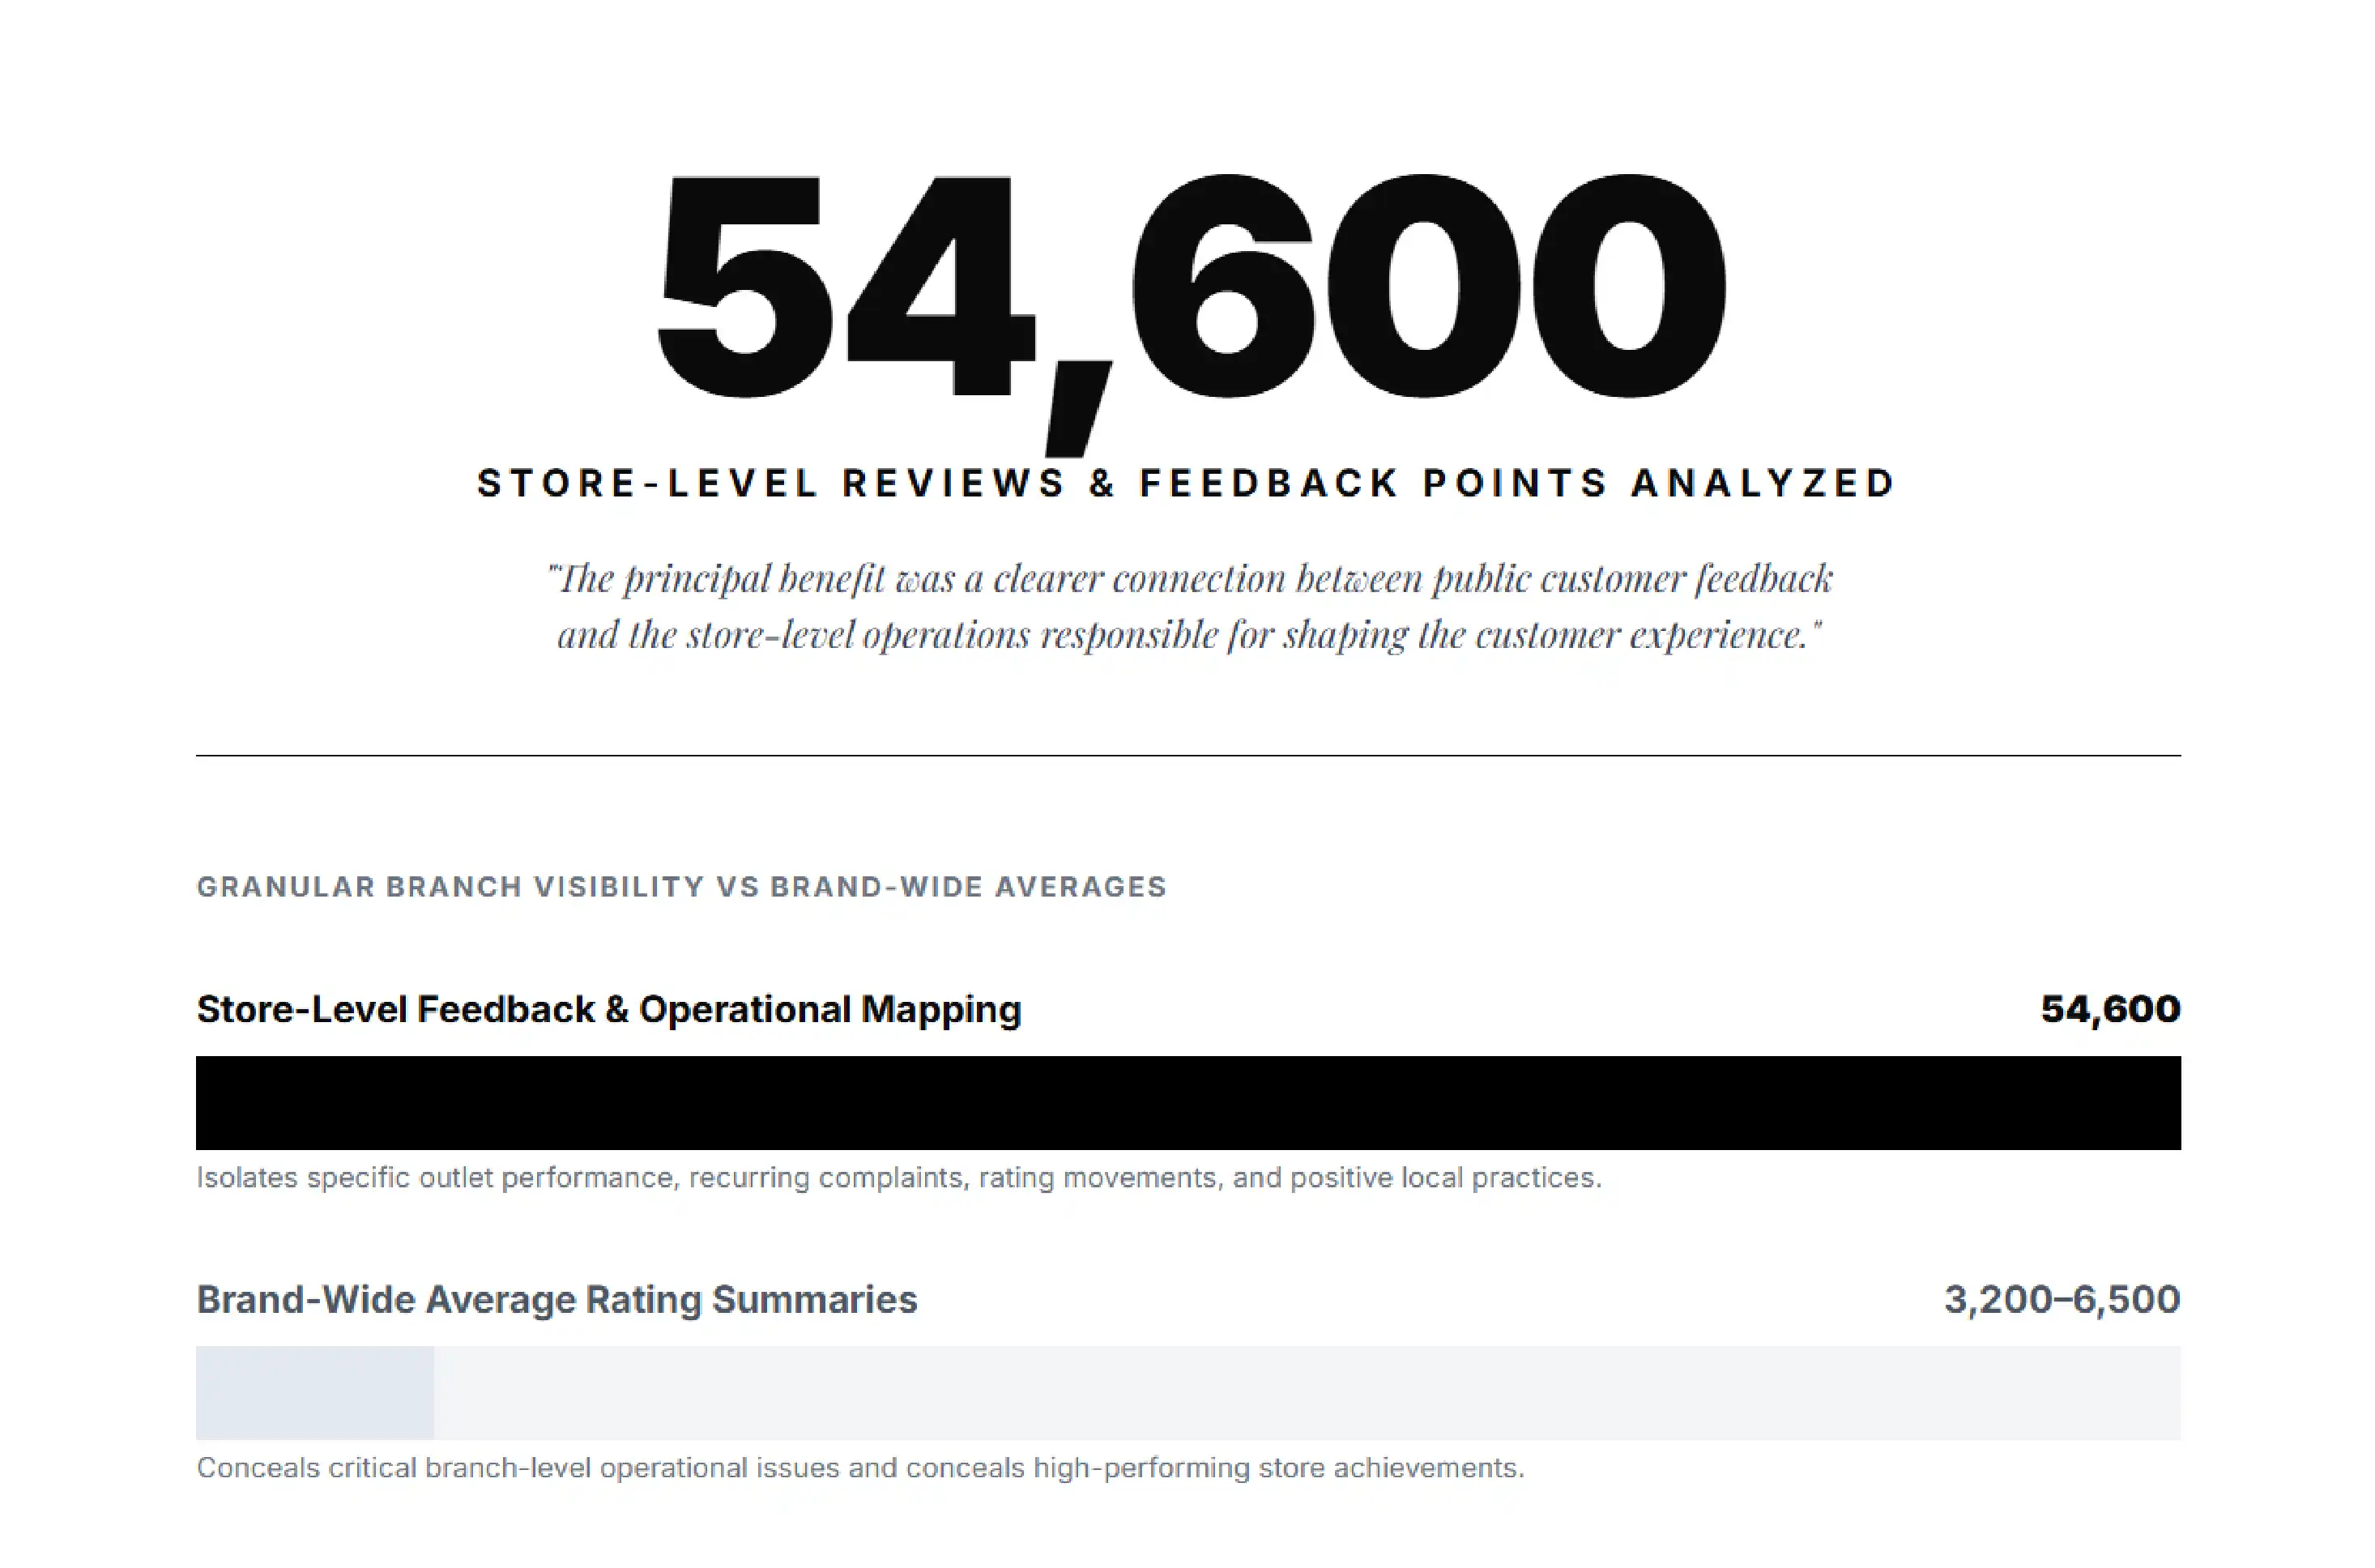
The consolidated dataset enabled the client to compare customer feedback across individual outlets instead of relying solely on brand-wide average ratings. This revealed how experiences could differ between locations, even within the same retail chain.
Store managers could examine recurring complaints, investigate unusual rating movements, and identify positive practices worth sharing across the network. Regional leaders could also distinguish isolated incidents from issues affecting multiple branches.
The principal benefit was a clearer connection between public customer feedback and the store-level operations responsible for shaping the customer experience.
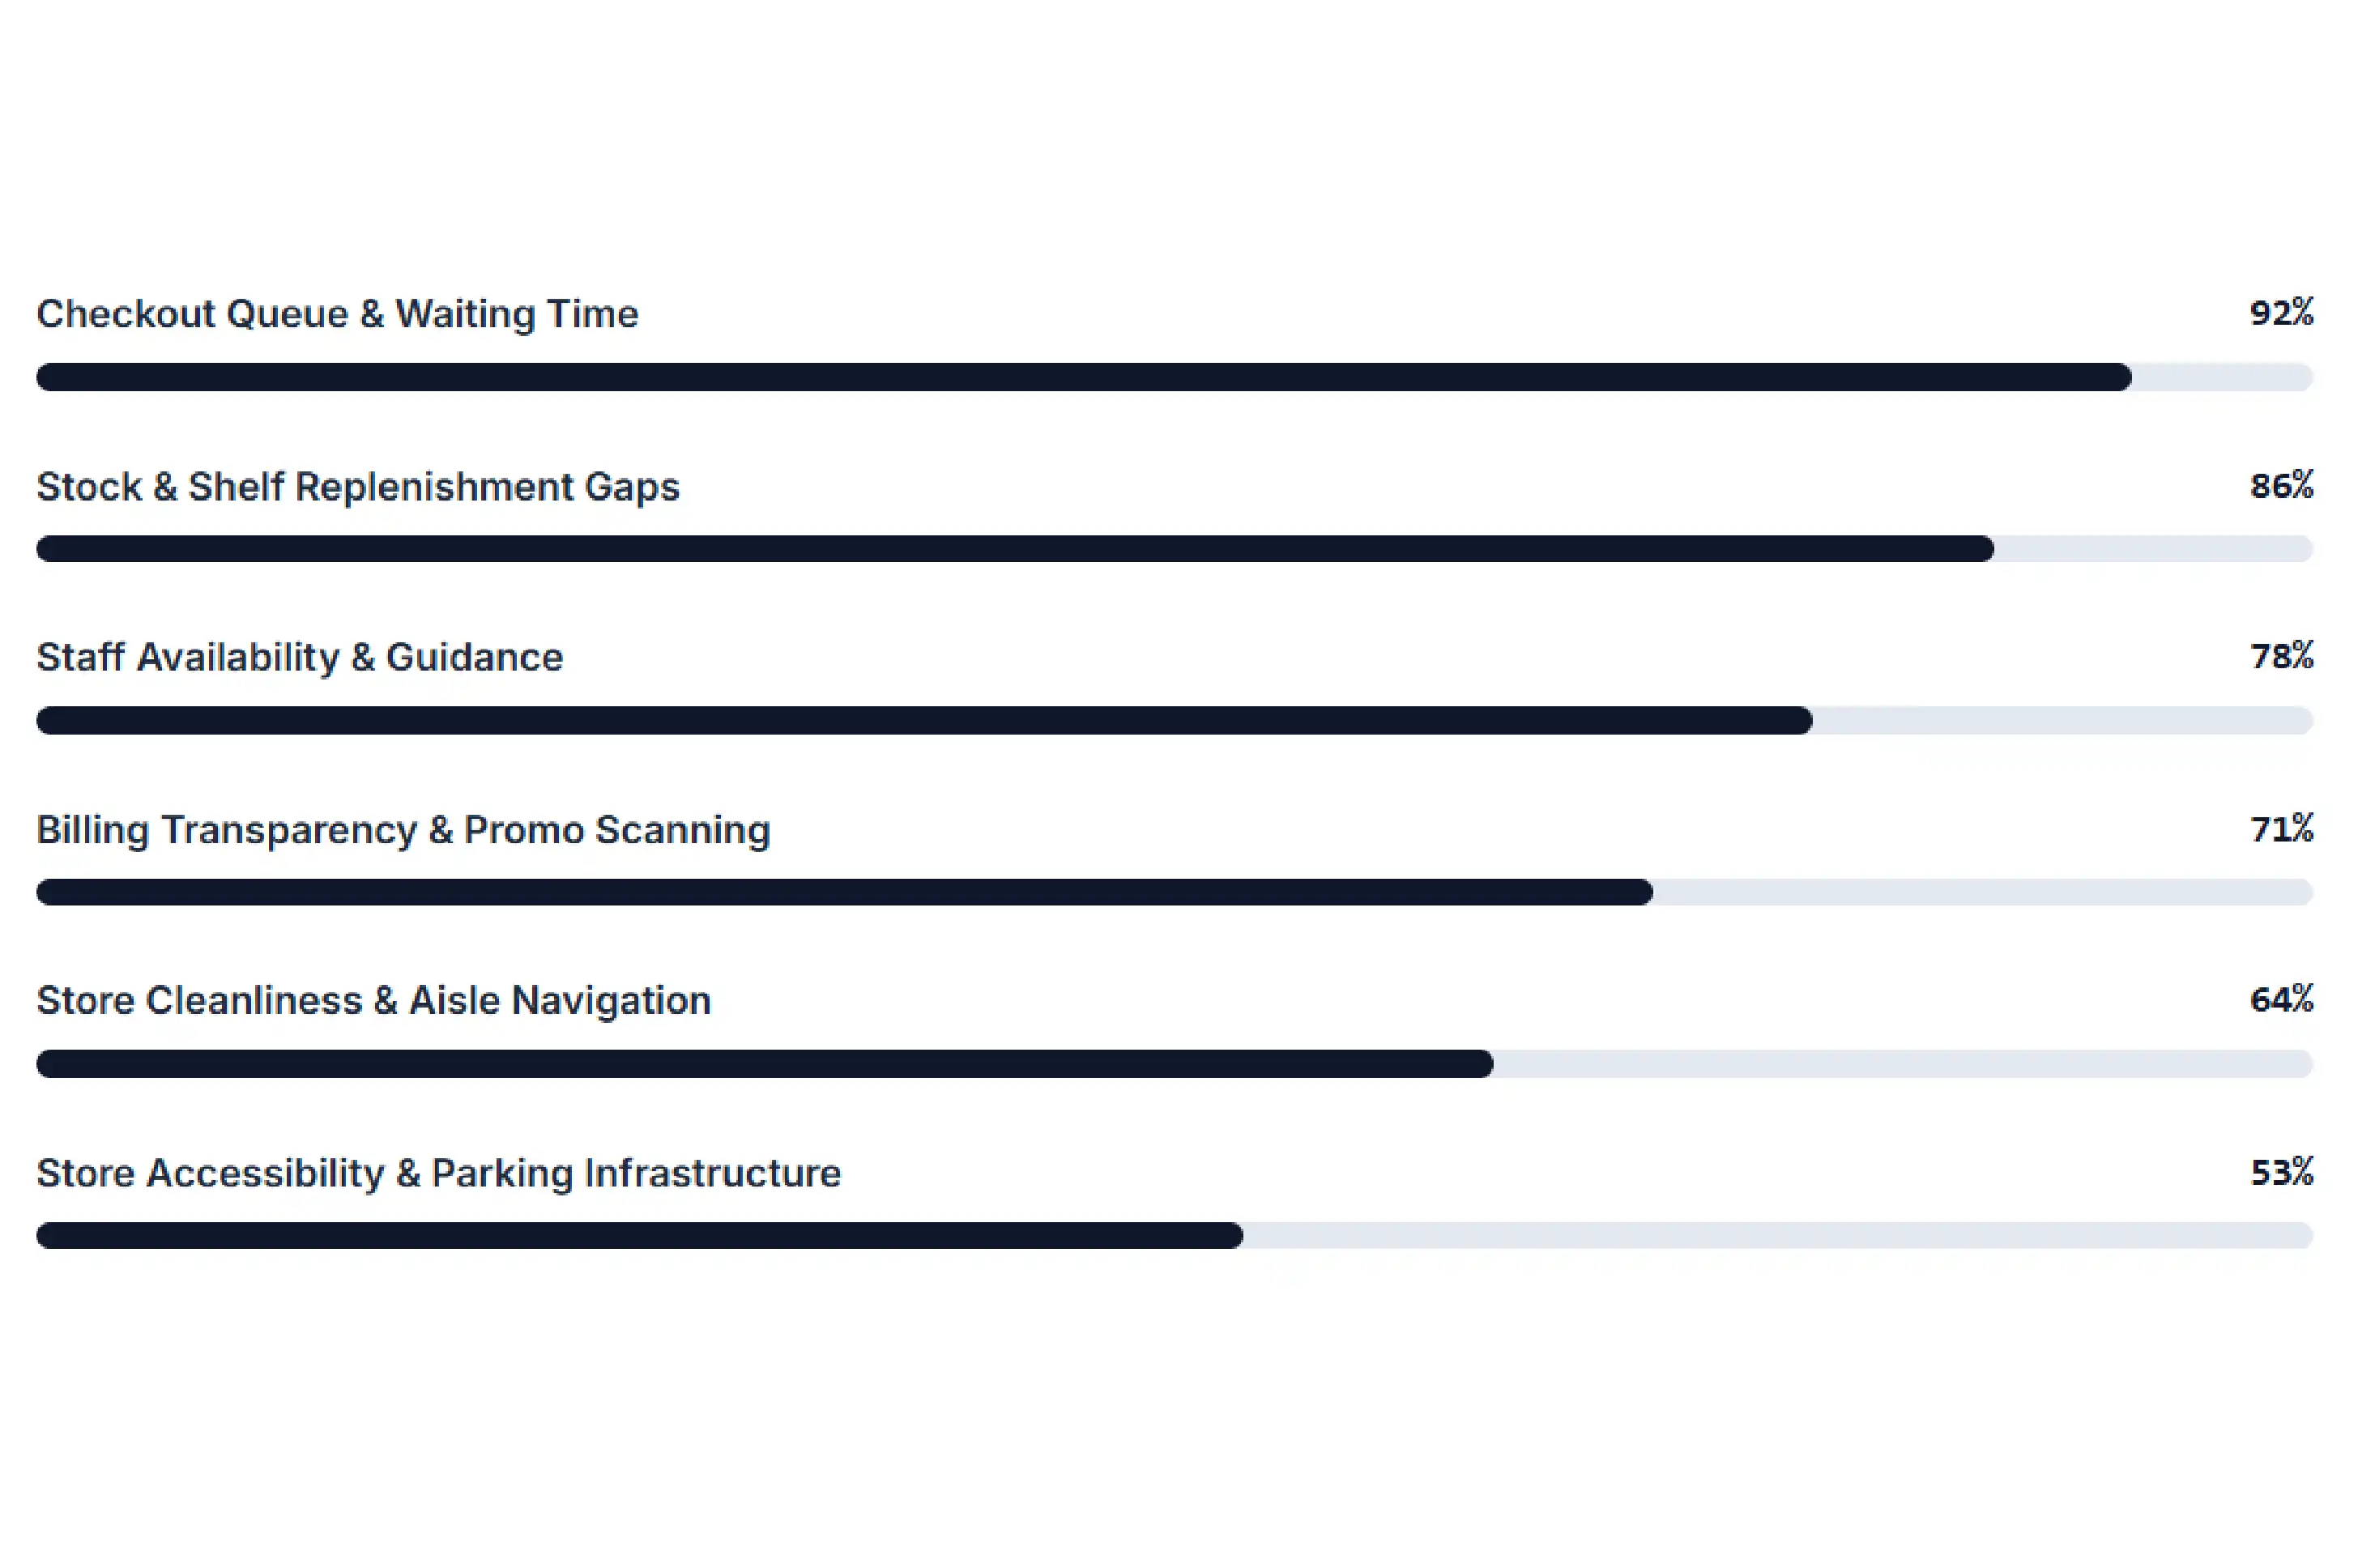
Review text provided context that star ratings could not communicate independently. Topic classification helped group feedback into themes such as waiting time, staff assistance, stock availability, billing clarity, cleanliness, and store accessibility.
Repeated mentions of a particular issue could indicate an opportunity for operational investigation. For example, complaints about long queues might justify reviewing staffing patterns, while repeated inventory-related comments could prompt a closer examination of product replenishment.
These findings should be treated as signals for investigation rather than definitive proof of operational causes. Reviewers represent a self-selected group, and public feedback may not reflect every customer's experience.
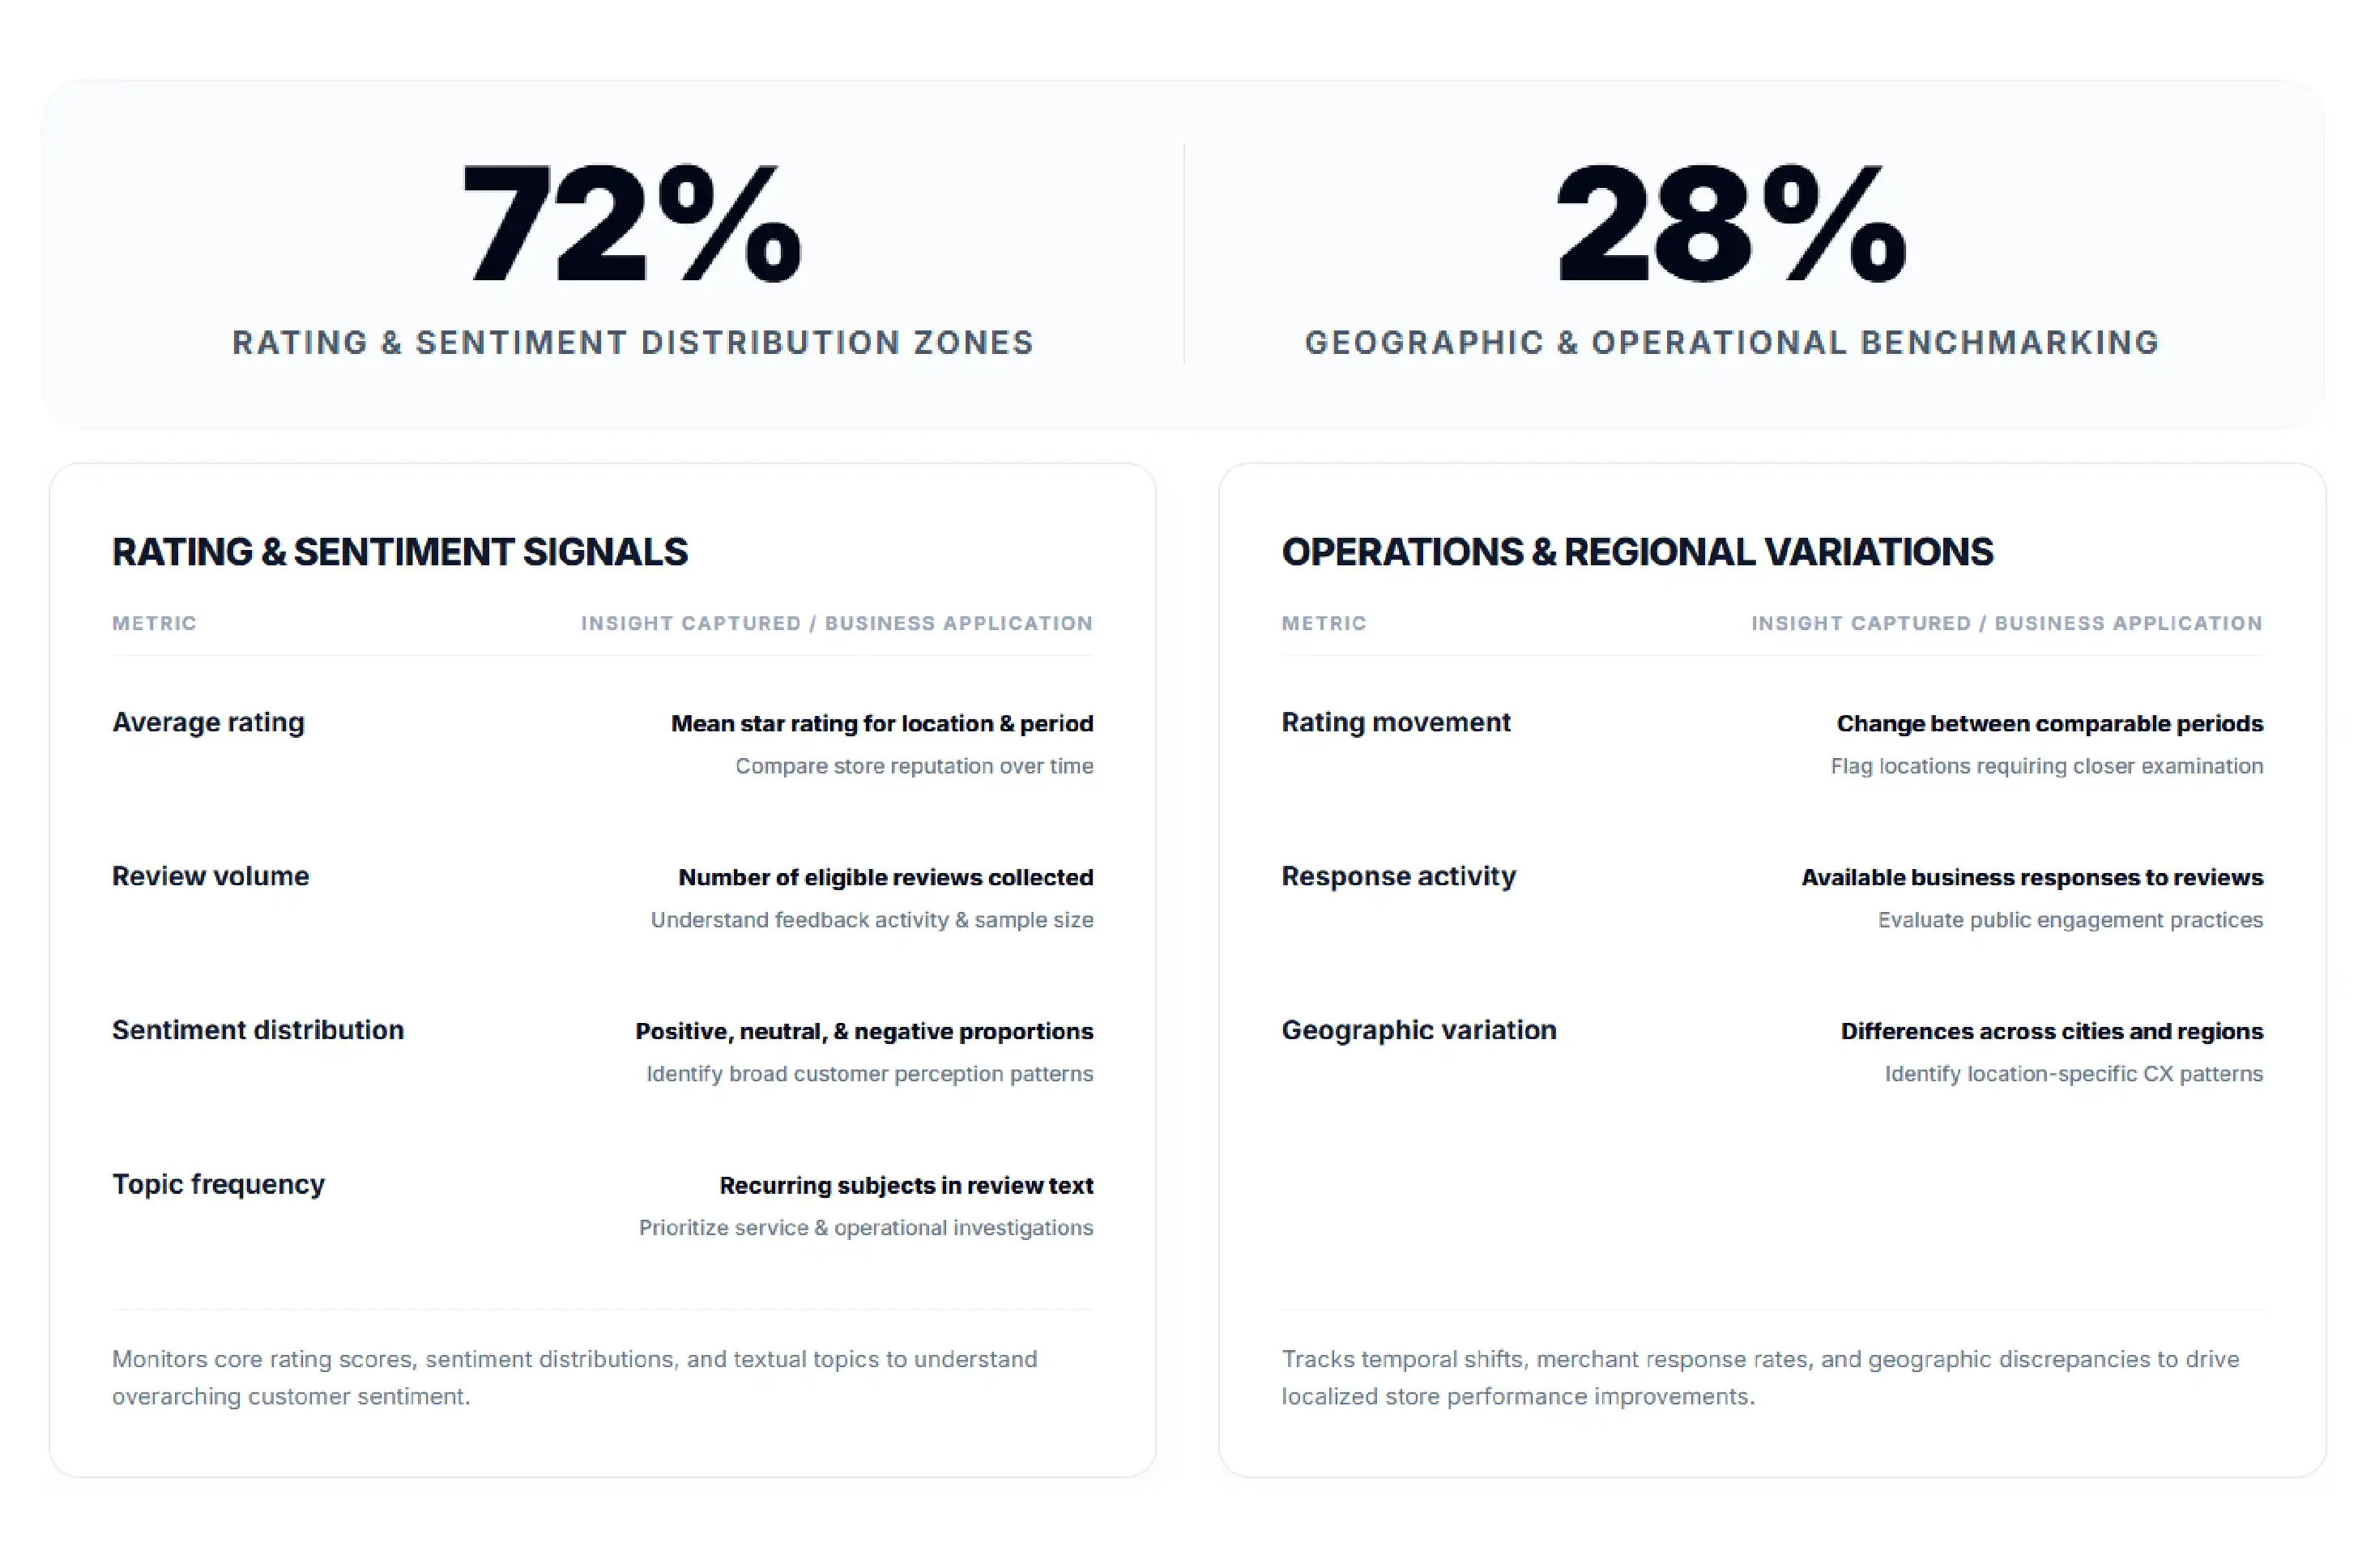
Standardized metrics allowed the client to compare retail locations using common definitions and reporting periods. Instead of interpreting a single average rating in isolation, analysts could examine rating distributions, review volumes, and the proportion of reviews classified into different sentiment categories.
| Metric | Insight Captured | Business Application |
|---|---|---|
| Average rating | Mean star rating for a defined location and period | Compare store reputation over time |
| Review volume | Number of eligible reviews collected | Understand feedback activity and sample size |
| Sentiment distribution | Positive, neutral, and negative review proportions | Identify broad customer perception patterns |
| Topic frequency | Recurring subjects in review text | Prioritize service and operational investigations |
| Rating movement | Change between comparable periods | Flag locations requiring closer examination |
| Response activity | Available business responses to reviews | Evaluate public engagement and response practices |
| Geographic variation | Differences across cities and regions | Identify location-specific customer experience patterns |
The table illustrates the proposed analytical framework; it does not represent verified measurements from a named retail client.
The following illustrative dataset demonstrates how review intelligence can be presented for selected retail listings. The business names are fictional examples, and the numbers are hypothetical rather than actual Google Maps measurements.
| Retail Store | City | Review Volume | Average Rating | Dominant Feedback Theme | Sentiment Pattern |
|---|---|---|---|---|---|
| MetroMart Central | Mumbai | 1,240 | 4.3 | Product variety | Mostly positive |
| ValueBasket Retail | Delhi | 980 | 4.0 | Checkout waiting time | Mixed |
| FreshCorner Market | Bengaluru | 860 | 4.4 | Store cleanliness | Mostly positive |
| CityChoice Stores | Hyderabad | 720 | 3.8 | Product availability | Mixed |
| DailyNeeds Retail | Pune | 645 | 4.1 | Staff assistance | Mostly positive |
| Neighborhood Hub | Jaipur | 410 | 3.7 | Billing and service | Mixed |
| FamilyBasket Outlet | Lucknow | 355 | 4.2 | Convenience and access | Mostly positive |
| SmartBuy Market | Chennai | 590 | 3.9 | Inventory consistency | Mixed |
This sample illustrates how location-level review data can help identify differences in customer experience across cities. MetroMart Central, for example, has a relatively high average rating alongside a substantial review volume, while Neighborhood Hub presents an opportunity to investigate billing and service-related feedback.
The value of this dataset was not limited to individual records.
The real advantage came from accumulating observations over time.
With thousands of records collected repeatedly, analysts could calculate rating trends, identify recurring complaint patterns, compare stores, and connect customer feedback with operational decisions.
The structured review intelligence framework created a foundation for more consistent reputation analysis and operational decision-making. Its value came from connecting customer feedback with store locations, recurring themes, and comparable reporting metrics.
The following outcomes are illustrative targets for a modeled implementation, not independently verified client results.
These benefits depend on data coverage, collection permissions, analytical quality, and the retailer's ability to respond effectively. A scraping pipeline alone cannot guarantee higher ratings or improved customer satisfaction.
iWeb Data Scraping can help retailers establish a consistent process for collecting and organizing publicly accessible business review information across eligible store listings. Structured records make it easier to compare customer feedback, track rating changes, and investigate recurring themes across locations.
The approach supports geographic segmentation by organizing information around store identifiers, cities, regions, and retail categories. This enables stakeholders to understand where customer experiences differ and whether particular issues appear concentrated in specific markets.
Data quality is another important advantage. Normalization, duplicate detection, field validation, and consistent date handling help reduce reporting inconsistencies. Sentiment classification and topic extraction can then transform large volumes of review text into useful operational categories, with human validation for ambiguous cases.
"The review intelligence framework gave our team a more structured way to understand customer feedback across retail locations. Consolidating ratings, review themes, and geographic information made it easier to identify recurring service concerns and compare store-level experiences. The resulting dashboards supported more focused discussions between regional managers and operations teams. We also gained a clearer process for reviewing changes in customer sentiment and prioritizing follow-up investigations."
— Head of Retail Analytics
The project established a structured framework for turning publicly accessible Google Maps review information into actionable retail intelligence. By consolidating store records, ratings, review activity, and customer feedback themes, the organization gained a consistent foundation for evaluating local reputation and comparing customer experiences across retail locations.
The framework supported more systematic reporting, reduced dependence on fragmented manual tracking, and helped analysts identify recurring operational concerns. Geographic segmentation made it easier to examine differences between outlets, while sentiment and topic analysis provided additional context beyond average star ratings.
Implementation of a Google Maps Scraper supported the proposed collection workflow by organizing eligible listing and review information into a standardized dataset, subject to applicable access rules and source limitations.
The integration of Google Maps Location Intelligence connected customer feedback with store-level and geographic attributes, allowing the organization to explore regional patterns and prioritize locations for further investigation.
The company could now answer critical operational questions faster:
This shift from periodic reporting to continuous reputation intelligence strengthened the organization's ability to manage the rapidly evolving retail environment.
Most importantly, the project demonstrated that customer review visibility is not simply a rating metric. In a competitive retail environment, reputation intelligence is part of the customer experience and directly influences the opportunity to convert demand into sales.
It is the structured collection of permitted, publicly accessible review information and relevant listing details to analyze customer ratings, feedback themes, and store-level reputation across retail locations.
Depending on source access and applicable restrictions, a dataset may contain store names, listing identifiers, addresses, star ratings, available review dates, review text, and relevant business attributes. Only permitted fields should be collected.
Sentiment analysis classifies review language into broad emotional categories and identifies recurring subjects such as service quality, cleanliness, product availability, and checkout experiences. Human validation helps address ambiguous language and classification errors.
Yes. When listings are accurately matched and data coverage is sufficiently consistent, retailers can compare store-level metrics across cities, regions, and retail categories using standardized reporting periods and clearly defined measures.
iWeb Data Scraping can help organize eligible review data into structured datasets, apply quality checks, support sentiment and topic analysis, and generate dashboards that help retailers investigate customer feedback and make informed operational decisions.
Our advanced data scraping and analytics solutions help you transform customer reviews into structured insights, enabling better reputation monitoring, smarter store-level decisions, and improved customer experiences across retail locations.
Start a projectFields marked * are required. Everything else just helps us scope faster — skip what you don't know yet.