Introduction
Taiwan and Japan represent two important e-commerce markets in East Asia, supported by established online marketplaces, digitally engaged consumers, competitive product assortments, and sophisticated fulfillment networks. Taiwan's online retail ecosystem includes Momo and Shopee Taiwan, while Japan's marketplace landscape features Rakuten and Amazon Japan. Together, these platforms provide valuable opportunities for analyzing product prices, seller competition, promotional strategies, and cross-border retail trends.
Businesses operating across these markets need consistent product-level intelligence to understand how the same or comparable products are priced across platforms. Taiwan Japan marketplace price data scraping enables retailers, manufacturers, distributors, and market researchers to collect structured information about listed prices, discounts, product variants, shipping charges, and seller availability. This information helps organizations identify pricing gaps, assess competitive positioning, and evaluate market-specific purchasing patterns.
Through Momo data scraping, analysts can examine Taiwan's product listings, promotional campaigns, category-level pricing, and seller offers. A Shopee Taiwan scraper can support comparisons of marketplace prices, voucher-driven promotions, seller competition, and product availability across selected categories. In Japan, Rakuten product listings provide another perspective on merchant competition, campaign discounts, and shopping incentives, while Amazon Japan offers extensive product-level information for evaluating price movements and competitive benchmarks.
This research report presents a structured 2026 framework for comparing prices across Momo, Shopee Taiwan, Rakuten, and Amazon Japan. It covers representative product categories, marketplace price differences, numerical comparison tables, monitoring metrics, and practical applications for e-commerce decision-makers.
Research note: The numerical tables below are illustrative research benchmarks designed to demonstrate how marketplace pricing can be compared. They are not verified live listings or confirmed October 2026 market averages. Actual prices vary by seller, product variant, location, shipping eligibility, membership benefits, and promotional period.
1. Understanding the Taiwan and Japan Marketplace Landscape
Taiwan and Japan have distinct retail environments that influence marketplace pricing. Taiwan's market features strong competition among online shopping platforms, frequent promotional campaigns, and consumer interest in electronics, beauty products, home essentials, and lifestyle goods. Japan combines large domestic retail platforms with extensive branded assortments, established merchants, and campaign-driven purchasing activity.
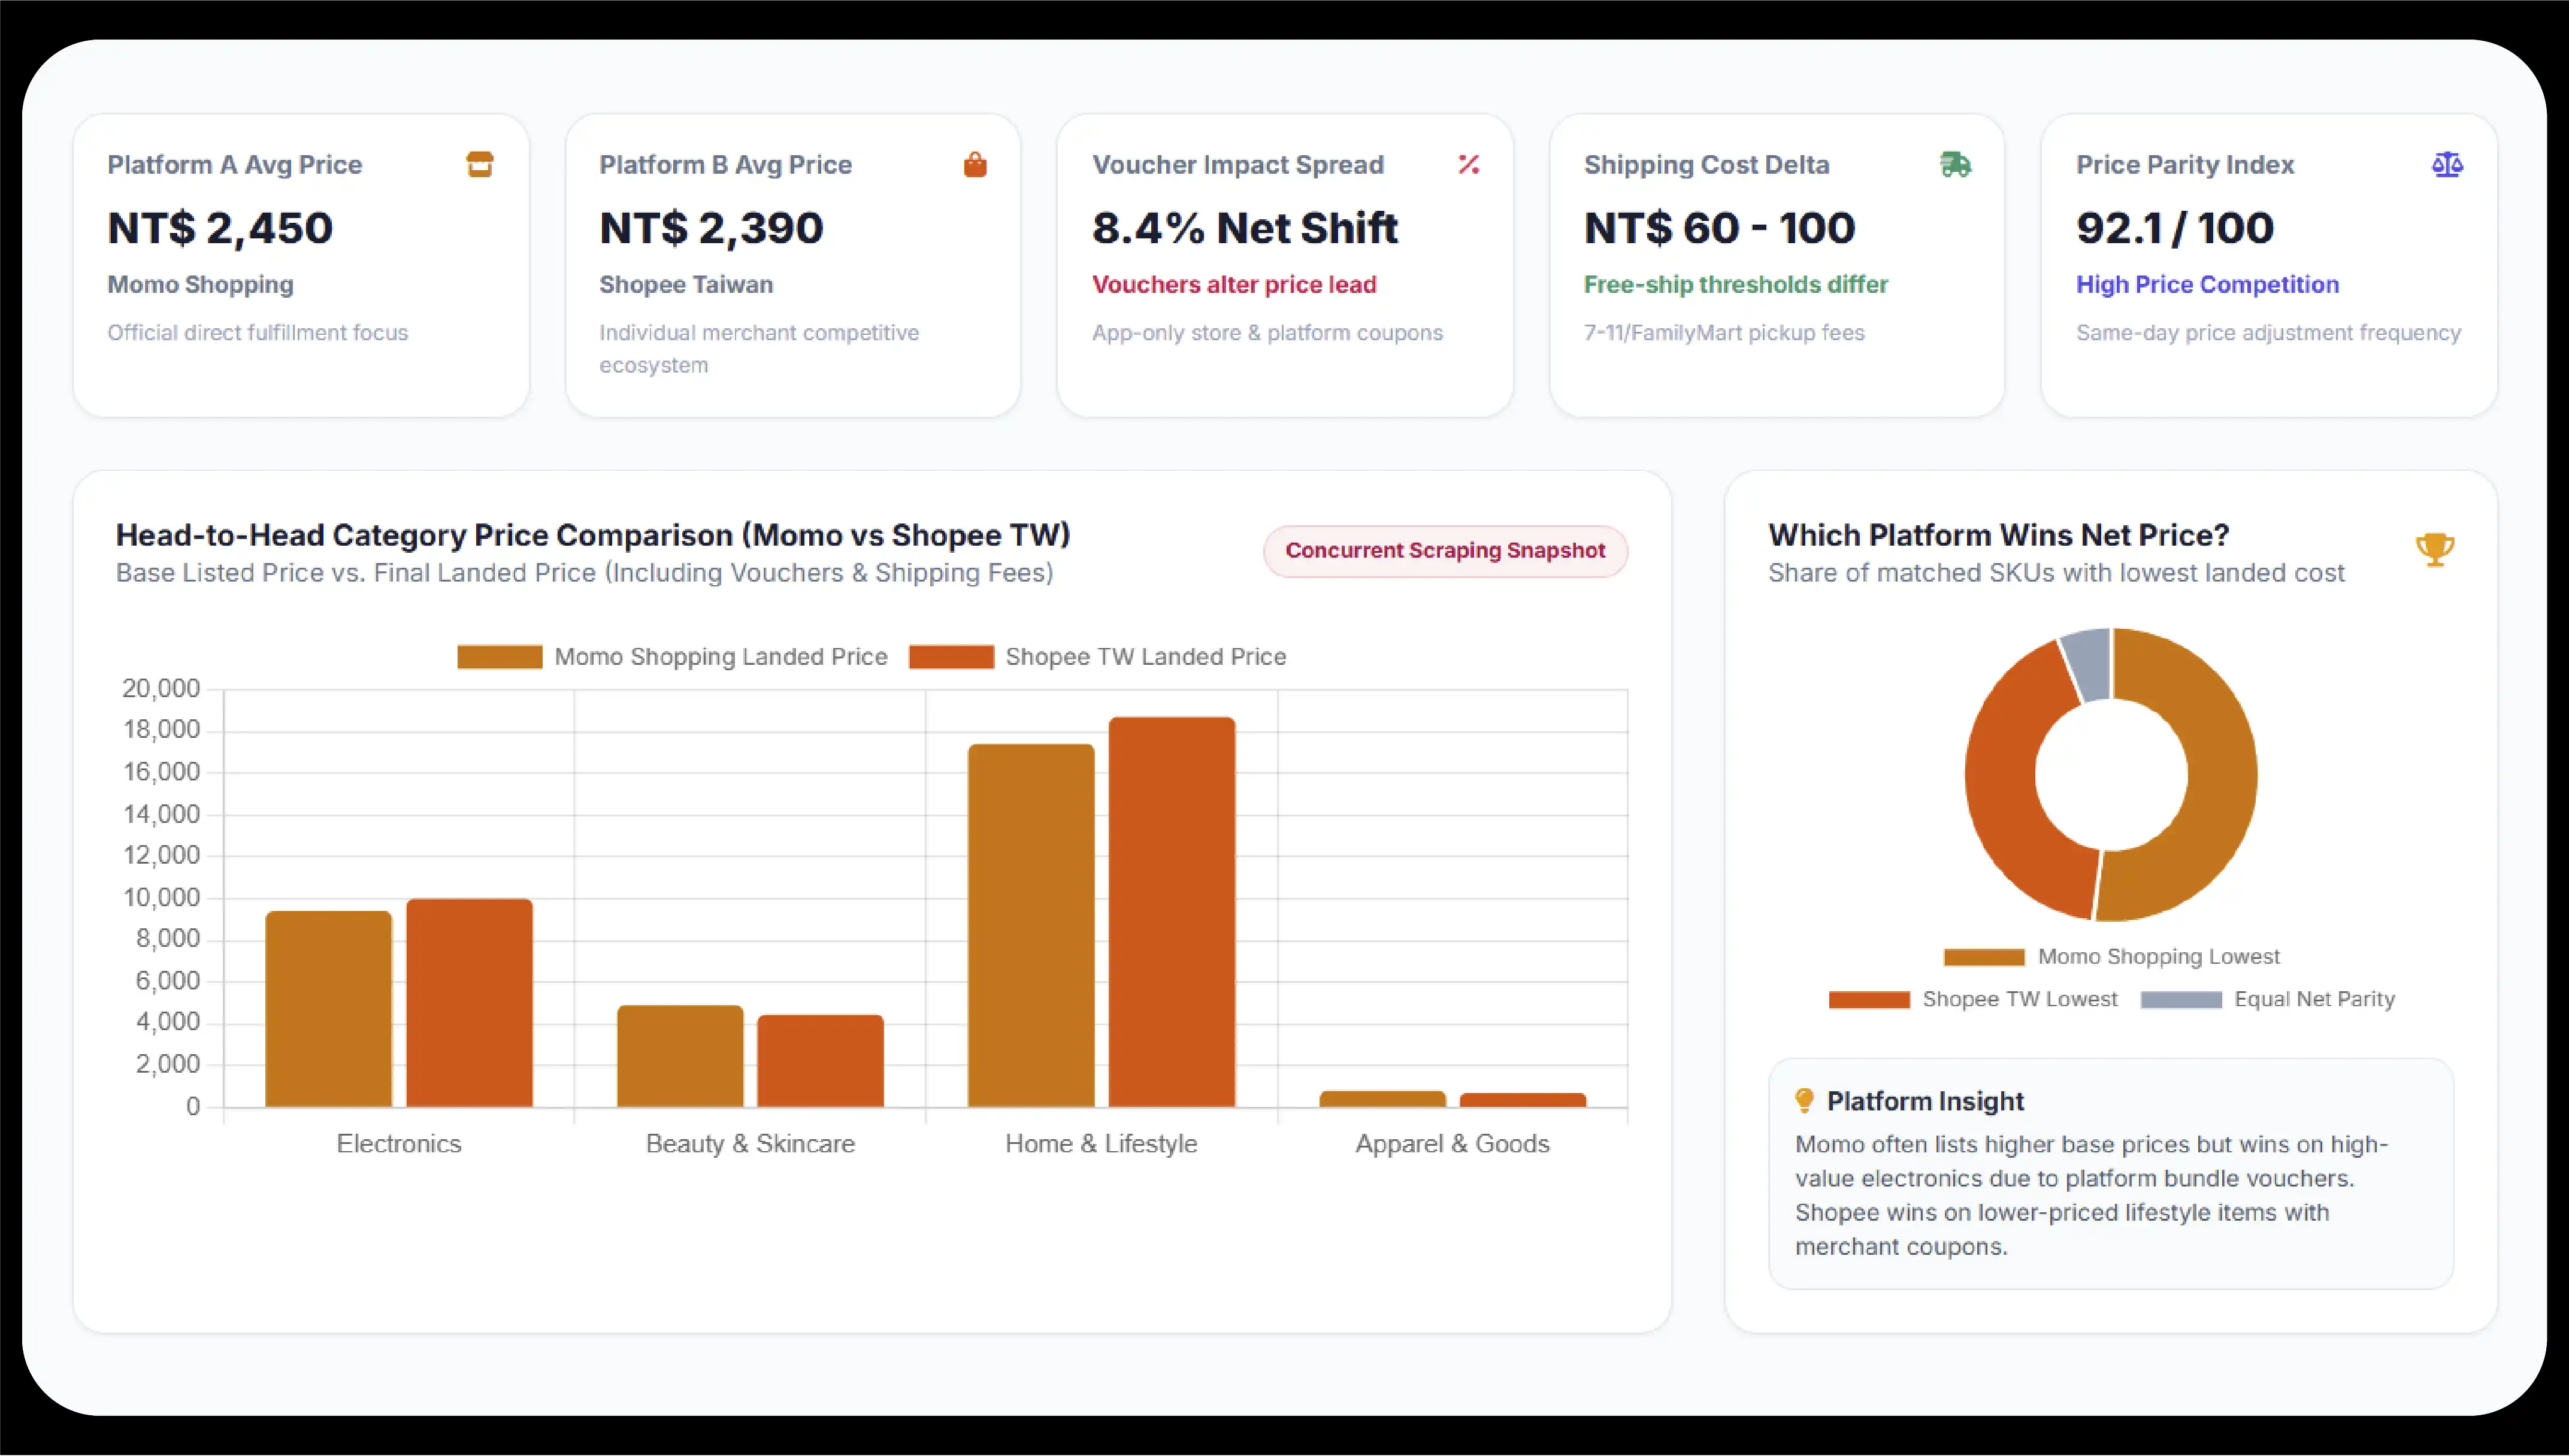
Momo and Shopee Taiwan are particularly relevant for studying price variations within Taiwan. Although both serve online shoppers, their sellers, product assortments, promotional mechanisms, and fulfillment arrangements can differ substantially. A product with a competitive listed price on one platform may become more expensive after shipping or more attractive after a platform voucher is applied.
Rakuten and Amazon Japan also require separate analytical treatment. Rakuten's merchant-oriented marketplace model makes shop-level offers and campaign conditions important comparison factors. Amazon Japan provides another competitive reference point through its broad catalog, seller offers, and product availability information. Neither platform should be assumed to offer the lowest price across every category.
A meaningful comparison therefore requires matching equivalent products, recording prices at the same observation time, and distinguishing regular prices from promotional prices.
2. Marketplace Price Comparison Methodology
A reliable comparison begins with a common product catalog. Analysts should identify matching products using brand names, model numbers, barcodes, package sizes, colors, and technical specifications. Without this step, a lower price may simply represent a smaller pack, an older model, or a different product variant.
For Taiwan, prices should be recorded in New Taiwan dollars (TWD). For Japan, prices should be recorded in Japanese yen (JPY). Currency conversion should be performed only after collecting the original prices, using a consistent exchange-rate timestamp.
Rakuten product data scraping supports analysis of merchant-level prices, shipping costs, reward points, coupons, and product availability. These details are important because a displayed price alone may not reflect the buyer's eventual cost. Rakuten's marketplace structure and Japan's barcode-based product identification practices make merchant-level offer matching particularly valuable.
Similarly, Amazon Japan price scraping can help track displayed prices, seller offers, discounts, availability, and product identifiers. Where available, ASINs, JAN codes, EANs, and model numbers help distinguish exact matches from similar listings. Product identification should be verified before comparing the price of an item across Japan and Taiwan.
The methodology should capture five key price measures:
- Listed price: : The standard displayed selling price.
- Promotional price: : The reduced price shown during a campaign or discount.
- Landed price: : The product price plus applicable shipping and other unavoidable charges.
- Effective price: : The estimated cost after eligible discounts, vouchers, and clearly valued reward points.
- Price index: The product's price relative to a defined marketplace or category benchmark.
These measures provide a consistent foundation for examining competitive pricing across the four marketplaces.
3. Numerical Marketplace Price Benchmarks
The following table demonstrates how a research team could organize a sample of 12 comparable product categories across Taiwan and Japan. Values are hypothetical snapshot prices, not observed live marketplace offers. Taiwan figures are in TWD, and Japan figures are in JPY. Products are category-level examples rather than guaranteed identical SKUs.
Table 1. Cross-Marketplace Product Price Comparison
| 1 |
Smartphones |
128 GB midrange model |
12,490 |
11,990 |
39,800 |
38,900 |
| 2 |
Wireless earbuds |
Standard wireless model |
2,490 |
2,190 |
7,980 |
7,480 |
| 3 |
Smartwatches |
Entry-level smartwatch |
3,290 |
2,890 |
10,800 |
10,200 |
| 4 |
Power banks |
10,000 mAh model |
799 |
649 |
2,480 |
2,280 |
| 5 |
Skincare |
Facial serum, 30 ml |
899 |
759 |
3,980 |
3,680 |
| 6 |
Shampoo |
500 ml bottle |
299 |
249 |
1,280 |
1,180 |
| 7 |
Running shoes |
Standard adult pair |
2,990 |
2,590 |
9,900 |
9,480 |
| 8 |
Backpacks |
Everyday 20 L bag |
1,490 |
1,190 |
4,980 |
4,680 |
| 9 |
Small appliances |
Electric kettle |
1,290 |
1,090 |
3,480 |
3,280 |
| 10 |
Kitchenware |
Stainless-steel pan |
1,190 |
990 |
3,980 |
3,680 |
| 11 |
Pet supplies |
Dry food, 2 kg |
699 |
629 |
2,280 |
2,180 |
| 12 |
Home storage |
Medium storage box |
399 |
329 |
1,480 |
1,380 |
Source: Illustrative benchmark dataset created for this report. Prices are hypothetical and are not verified listings from Momo, Shopee Taiwan, Rakuten, or Amazon Japan.
What the benchmark reveals?
1. Marketplace price positioning
In this illustrative sample, Shopee Taiwan has the lowest displayed price in all 12 categories, while Amazon Japan has a lower listed price than Rakuten in all 12 Japanese comparisons. This is a property of the constructed dataset, not a verified finding about actual marketplace-wide pricing. Real research should calculate the lowest-price share from collected, matched offers.
2. Discount visibility
A product may have a standard list price and a separate campaign price. Recording both allows researchers to calculate the markdown:
\[ \text{Discount \%}=\frac{\text{List Price}-\text{Sale Price}}{\text{List Price}}\times100 \]
3. Category-specific competition
Electronics require careful model matching, while beauty products require attention to formulation, volume, and authorized distribution. Apparel and footwear need size and color matching, and household products require comparable dimensions and specifications.
4. Currency-sensitive interpretation
A Japanese product priced at ¥3,680 cannot be compared directly with a Taiwanese product priced at NT$759. Researchers must convert currencies using a stated exchange rate and account for international shipping, import charges where applicable, and other purchase conditions.
4. Promotional Pricing and Seller Competition
Promotions can change marketplace rankings within hours. A product that appears expensive in a morning snapshot may become competitive during an evening flash sale. Consequently, a single observation cannot reliably represent the normal price of a product.
Momo and Shopee Taiwan should be monitored for displayed discounts, vouchers, campaign labels, seller offers, and shipping incentives. Analysts should distinguish platform-funded promotions from seller-funded reductions wherever the available data supports that classification.
On Rakuten, points and shop-level promotions can materially affect the value of an offer. Amazon Japan comparisons should account for eligible coupons and distinguish the displayed offer from the price available to a particular customer. Membership benefits and personalized promotions should not be treated as universally available discounts.
Taiwan's established marketplace ecosystem includes Shopee and Momo, while Japan's online shopping landscape includes Rakuten and Amazon alongside other retail channels.
For a defensible study, every collected offer should include a timestamp, currency, product identifier, seller identity where available, standard price, discounted price, shipping charge, promotional conditions, and stock status. Recording these fields allows analysts to reconstruct why a product's competitive position changed.
5. Price Gaps, Discounts, and Effective Purchase Costs
A marketplace price gap measures the difference between the highest and lowest comparable offers. It can reveal opportunities for price optimization, identify unusually expensive listings, and help businesses evaluate whether their products remain competitive.
The calculation is straightforward:
\[ \text{Price Gap \%}=\frac{\text{Highest Price}-\text{Lowest Price}}{\text{Lowest Price}}\times100 \]
For example, if a product costs NT$1,290 on Momo and NT$1,090 on Shopee Taiwan, the difference is NT$200, or approximately 18.35% of the lower price. However, this comparison is meaningful only if the products and purchase conditions are equivalent.
A comprehensive Taiwan ecommerce price comparison should therefore distinguish the displayed price from the final payable amount. Shipping fees, voucher eligibility, minimum-spend conditions, and product availability can change which offer represents the best value.
Table 2. Illustrative Price Gap and Promotion Intelligence
The following hypothetical dataset demonstrates how price differences, discounts, and effective prices can be measured. For this example, effective prices account for the stated product discount and shipping charge only; taxes, international delivery, and other costs are excluded.
| 1 |
Smartphone |
Taiwan |
13,990 TWD |
1,500 TWD |
12,490 TWD |
0 TWD |
12,490 TWD |
10.72% |
| 2 |
Wireless earbuds |
Taiwan |
2,790 TWD |
600 TWD |
2,190 TWD |
60 TWD |
2,250 TWD |
19.35% |
| 3 |
Smartwatch |
Taiwan |
3,590 TWD |
500 TWD |
3,090 TWD |
0 TWD |
3,090 TWD |
13.93% |
| 4 |
Power bank |
Taiwan |
899 TWD |
150 TWD |
749 TWD |
45 TWD |
794 TWD |
11.68% |
| 5 |
Skincare serum |
Taiwan |
999 TWD |
200 TWD |
799 TWD |
0 TWD |
799 TWD |
20.02% |
| 6 |
Shampoo |
Taiwan |
349 TWD |
50 TWD |
299 TWD |
40 TWD |
339 TWD |
2.87% |
| 7 |
Running shoes |
Taiwan |
3,490 TWD |
500 TWD |
2,990 TWD |
0 TWD |
2,990 TWD |
14.33% |
| 8 |
Backpack |
Taiwan |
1,690 TWD |
300 TWD |
1,390 TWD |
50 TWD |
1,440 TWD |
14.79% |
| 9 |
Electric kettle |
Japan |
3,980 JPY |
500 JPY |
3,480 JPY |
0 JPY |
3,480 JPY |
12.56% |
| 10 |
Kitchen pan |
Japan |
4,480 JPY |
500 JPY |
3,980 JPY |
350 JPY |
4,330 JPY |
3.35% |
| 11 |
Pet food |
Japan |
2,580 JPY |
300 JPY |
2,280 JPY |
250 JPY |
2,530 JPY |
1.94% |
| 12 |
Storage box |
Japan |
1,680 JPY |
200 JPY |
1,480 JPY |
300 JPY |
1,780 JPY |
-5.95% |
Source: Illustrative analytical dataset. These are hypothetical examples, not observed prices or promotions on the four marketplaces. Effective price equals sale price plus the stated shipping charge. Negative savings indicate that the effective price exceeds the original list price.
Insights from the second dataset
- Discount effectiveness: : The skincare serum example delivers a 20.02% saving before shipping, making it the strongest percentage discount among these examples.
- Shipping impact: : The kitchen pan's 3.35% saving before shipping falls to 3.35% effective-price savings against its list price in this example's calculation.
- Value reversal: : The storage box costs ¥1,780 after shipping, exceeding its ¥1,680 list price. Its effective saving is therefore negative.
- Promotional quality: : A large advertised markdown does not automatically make an offer the cheapest option. Competing prices and delivery costs must also be considered.
6. Data Collection and Monitoring Framework
A practical monitoring program should combine consistent product matching, scheduled collection, and automated validation.
Product matching: Begin with a list of priority SKUs, brand names, model numbers, barcodes, sizes, and variants. Use exact identifiers when available and flag uncertain matches for review.
Collection frequency: Daily monitoring is suitable for routine price tracking. During major campaigns, more frequent observations can capture temporary reductions and rapidly changing stock conditions.
Data normalization: Convert Japanese full-width characters into standardized text where appropriate, preserve original product titles, normalize currency fields, and separate list prices from sale prices. Japanese consumption-tax treatment and reward-point valuations should be documented.
Quality assurance: Flag missing prices, duplicate offers, unusually large price movements, inconsistent units, and unavailable products. Track the proportion of successfully matched SKUs so that analysts can distinguish market changes from data-quality issues.
Reporting: Deliver structured data in CSV, JSON, or database-ready formats, with dashboards for price indices, discount depth, seller competition, stock changes, and historical trends. Automated collection should follow each marketplace's applicable terms, permitted access methods, and privacy requirements.
7. Business Applications and Strategic Benefits
Cross-marketplace intelligence supports several practical business decisions.
- Retail price optimization: : Adjust pricing using comparable competitor offers rather than relying on isolated listings.
- Brand protection: : Identify potentially unauthorized sellers, unusual price deviations, and inconsistent advertised prices for further investigation.
- Market-entry planning: Evaluate whether a product's price positioning is viable in Taiwan or Japan before expanding distribution.
- Promotion planning: : Compare discount depth and timing to understand how campaigns affect competitive positioning.
- Assortment management: : Find products that are widely available in one market but have limited comparable listings in the other.
- Demand analysis: : Combine price observations with available review counts, ratings, and sales indicators to investigate relationships between price and consumer interest.
These applications are strongest when pricing information is analyzed over time rather than treated as a one-day snapshot.
Conclusion
The Taiwan and Japan marketplace ecosystem offers valuable opportunities for understanding regional price positioning, promotional competition, and product availability. Momo and Shopee Taiwan provide complementary views of Taiwan's retail environment, while Rakuten and Amazon Japan offer distinct perspectives on Japanese merchant competition and product pricing.
A well-designed cross-marketplace price report combines standardized product matching, transparent currency conversion, promotional tracking, and effective-price calculations. This creates a clearer basis for identifying genuine price gaps and making informed commercial decisions.
For businesses expanding across regional markets, Asia ecommerce price monitoring can turn fragmented marketplace observations into consistent intelligence for pricing, assortment, and campaign planning.
Finally, reliable Japan marketplace pricing data becomes especially valuable when it includes seller-level offers, shipping charges, discounts, reward points, and historical price movements. By applying a consistent methodology across all four platforms, businesses can build a more accurate understanding of competitive conditions and develop evidence-based pricing strategies for 2026 and beyond.
Experience top-notch web scraping service and mobile app scraping solutions with iWeb Data Scraping. Our skilled team excels in extracting various data sets, including retail store locations and beyond. Connect with us today to learn how our customized services can address your unique project needs, delivering the highest efficiency and dependability for all your data requirements.