
40+
DARK STORES MONITORED

FMCG Brand Tracked Daily Stock on Flipkart Minutes Across 40+ Dark Stores Nationwide for Real-Time Inventory Intelligence.
This case study is based on a real-world enterprise scenario where an FMCG intelligence team implemented automated quick-commerce data extraction to monitor SKU-level stock availability across Flipkart Minutes dark stores. The objective was to transform fragmented availability signals into structured intelligence that could support inventory planning, assortment optimization, replenishment decisions, and demand forecasting.
It is designed for:
The client required Tracked Daily Stock on Flipkart Minutes to understand how frequently products remained available, disappeared from listings, or experienced recurring stock-outs across different locations.
For FMCG organizations, Daily Flipkart Minutes stock monitoring for FMCG brands provides a practical intelligence layer for identifying availability gaps, regional supply differences, and high-demand products requiring faster replenishment.
The central business problem was straightforward: product availability changes continuously across quick-commerce dark stores, while conventional monitoring methods provide only fragmented snapshots. The client needed a scalable mechanism that could capture daily SKU-level availability, normalize the information, compare dark-store performance, and transform raw observations into actionable inventory intelligence.
Quick-commerce platforms operate through geographically distributed dark stores where product availability can change multiple times throughout the day. For FMCG brands, this creates a critical monitoring challenge because an item may be available in one location while simultaneously being unavailable in another.
The client implemented Flipkart Minutes dark store data scraping to capture structured product availability signals across a broad network of dark-store locations. The objective was to monitor product presence, stock status, category availability, and location-level differences through an automated intelligence pipeline.
The system was designed to Extract Flipkart Minutes SKU availability across 40+ dark stores, creating a consolidated dataset that allowed the client to compare product availability across locations and identify recurring stock-out patterns.
Instead of depending on manual searches, the client received standardized records containing SKU names, categories, availability status, location identifiers, timestamps, and related product attributes. These records were refreshed daily to create a historical availability layer.
The collected dataset helped analysts identify products with frequent availability interruptions, locations with lower assortment coverage, and categories experiencing stronger inventory pressure.
The intelligence layer also supported comparisons between high-performing and low-performing dark stores. This helped teams determine whether stock-outs were isolated operational incidents or part of wider demand and supply patterns.
By combining daily collection with historical analysis, the organization gained greater visibility into inventory movements and could identify emerging demand signals earlier.
The project demonstrated how structured quick-commerce stock intelligence can help FMCG companies move from reactive availability checks toward continuous, location-level inventory monitoring.
The client operated across a competitive FMCG environment where product availability directly influenced visibility, customer conversion, and revenue opportunities. However, tracking inventory conditions across a distributed quick-commerce network presented several operational difficulties.
The first major challenge was the lack of Daily SKU-level stock tracking across dark stores. Product availability differed significantly between locations, making it difficult to understand whether an SKU was broadly available or restricted to selected areas.
The client also required Flipkart Minutes real-time stock tracking to detect changes quickly. Traditional periodic checks could not provide sufficient visibility into products that moved from available to unavailable between monitoring cycles.
Another challenge involved identifying products that were repeatedly unavailable. Teams needed a systematic way to Scrape Out-of-stock FMCG products on Flipkart Minutes and determine which products experienced persistent availability problems rather than isolated stock interruptions.
Manual tracking was particularly difficult because hundreds of FMCG products could be present across different categories and locations. Analysts had to repeatedly search product listings, record availability, compare locations, and update spreadsheets.
The absence of a centralized historical dataset created another problem. Even when a product was observed as unavailable, teams could not easily determine how frequently the same SKU had been out of stock during previous days.
Regional differences further complicated the situation. A product could demonstrate strong availability in one dark store while being consistently unavailable in another because of differences in demand, replenishment schedules, inventory levels, or local purchasing behavior.
The client also lacked standardized metrics for measuring availability performance. Without consistent SKU-level records, it was difficult to calculate stock-out frequency, availability percentage, dark-store coverage, and category-level inventory gaps.
By implementing an automated quick-commerce monitoring framework, the client replaced manual product searches and spreadsheet-based tracking with a structured pipeline designed for continuous availability intelligence.
| Dimension | Manual Flipkart Minutes Tracking | Client Stock Intelligence System |
|---|---|---|
| Data Collection | Manual searches and periodic checks | Automated daily data collection |
| SKU Coverage | Limited by analyst capacity | 1,850+ FMCG SKUs monitored |
| Store Coverage | Small number of locations | 40+ dark stores monitored |
| Stock Visibility | Periodic snapshots | Consistent timestamped observations |
| Stock-out Detection | Manual identification | Automated availability classification |
| Historical Tracking | Scattered spreadsheets | Centralized historical dataset |
| Availability Comparison | Time-consuming manual comparison | Automated location-level comparison |
| Trend Identification | Reactive | Historical trend and demand analysis |
| Reporting | Manual spreadsheet preparation | Structured dashboards and reports |
| Scalability | Difficult as SKU volume increases | Designed for expanding SKU and store coverage |
The structured pipeline allowed the organization to establish a repeatable daily monitoring framework rather than relying on individual analyst observations.
This shift significantly improved the consistency of availability data and created a foundation for deeper quick-commerce analytics.
The brand in focus is a growing FMCG organization with a diverse product portfolio distributed through modern retail and quick-commerce channels.
Its product range included packaged foods, beverages, personal-care products, household products, and other fast-moving consumer categories. As quick-commerce became an increasingly important retail channel, the organization needed greater visibility into how its products performed across geographically distributed dark stores.
The business recognized that online availability was becoming an important component of digital shelf performance. A product could have sufficient inventory within a broader supply network but still remain unavailable to customers in a specific locality.
This created a gap between traditional inventory visibility and customer-facing availability.
The organization therefore wanted to establish a location-sensitive monitoring system capable of identifying product availability differences and recurring stock-out conditions.
Its objective was not simply to determine whether products appeared online. It wanted to understand availability behavior over time.
This included identifying consistently available SKUs, frequently unavailable products, dark stores with weaker assortment coverage, and categories experiencing significant availability volatility.
The resulting intelligence framework helped the organization establish a more data-driven understanding of its quick-commerce distribution performance.
We delivered an end-to-end monitoring framework designed to collect, normalize, validate, and analyze FMCG product availability signals across multiple Flipkart Minutes dark-store locations.
The project incorporated Flipkart Minutes Data Scraping for Quick Commerce Analytics to establish a structured availability dataset covering products, categories, locations, timestamps, and stock status.
The collection framework was designed to capture daily product-level observations and transform raw marketplace information into standardized records suitable for analysis.
A dedicated flipkart minutes data extraction api layer supported automated ingestion and helped organize recurring data collection into a consistent processing workflow.
The system also incorporated Managed web scraping to maintain monitoring continuity, improve data consistency, and support ongoing availability intelligence as product volumes and monitored locations expanded.
The data pipeline performed normalization and quality validation before records were transferred into the analytics layer. Duplicate records were identified, inconsistent product naming patterns were standardized, and location-level information was mapped into common fields.
Each observation was associated with a timestamp so that analysts could compare availability across different monitoring dates.
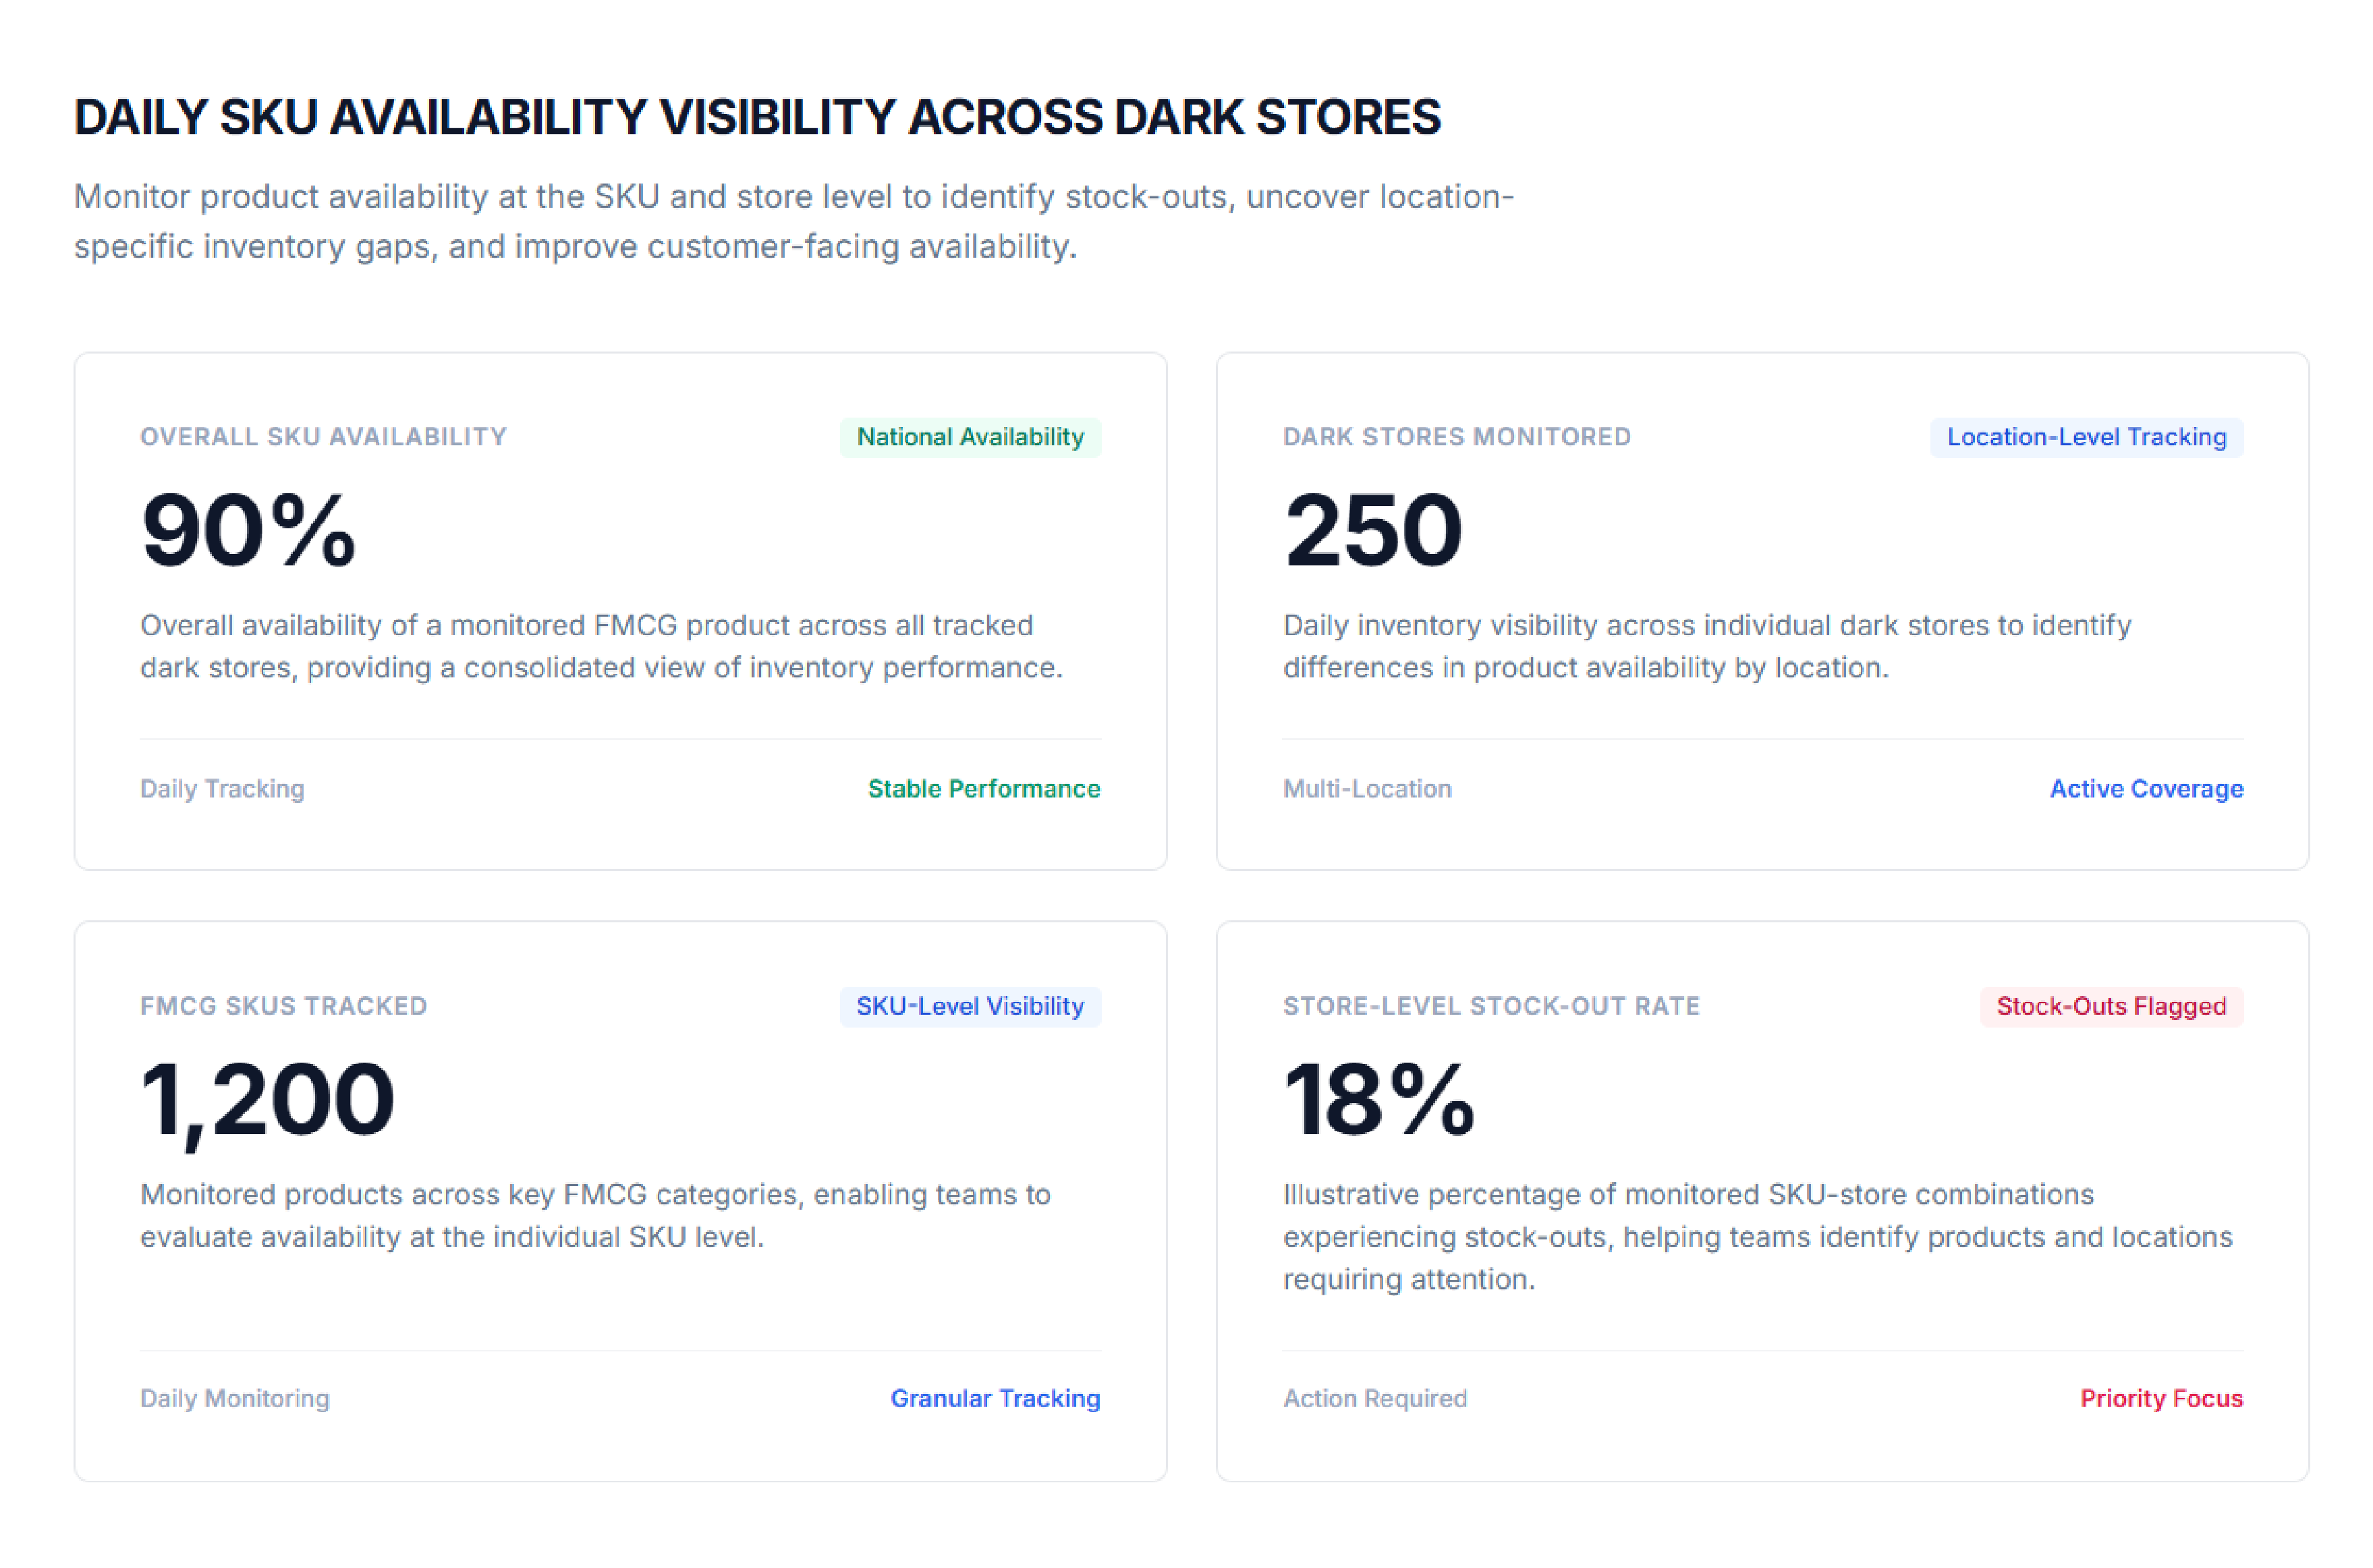
The first major finding was that product availability varied considerably across dark stores.
Although several high-volume FMCG SKUs demonstrated strong overall availability, certain products experienced repeated interruptions in specific locations.
Daily monitoring made these differences visible.
Rather than viewing inventory performance as a single national metric, the client could now examine SKU availability at the dark-store level.
This provided a more accurate understanding of customer-facing availability.
For example, a product showing 90% overall availability could still experience significant stock-outs in specific high-demand locations. Aggregated reporting alone would have hidden this problem.
Location-level monitoring therefore helped teams prioritize operational attention toward specific stores and products.
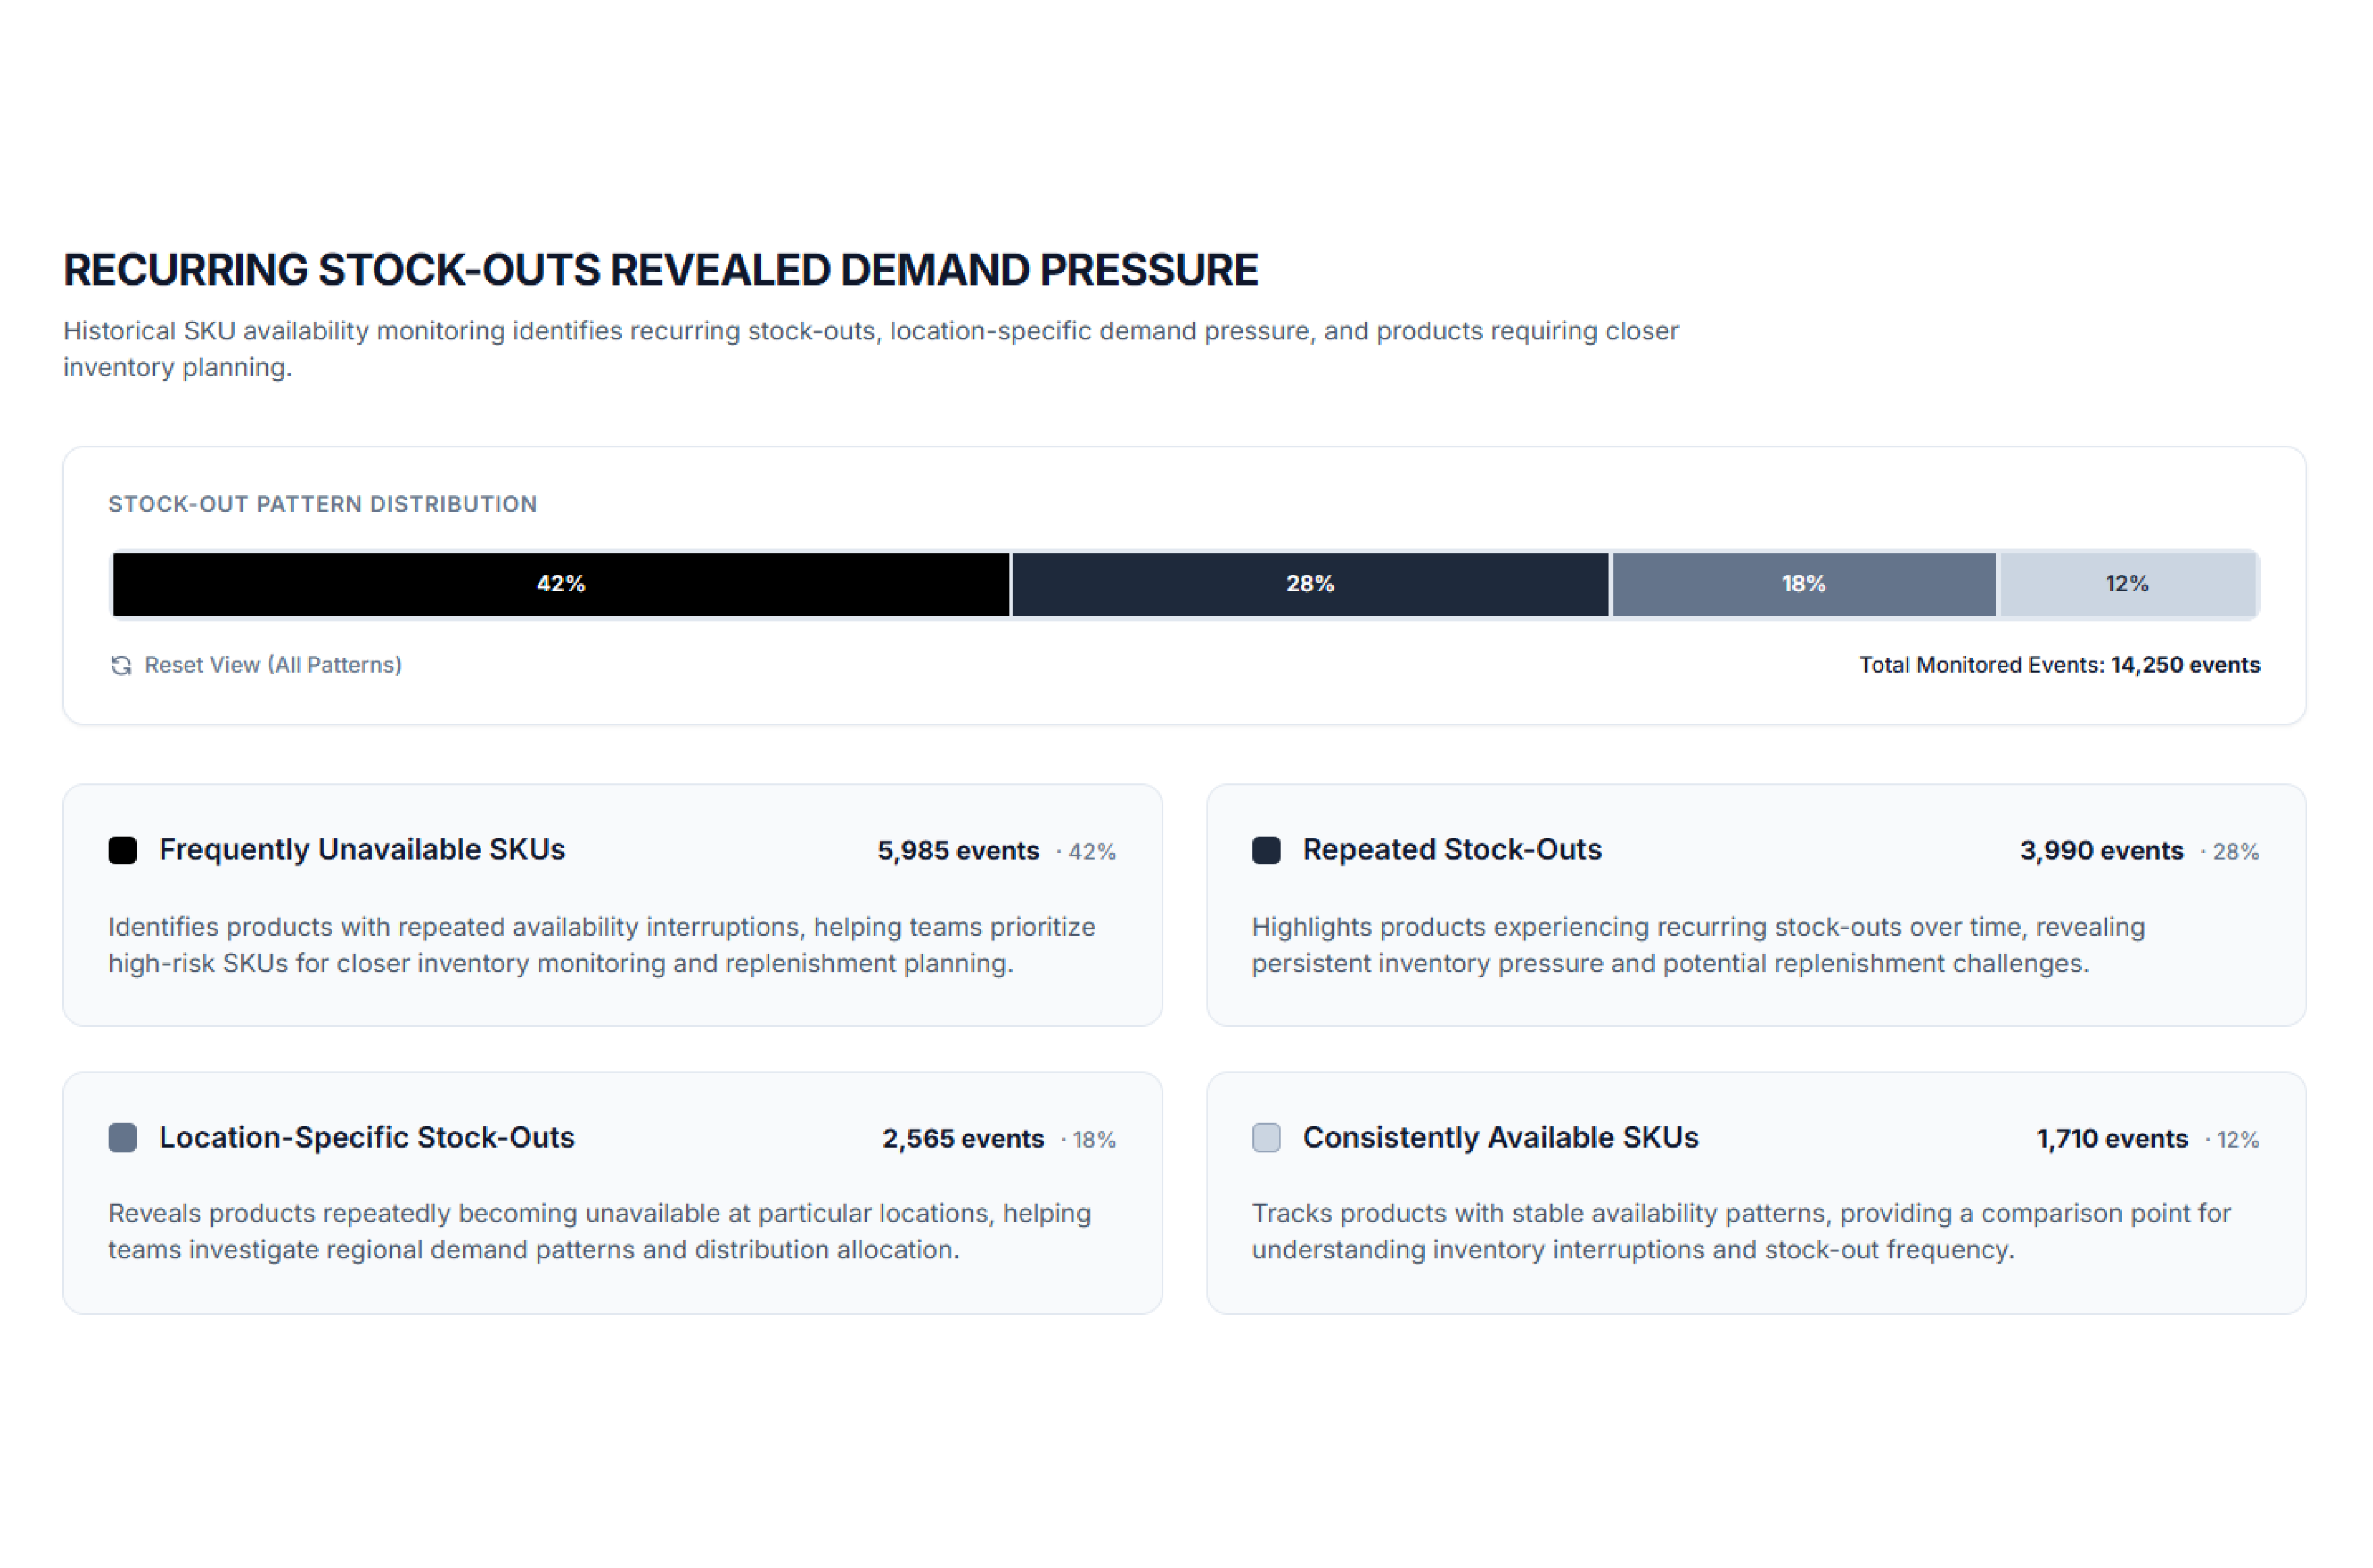
Historical availability data revealed that some products were not experiencing random stock-outs.
Instead, repeated patterns appeared around particular SKUs and locations.
Products with frequent availability interruptions were often associated with high customer interest, regional demand concentration, promotional periods, or replenishment limitations.
The historical dataset allowed the client to calculate stock-out frequency and identify products that required closer inventory planning.
This changed the operational conversation from "Which products are unavailable today?" to "Which products repeatedly become unavailable, and where?"
Such intelligence provided greater value for forecasting and supply planning.
Teams could prioritize frequently interrupted SKUs for closer monitoring and investigate whether replenishment frequency or distribution allocation required adjustment.
The third finding involved significant differences in product availability between locations.
Some dark stores maintained broad FMCG assortments, while others showed lower availability across selected categories.
These differences provided valuable regional demand signals.
For instance, a beverage SKU might maintain strong availability across most monitored locations but demonstrate repeated stock-outs in selected high-demand areas.
Similarly, personal-care products could show stronger availability in some locations than others because of differences in customer preferences.
The client could therefore use dark-store availability as an additional market intelligence signal.
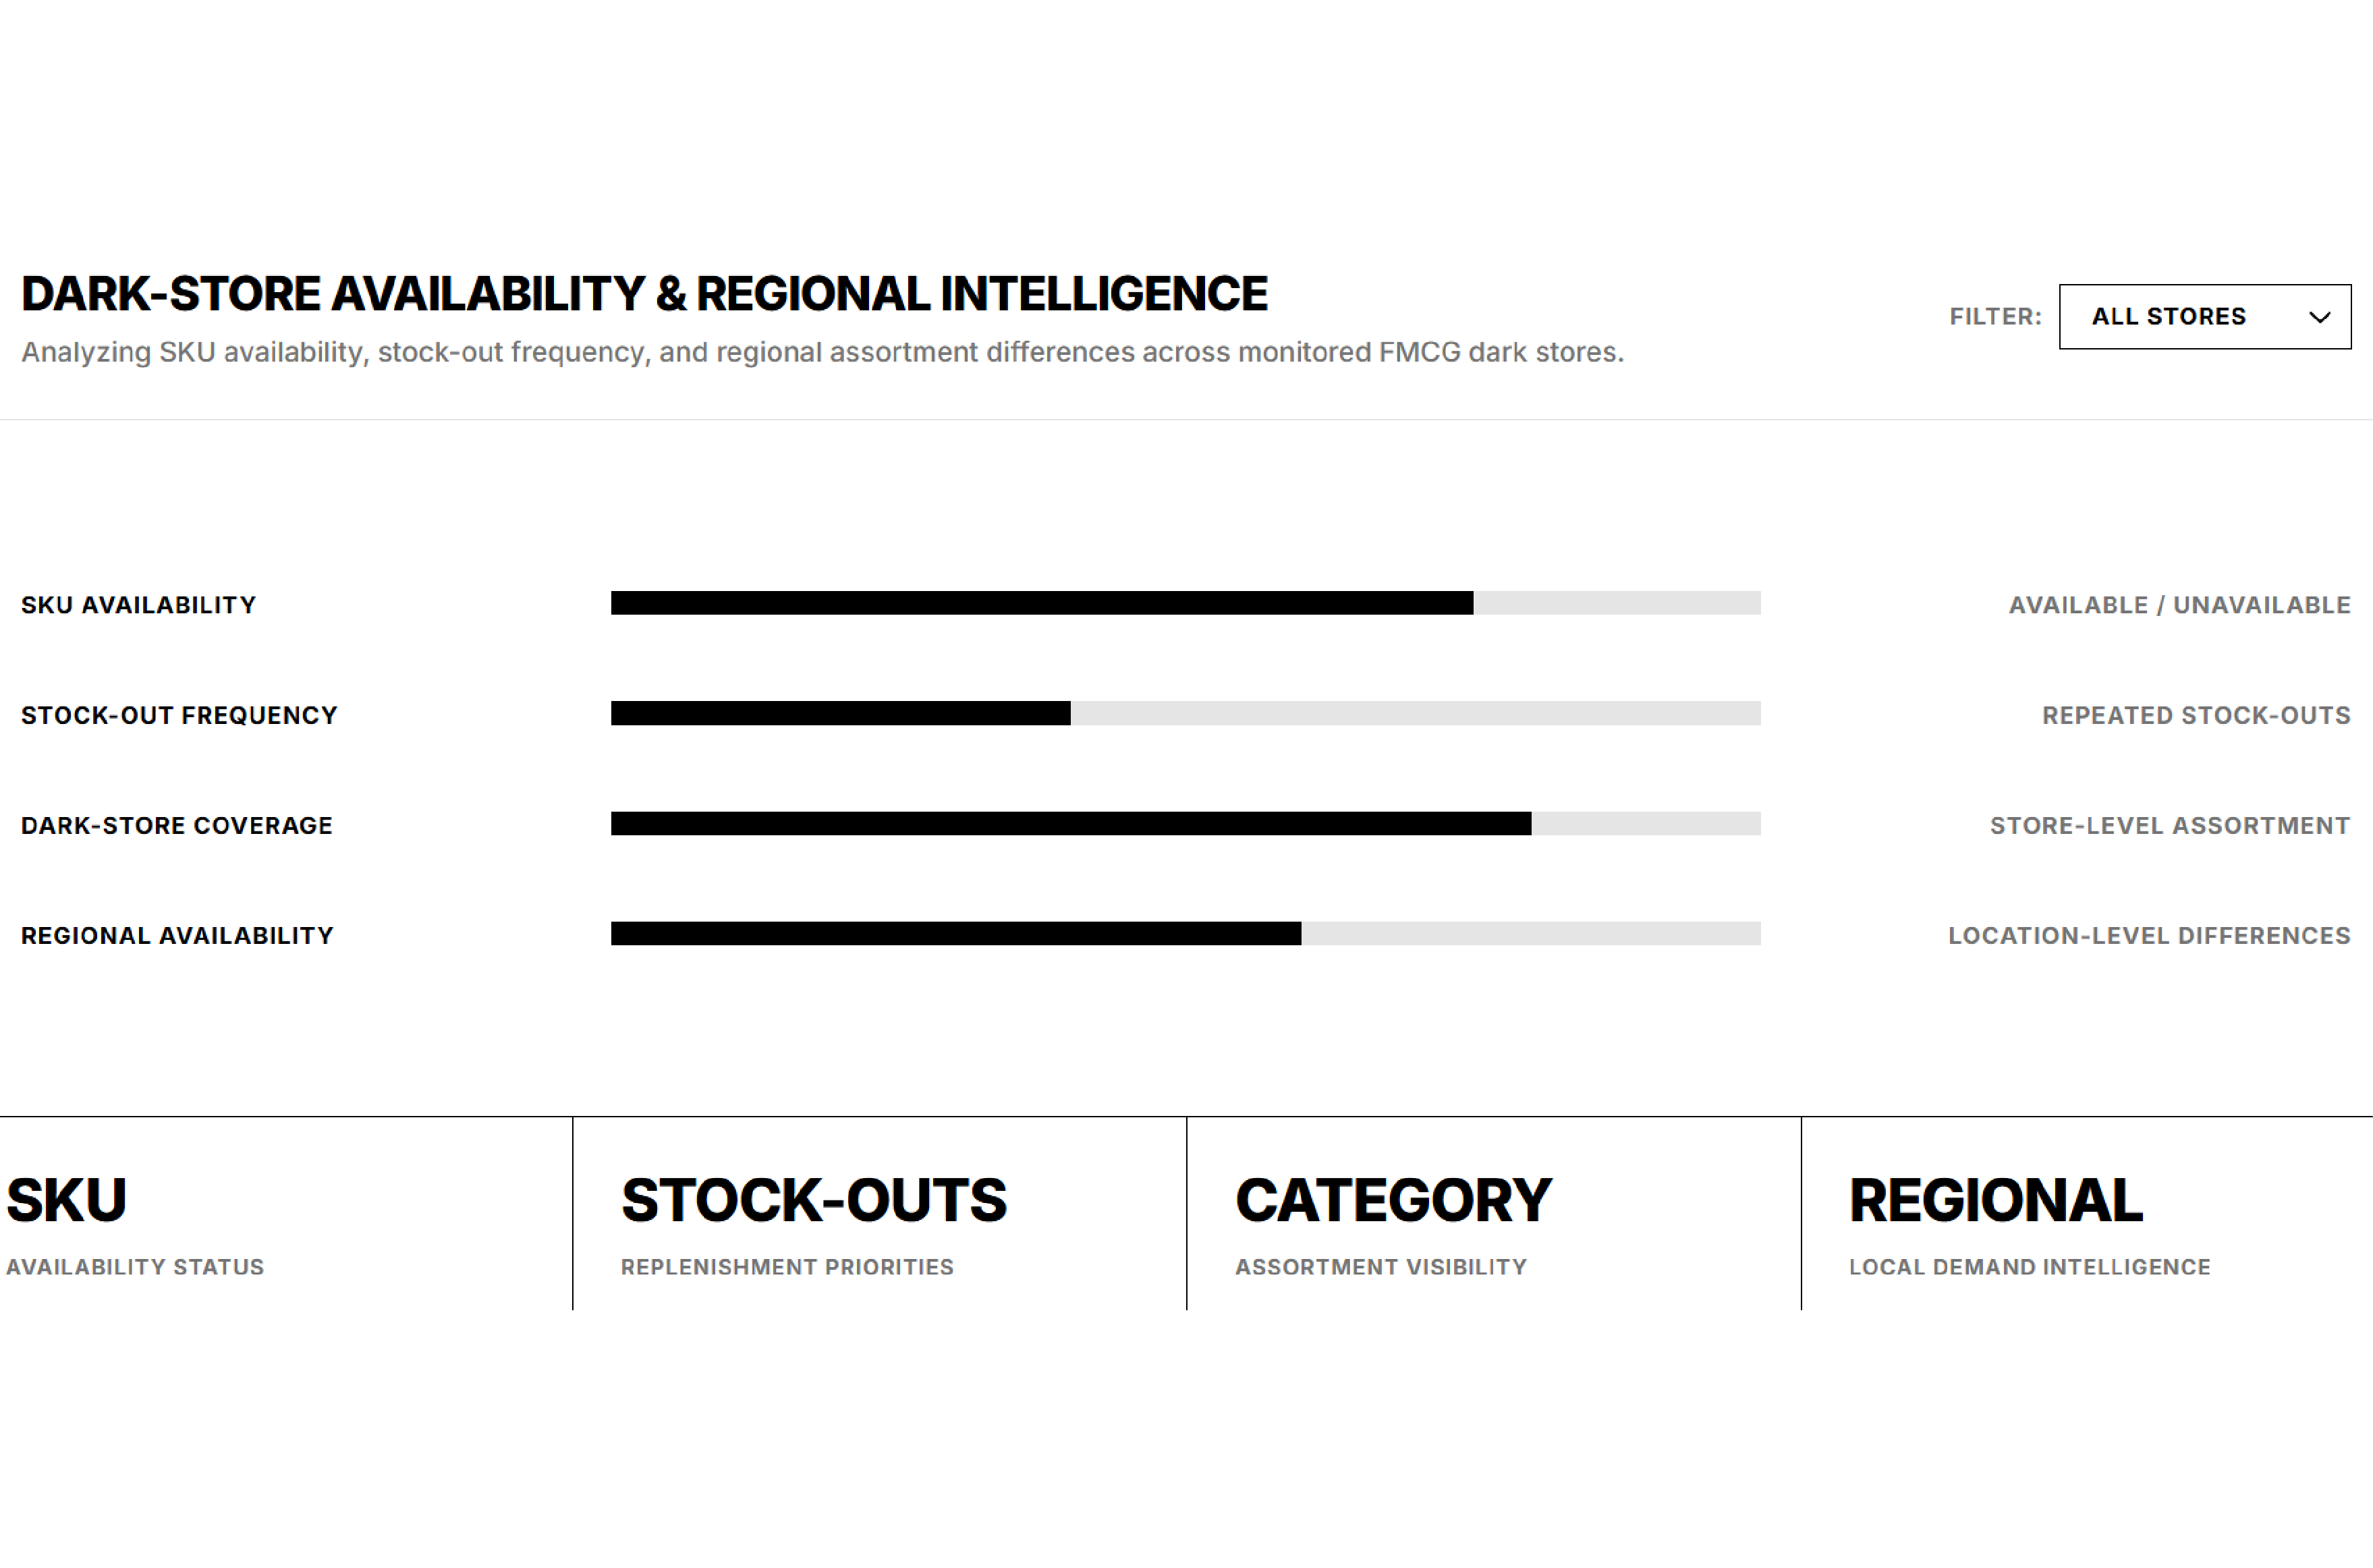
| Metric | Insight Captured | Business Impact |
|---|---|---|
| SKU Availability | Available vs unavailable products | Improved inventory visibility |
| Stock-Out Frequency | Repeated unavailable observations | Identification of replenishment priorities |
| Dark-Store Coverage | Number of stores carrying each SKU | Assortment visibility |
| Category Availability | Availability by FMCG category | Category-level planning |
| Daily Change | Availability movement between observations | Early detection of inventory disruption |
| Regional Availability | Store-level product differences | Local demand intelligence |
| SKU Volatility | Frequency of availability changes | Identification of unstable inventory patterns |
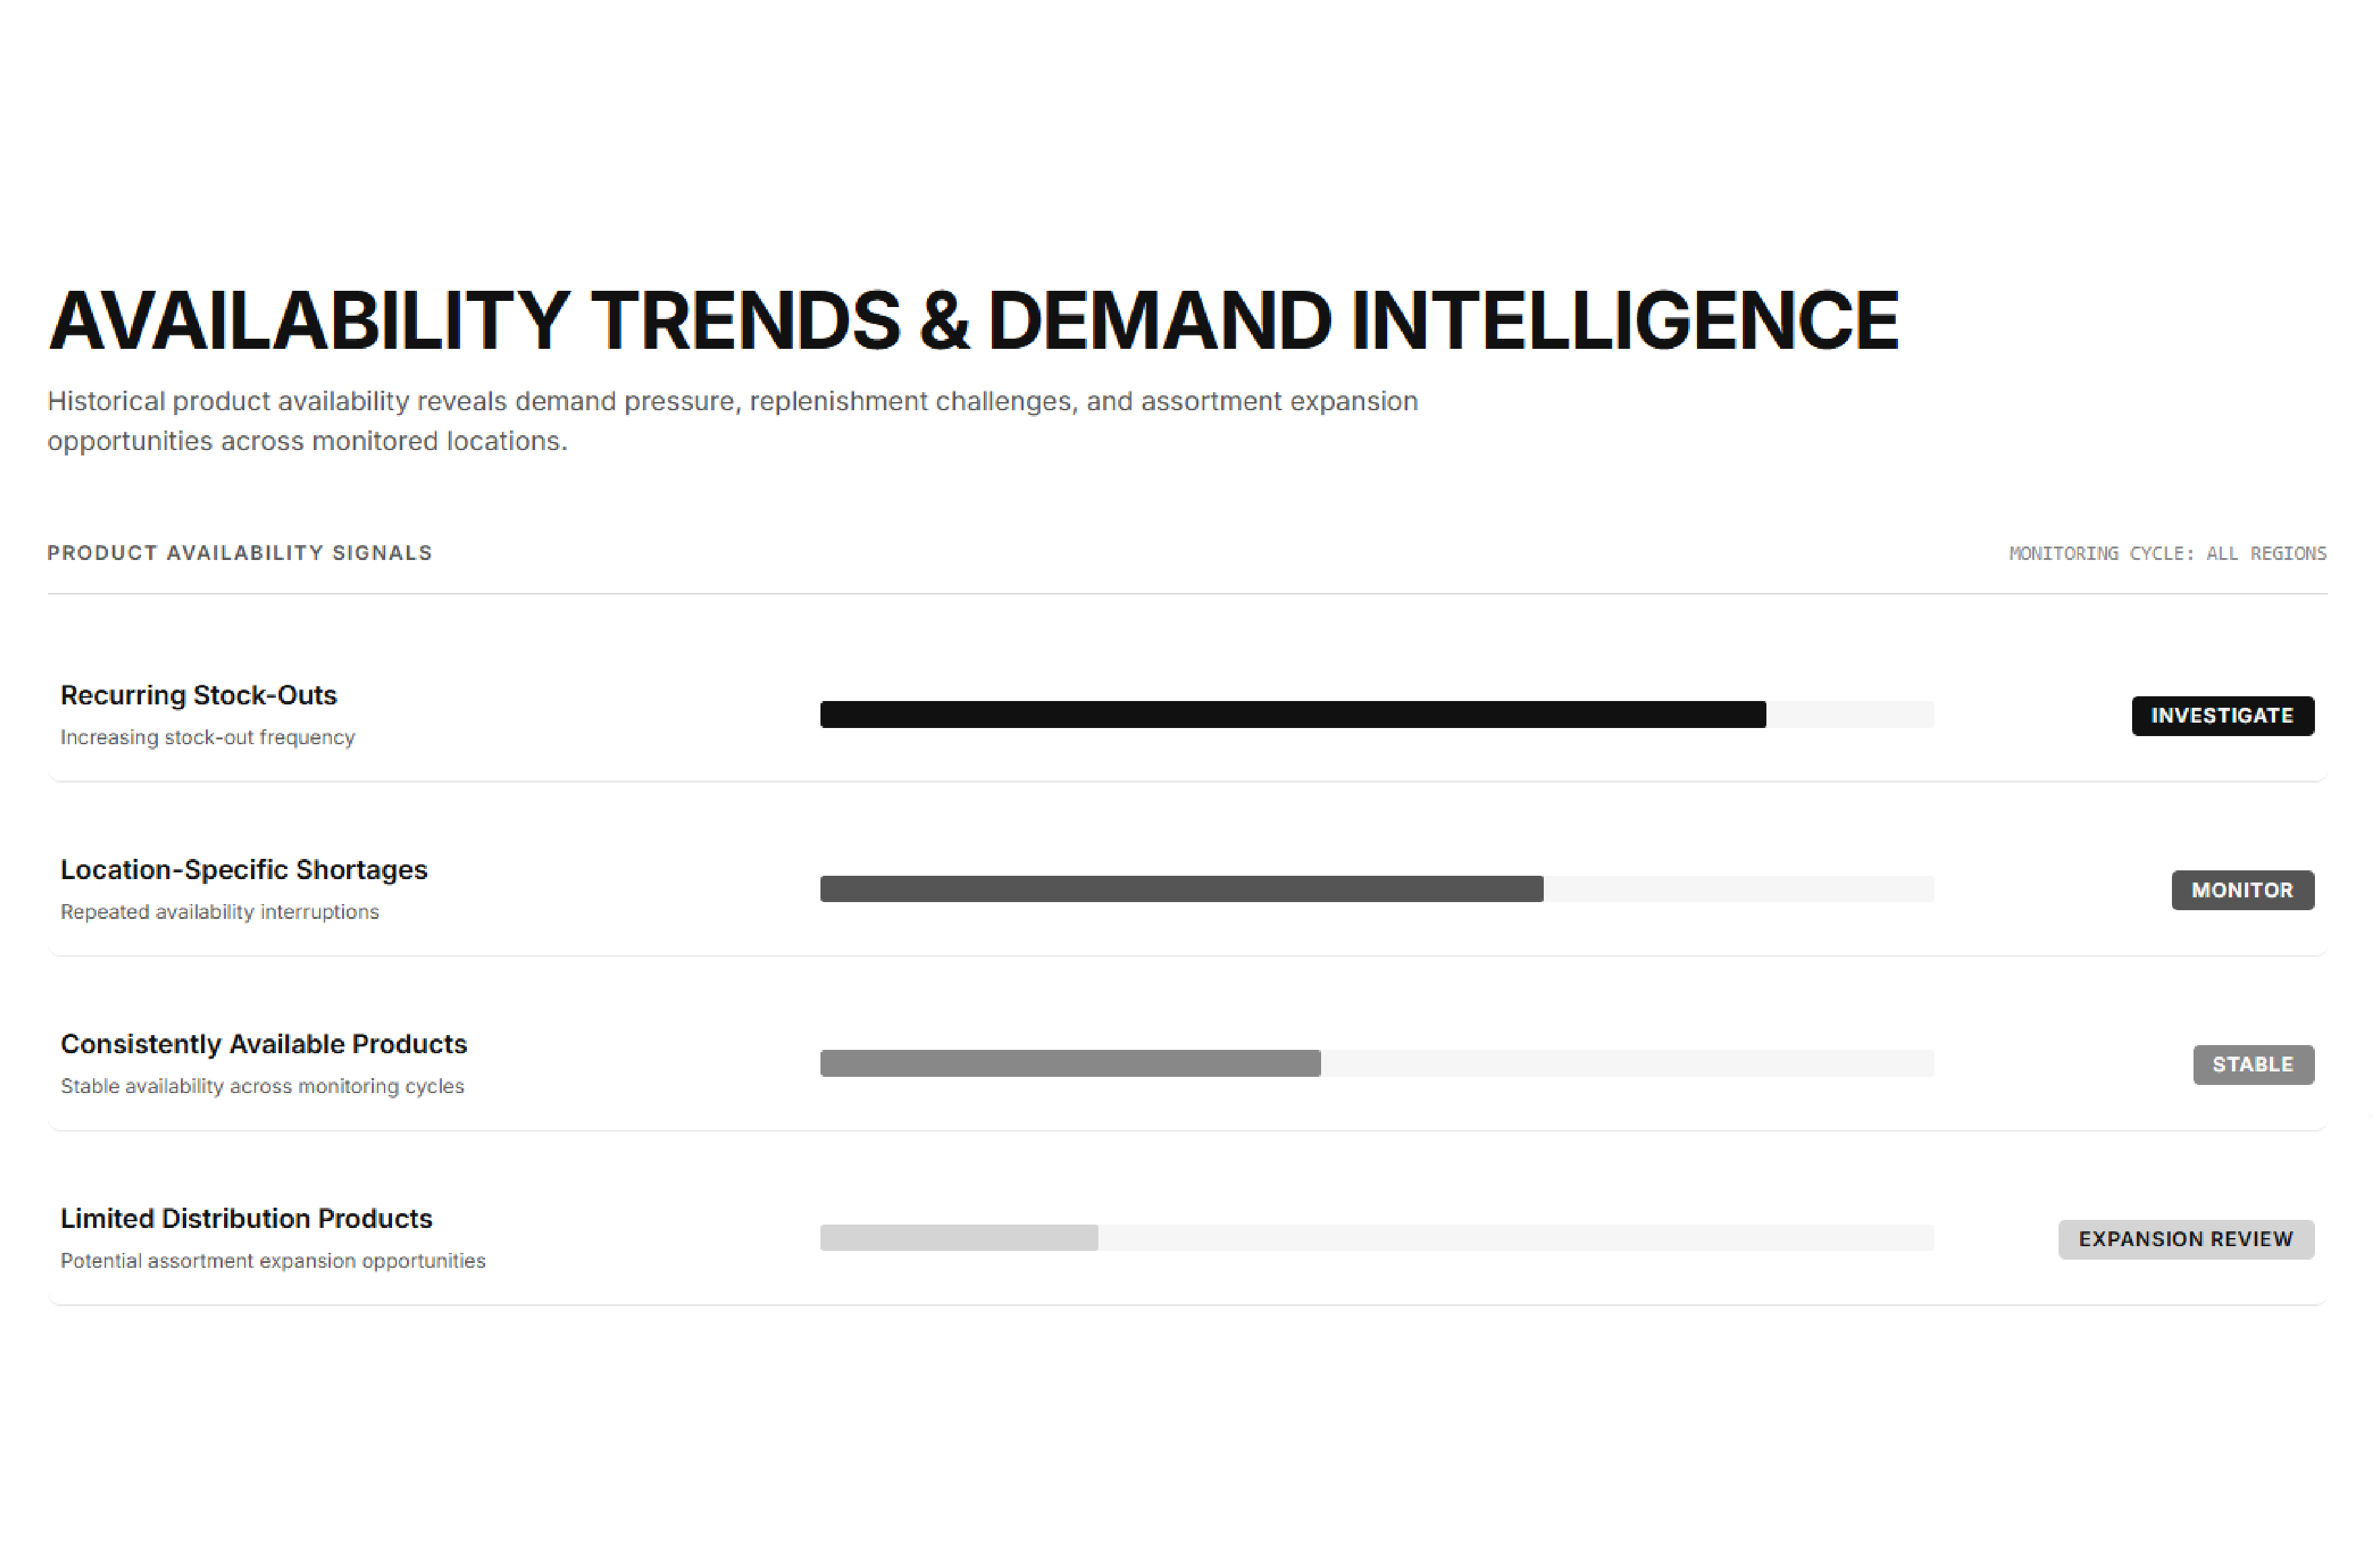
The fourth finding was that stock availability itself could become a valuable demand intelligence signal.
When a product repeatedly moved out of stock in specific locations, the pattern could indicate stronger consumer demand, limited supply, replenishment delays, or a combination of these factors.
Historical availability records allowed analysts to examine these patterns over multiple monitoring cycles.
Instead of treating stock-outs simply as operational failures, the organization began evaluating them as market signals.
Products with increasing stock-out frequency could be flagged for deeper demand investigation.
Likewise, products that remained consistently available but demonstrated limited distribution could be evaluated for assortment expansion.
This transformed availability data into a strategic input for inventory planning and market analysis.
The sample dataset below demonstrates how the client structured daily Flipkart Minutes availability observations across selected FMCG products and dark-store locations.
| SKU | Category | Dark Store | Stock Status | Availability % | Stock-Out Days | Daily Change | Demand Signal |
|---|---|---|---|---|---|---|---|
| Premium Coffee 200g | Beverages | Store A | In Stock | 96% | 1 | Stable | High |
| Potato Chips 100g | Snacks | Store B | Out of Stock | 81% | 6 | Declining | Very High |
| Instant Noodles 70g | Packaged Food | Store C | In Stock | 94% | 2 | Stable | High |
| Shampoo 180ml | Personal Care | Store D | In Stock | 91% | 3 | Improving | Medium |
| Chocolate Bar 45g | Confectionery | Store E | Out of Stock | 76% | 9 | Declining | Very High |
| Dishwash Liquid 500ml | Household | Store F | In Stock | 98% | 0 | Stable | Medium |
| Breakfast Cereal 500g | Packaged Food | Store G | In Stock | 89% | 4 | Declining | High |
| Fruit Juice 1L | Beverages | Store H | In Stock | 95% | 1 | Improving | High |
| Face Wash 100ml | Personal Care | Store I | Out of Stock | 83% | 5 | Declining | Medium |
| Biscuits 250g | Snacks | Store J | In Stock | 97% | 1 | Stable | High |
The dataset provides a historical foundation for identifying products requiring attention and locations where availability performance differs from broader network averages.
After implementing structured daily stock intelligence, the client achieved measurable improvements in availability visibility and operational responsiveness.
The iWeb approach provides scalable data collection designed around the requirements of quick-commerce and FMCG intelligence.
The first advantage is centralized availability intelligence. Product information from multiple dark-store observations can be transformed into a consistent dataset, allowing business teams to evaluate SKU availability without manually comparing individual listings.
The second advantage is historical stock visibility. Daily observations create a time-series dataset that can reveal recurring stock-outs, improving the ability to distinguish temporary availability interruptions from persistent inventory issues.
Another benefit is location-level monitoring. Dark-store intelligence provides greater granularity than national or platform-wide availability metrics, allowing teams to identify regional differences in product availability.
The system also supports scalable monitoring. As product portfolios expand, additional SKUs and locations can be incorporated into the monitoring framework without creating proportional increases in manual workload.
"We were looking for a reliable way to understand product availability across our quick-commerce footprint without depending on repetitive manual checks. The solution provided a much clearer view of SKU-level stock performance across dark stores.
The historical data has been particularly valuable because it allows our teams to identify recurring stock-outs instead of reacting to individual availability issues. We now have better visibility into product distribution, regional differences, and potential demand signals.
The accuracy, consistency, and speed of the monitoring framework have significantly improved our reporting and operational decision-making."
— Head of E-Commerce & Digital Intelligence
The final outcome was a scalable daily stock intelligence framework that transformed fragmented Flipkart Minutes availability observations into structured business intelligence.
The client gained a consistent view of SKU-level availability across more than 40 dark stores, allowing teams to identify stock-outs, availability gaps, and regional inventory differences with greater precision.
The implementation of Stock-out and availability tracking created a reliable mechanism for identifying recurring product interruptions and prioritizing SKUs requiring additional operational attention.
The organization also gained stronger Market trend and demand intelligence by analyzing historical availability patterns and identifying products showing increased stock-out frequency in specific locations.
The system reduced reliance on manual searches and spreadsheet-based monitoring while improving the consistency of daily reporting.
Continuous Managed web scraping supported ongoing data collection and enabled the monitoring framework to scale alongside increasing SKU volumes and dark-store coverage.
The resulting dataset became useful across several business functions, including supply-chain planning, category management, digital commerce, market intelligence, and demand forecasting.
Teams could identify products with consistently strong availability, products experiencing recurring stock-outs, and locations where assortment coverage needed improvement.
Daily monitoring helps FMCG brands understand SKU availability across locations, identify recurring stock-outs, detect regional inventory differences, and evaluate customer-facing product visibility more consistently.
A structured monitoring system can capture product names, categories, availability status, location information, timestamps, product attributes, and historical availability observations depending on the required dataset.
Dark-store monitoring provides location-level visibility into product availability. It helps brands identify regional stock gaps, recurring product interruptions, assortment differences, and potential demand concentration.
Yes. Historical availability patterns can provide additional signals for demand analysis. Repeated stock-outs, changing availability frequency, and location-specific patterns can support broader forecasting and market intelligence models.
The framework can be designed to support growing SKU portfolios and additional dark-store locations. Automated collection and standardized processing reduce the manual workload associated with expanding monitoring coverage.
Fields marked * are required. Everything else just helps us scope faster — skip what you don't know yet.