Introduction
The American strip mall and downtown corridor form one of the most fast-food-saturated retail environments in the world. More than 200,000 quick-service and fast-casual outlets now trade across the United States, and in the busiest metro corridors three, four, even five major brands compete within a few hundred yards of one another. For the chains still opening sites, that density is the central strategic problem: in a saturated pitch, the next restaurant rarely creates new demand — it splits the demand already there.
This report maps the 2026 US footprint of America's largest quick-service restaurant (QSR) brands and converts raw outlet counts into a saturation view: where brands cluster, where they compete head-to-head, and where genuine white space survives. It draws on iWebDataScraping's US fast-food store location data — a fully geocoded dataset covering brand, address, ZIP code, format and coordinates — and pairs the national picture with the catchment methodology that franchise developers, delivery operators and investors rely on. Unlike a plain outlet count, this is a decision-grade map of where the American high street is already full.
The US QSR landscape in 2026
The US quick-service market in 2026 is bigger, and more contested, than at any point in its history. The category has been reshaped by three trends: the rise of drive-thru-first formats, the shift of demand onto delivery apps, and the relentless expansion of value-led coffee and sandwich chains. The clearest symbol of that shift is Subway, which has held onto the largest branded footprint in the country by outlet count even as it has closed thousands of underperforming stores over the past decade, while Starbucks has kept pace on sheer store count without ever positioning itself as a fast-food chain.
Format matters as much as brand. A drive-thru McDonald's on a suburban arterial road, a Starbucks inside a grocery store, and a delivery-only kitchen fulfilling branded orders are three different businesses competing for overlapping demand. Any credible analysis of saturation has to separate them, which is why fast-food store location data needs to carry format and channel, not just a brand name and a pin on a map. Meanwhile, the value-menu logic that reshaped grocery is now visible in QSR too, as brands chase footfall in the secondary metros the majors once ignored.
Brand footprints: the numbers
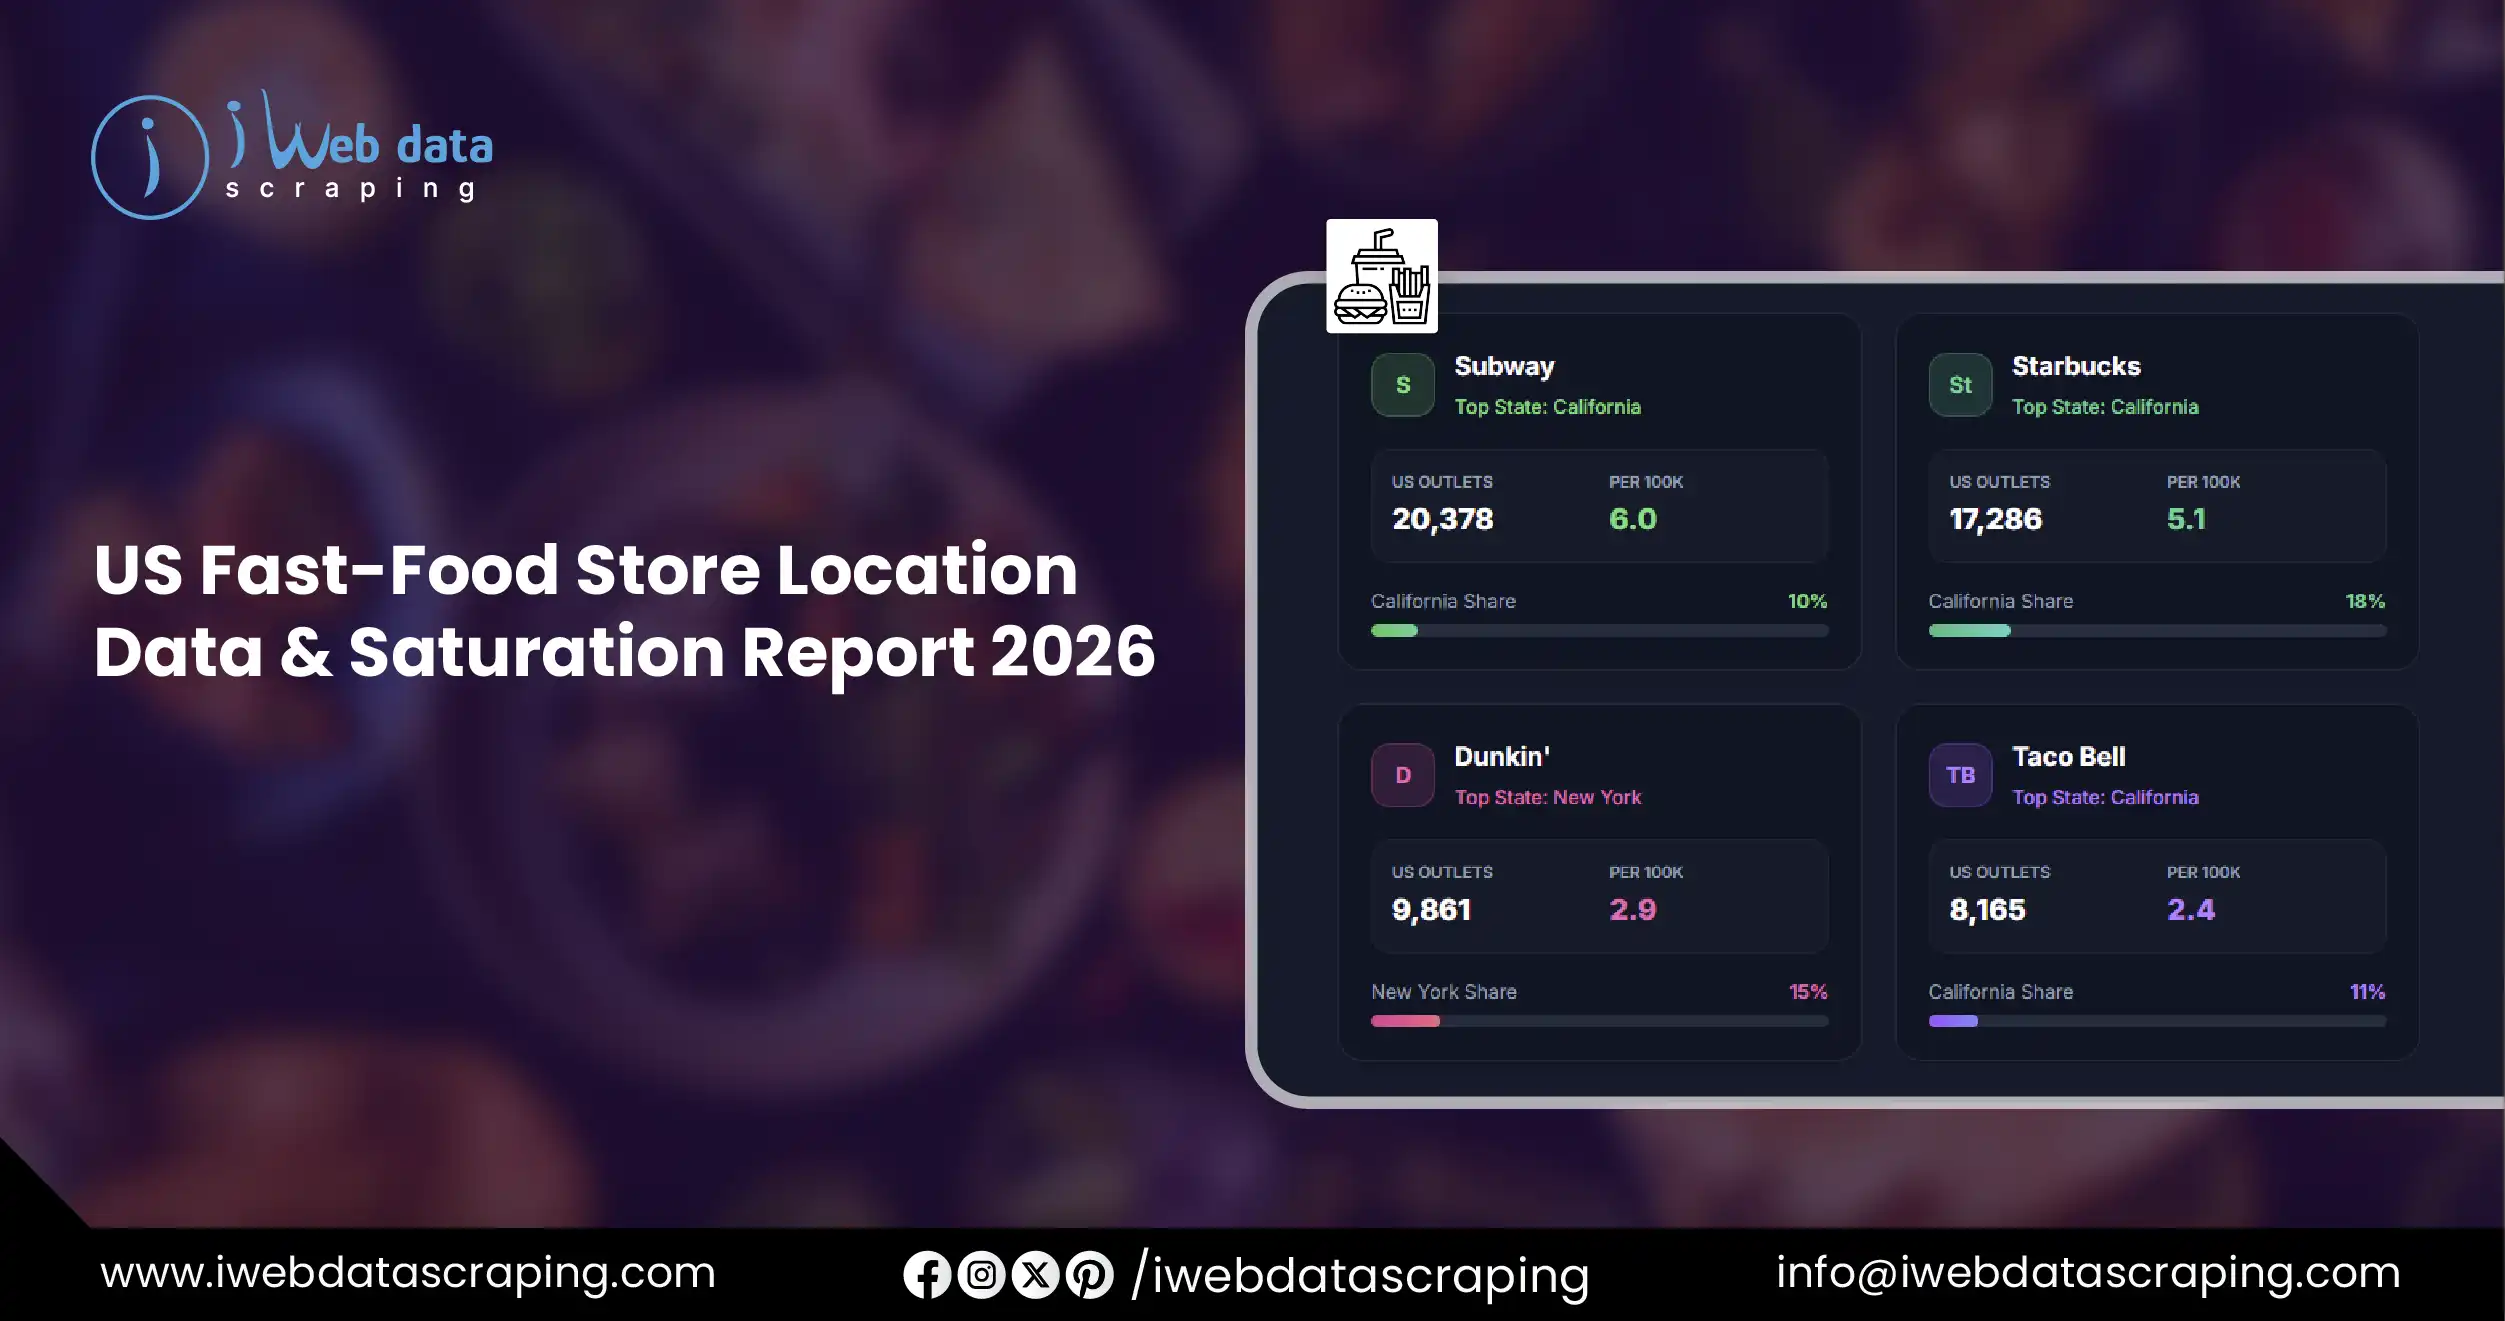
The table below sets the 2026 baseline. Outlets-per-100,000 figures are derived from national counts against a US population of roughly 341 million. Figures are drawn from public store-locator aggregation (ScrapeHero, national location reports, mid-to-late 2026); Starbucks is shown for context but excluded from the burger/pizza/sandwich saturation model — a coffee-forward format sits alongside, not inside, the core fast-food competitive set.
| Subway |
20,378 |
California |
10% |
6.0 |
| Starbucks |
17,286 |
California |
18% |
5.1 |
| McDonald's |
13,711 |
Texas |
9% |
4.0 |
| Dunkin' |
9,861 |
New York |
15% |
2.9 |
| Taco Bell |
8,165 |
California |
11% |
2.4 |
| Domino's |
7,108 |
Texas |
11% |
2.1 |
| Burger King |
6,560 |
Texas |
9% |
1.9 |
The ranking overturns the usual assumption that McDonald's dominates American fast food. On outlet count it is only third: Subway runs nearly 50% more shopfronts, and Starbucks — no longer just a coffee stop for most daypart occasions — also comfortably outnumbers it. McDonald's leads instead on brand pull and average unit volume, doing more business from fewer, larger sites; industry estimates put McDonald's US system-wide revenue at roughly $55 billion against Subway's approximately $8 billion, from fewer than half as many locations apiece. At the other end, Burger King and Domino's trail on footprint, which leaves both with visible white space in the under-served metros their rivals already occupy. For anyone who scrapes restaurant locations to model competition, that gap between count and clout is the first thing the data makes visible.
Methodology: measuring saturation
Outlet density tells you how much supply exists; catchment tells you whether that supply competes. iWebDataScraping models catchment as a radius or walk/drive-time band that flexes by area type, because a quarter-mile in a downtown core contains far more competing demand than the same distance on a suburban arterial:
- Urban core — a 0.25–0.75 mile catchment. Multi-brand overlap is the default; the question is how many brands, not whether.
- Suburban and strip-mall — a 1.0–2.0 mile catchment — the main arena for head-to-head QSR competition.
- Highway and rural — a 5.0-mile-plus catchment, often anchored by a single interstate-exit drive-thru with little direct competition.
Every outlet in the geocoded dataset is then tested for how many distinct major brands fall inside its catchment. Counting distinct brands per catchment — rather than total outlets — is what turns a store list into a saturation map, and it is the metric a plain count can never produce.
Density and per-capita reach
Per-capita figures expose how differently these brands cover the country. Subway, at roughly six outlets per 100,000 people, has built the densest branded network in US fast food; McDonald's, at one restaurant per ≈25,000 people, and Burger King, at one per ≈52,000, run leaner estates that lean on catchment size and drive-thru reach rather than sheer count. Those density gaps decide who wins a contested metro: a brand with three times the outlet density will nearly always be closer to the customer at the moment of impulse.
Regional concentration compounds the effect. No single state holds more than 18% of any brand's estate, and the saturation story is overwhelmingly Sun Belt and coastal-metro weighted, sharpest in Texas, California and Florida. The Mountain West and rural Midwest carry lower density and, outside their metro cores, long stretches of single-brand or no-brand territory — the clearest white space on the map.
Head-to-head: real overlap in high-density metros
This is where saturation stops being abstract. In the busiest metro counties the same four brands repeatedly cluster together — the clearest ground-level evidence of head-to-head contest. Figures below are illustrative, sized to the shape of a live metro-level pull; a production run replaces them with counts from the current dataset.
| Los Angeles County, CA |
71 |
88 |
46 |
39 |
| Harris County, TX (Houston) |
58 |
52 |
41 |
33 |
| Cook County, IL (Chicago) |
63 |
57 |
38 |
22 |
| Maricopa County, AZ (Phoenix) |
49 |
61 |
35 |
37 |
| Miami-Dade County, FL |
44 |
39 |
30 |
19 |
Every one of these counties is a live four-way contest, but the texture differs. Los Angeles and Phoenix skew heavily to Starbucks, which outnumbers McDonald's by a wide margin — a market where the coffee-and-food-to-go format has decisively won the daypart battle. Houston is the most evenly matched between Subway and Starbucks, with McDonald's and Taco Bell both within striking distance; it is exactly the kind of contested market where a fifth entrant risks pure cannibalization. Chicago and Miami-Dade show Subway leading on raw dispersion, a reminder that national rank hides very different local realities. This is the granularity competitive-intelligence teams pay for, and that count-only reports simply cannot offer.
The Saturation Index
Applying the catchment model to the full geocoded QSR estate produces the Saturation Index — a set of metrics that rank every populated ZIP code by competitive intensity:
- Brand-Count-Per-Catchment — how many distinct major brands fall inside each ZIP's catchment (1, 2, 3, 4, 5+).
- 3+ Brand Saturation Score — the share of populated ZIP codes where three or more major QSR brands compete.
- White-space ZIPs — populated ZIP codes with zero or one major brand present — the clearest entry opportunities.
The table below is an illustrative sample of the Index output. The figures are worked examples that show the shape of the analysis; in a live report they are replaced with values computed from the current dataset.
Sample / illustrative — Saturation Index output
| 90012 — Los Angeles |
Subway, Starbucks, McDonald's, Taco Bell |
4 |
16 |
| 60601 — Chicago |
Subway, Starbucks, Dunkin', Domino's |
4 |
13 |
| 77002 — Houston |
Subway, Starbucks, McDonald's |
3 |
10 |
| 33131 — Miami |
Starbucks, McDonald's, Burger King |
3 |
8 |
| 85003 — Phoenix |
Subway, Starbucks |
2 |
5 |
Read this as a heat map of competitive risk. A ZIP with four brands and well over a dozen outlets is effectively closed — a new opening there almost certainly steals share rather than creating it. A ZIP with one or two brands and solid footfall is where a well-placed site still grows the market. Publishing the ranked most-saturated and white-space tables side by side is the highest-converting element of a report like this: one warns operators off cannibalizing pitches, the other hands them a shortlist of viable ones.
Sample data: what the dataset looks like
Every figure in this report traces back to one underlying asset: a geocoded record for each outlet. When you scrape McDonald's locations — or any other chain — the useful output is not a headline number but a clean, structured row per site. The sample below shows the core fields in an iWebDataScraping fast-food store location dataset (values are illustrative).
Sample / illustrative — dataset record structure
| Subway |
Subway Downtown LA |
523 S Spring St |
90013 |
Storefront |
34.0459, -118.2504 |
| McDonald's |
McDonald's Midtown Houston |
2100 Travis St |
77002 |
In-center |
29.7472, -95.3728 |
| Starbucks |
Starbucks Loop Chicago |
151 N State St |
60601 |
Storefront |
41.8838, -87.6279 |
| Taco Bell |
Taco Bell Camelback |
3401 N Central Ave |
85012 |
Drive-thru |
33.4791, -112.0731 |
| Domino's |
Domino's Wynwood Miami |
250 NW 25th St |
33127 |
Delivery |
25.8009, -80.1997 |
Each record can be enriched with city, metro area, channel (dine-in, drive-thru, delivery-only), opening hours and a last-verified date. Delivered as CSV, Excel or via API, this is the raw material behind every map, catchment model and saturation score in this report.
Who uses this data, and why
The buyers of fast-food store location data fall into four broad groups, each with a distinct question:
- Franchise developers and QSR expansion teams — avoid cannibalizing existing sites and target genuine white space before committing to a new lease.
- Delivery and dark-store operators — map demand density and competitive intensity before committing to a kitchen footprint.
- Commercial property and landlords — benchmark the F&B saturation of a pitch before signing tenants.
- Investors and analysts — read chain expansion and saturation as an alternative-data growth signal.
What unites them is a need for data that is current, complete and geocoded. A count that is six months stale, or that silently mixes a kiosk with a full restaurant, leads to the wrong decision — which is why refresh cadence and clear format definitions matter as much as raw coverage.
How iWebDataScraping builds it
Behind the report sits a straightforward pipeline. iWebDataScraping's store location data scraping process collects every outlet from official store-locator sources, standardises and validates the address, geocodes it to latitude and longitude, tags the format and channel, and cross-checks against secondary sources to catch closures and new openings. The result is a retail store location dataset refreshed on the client's schedule — weekly, monthly or quarterly — so the numbers never drift into the stale territory that undermines count-only competitors. The same pipeline extends across every US retail category, from grocery to pharmacy to quick-service restaurants.
Conclusion
The US fast-food map looks crowded, but the useful questions all live beneath the outlet count. How many brands really compete in a given metro? Where does another drive-thru simply split the line at the last one? And where, in the ZIP codes the majors overlooked, does real growth still exist? Answering them takes more than a number — it takes complete, current, geocoded fast-food store location data and a consistent method for turning it into a saturation map. That is what this report, and the dataset behind it, is built to deliver.
Experience top-notch web scraping service and mobile app scraping solutions with iWeb Data Scraping. Our skilled team excels in extracting various data sets, including retail store locations and beyond. Connect with us today to learn how our customized services can address your unique project needs, delivering the highest efficiency and dependability for all your data requirements.